Abstract
Dialysis unphysiology was first discussed by Carl Kjellstrand in 1975 for the possible negative effects of the unphysiology of intermittent dialysis treatment. Current hemodialysis practices are still unphysiologic because they cannot keep blood chemistries within normal limits, both before and after dialysis. In addition, the discontinuous nature of hemodialysis causes saw-tooth volume fluctuations, and the extracellular fluid volume expansion during the interdialytic period may lead to hypertension and adverse cardiovascular consequences. Sodium, which is accumulated over the interdialytic period, may be divided into two fractions. The one is the fraction of osmotically active sodium which is mainly confined to the extracellular space, and the other is that of water-free (osmotically inactive) sodium which diffuses into the intracellular space. Both contribute to the pathogenesis of hypertension because the former may act to expand extracellular fluid volume and the latter may cause vasoconstriction in the long run by increasing cytosolic concentration of calcium in the vascular smooth muscle cells. Even in intensive hemodialysis, it may take several weeks to months for water-free sodium storage in the vascular smooth muscle cells to be relieved. This may be an explanation for the lag phenomenon, i.e., the delay of blood pressure decrease after normalization of extracellular fluid volume shown in the Tassin experience. Modest restriction of dietary sodium intake, the dialytic session length long enough to maintain a high ultrafiltration volume, and the reasonably low dialysate sodium concentration are required to avoid unphysiology of positive sodium balance in current hemodialysis practice.
Keywords: renal dialysis, sodium, physiology, hypertension
Introduction
The current dialytic therapy has brought brilliant success in prolonging patient survival in end-stage renal disease (ESRD). In addition to the control of uremia, it can prevent patients from extracellular volume (ECV) excess, dilutional hyponatremia, severe hyperkalemia and metabolic acidosis. However, it cannot keep patients in a steady state all the time because of its incomplete therapeutic efficacy.
The concept of homeostasis is a cornerstone of physiology. The concept of stability of the 'milieu interieur (internal environment)' was created by Claude Bernard in the middle of the 19th century, and it was developed to the concept of homeostasis by Walter Cannon and popularized in his book The Wisdom of the Body, published in 1932. Whereas normal kidneys contribute to maintaining milieu interieur in a steady state, the current routine dialytic treatment hardly offers ESRD patients homeostasis. Thus, we can say that the current dialytic therapy is "unphysiologic".
One of the unphysiologic consequences in hemodialysis patients is inadequate sodium balance. Sodium is accumulated over the interdialytic period, and sodium removal by dialysis may be insufficient because of the brief and discontinuous nature of routine dialytic therapy. Besides, supraphysiologic dialysate sodium concentrations which are frequently used in current practice may hamper normalizing sodium balance in hemodialysis patients.
Dialysis unphysiology
Carl Kjellstrand and his associates for the first time drew attention to the issue of possible negative effects of the unphysiology of intermittent dialysis treatment1). They formulated the "Unphysiology Hypothesis" which stated that side effects seemed particularly common in patients who experience great swings in body weight, urea (osmolality), and potassium (K+), and who had - as a consequence of their large fluid load - severe hypertension. In other words, the more "unphysiologic" dialysis is, and the more abnormal blood chemistries and fluid levels are before dialysis, the more violently they will change during dialysis and the more ill-effects those patients will experience. The faster and more violent the changes, the sicker the patients become2).
The best way which they contemplated to get rid of "unphysiology" was to dialyze often - i.e., dialyze daily. Keeping blood chemistries within normal limits may be impossible with three dialyses per week. Before each dialysis the patient would be fluid-overloaded, hyperkalemic, and acidotic. When dialysis is over, the opposite phenomena may occur. Thus the patient's body is never in a normal state; it is in an abnormal state, both before and after dialysis2).
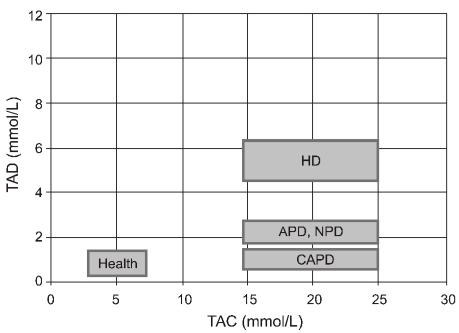
Lopot and Válek proposed two parameters for quantification of dialysis unphysiology: plasma urea time-averaged concentration (TAC) and time average deviation (TAD)3). The latter represents mean deviation of plasma urea concentration from the TAC4). The less frequent and thus less physiological the dialysis schedule, the higher will be the fluctuation of the plasma urea concentration and the higher the resulting TAD. Treatment outcome of a specific treatment schedule can be represented by a point on the TAC/TAD plot. Fig. 1 shows the TAC/TAD plot representing currently used renal replacement therapies and health. It was derived from an average patient with total body water of 42 L, negligible residual renal function and a protein catabolic rate (PCR) of 1 g/kg/day dialyzed with a urea clearance of 160 mL/min for the same total weekly time (and thus, equal to weekly cleared volume)3). It is noted that peritoneal dialysis has less TAD than intermittent hemodialysis.
Fig. 1.
The TAC/TAD plot from health and different treatment modalities of renal replacement (Adapted from the previous study3)). TAC, time-averaged concentration; TAD, time average deviation; HD, hemodialysis; APD, automated peritoneal dialysis; NPD, nocturnal peritoneal dialysis; CAPD, continuous ambulatory peritoneal dialysis.
Unphysiology of sodium balance in hemodialysis patients
In hemodialysis patients without residual renal function, intradialytic sodium removal should be matched with interdialytic sodium accumulation. Sodium removal during hemodialysis is carried out by convection and to a lesser degree by diffusion. However, with supraphysiologic dialysate sodium concentrations, diffusive influx from dialysate may occur, especially in patients with low predialytic plasma sodium concentrations5).
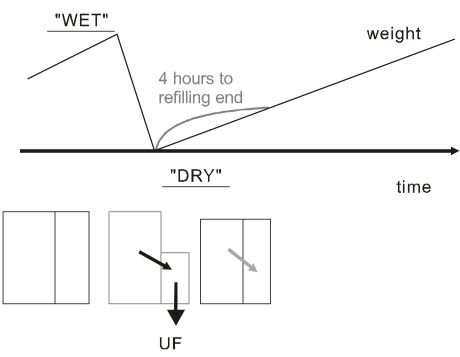
Over the interdialytic period, the ECV is expanded following sodium intake. The ECV changes occurring in the usual thrice weekly hemodialysis treatment are shown in Fig. 2. Owing to the intermittent nature of hemodialysis, the patient oscillates between a high-weight "wet" state just before the session, and a low weight "dry" state just at the end of the session6). Thus, we can say that the intermittent hemodialysis is "unphysiologic" in terms of sodium balance as well. The discontinuous nature of hemodialysis causes saw-tooth volume fluctuations, and the ECV expansion during the interdialytic period may lead to hypertension and adverse cardiovascular consequences.
Fig. 2.
Unphysiology of sodium balance in intermittent hemodialysis (Adapted from the previous study6)). The patient oscillates between "wet" and "dry" state just before and just after the session. The refilling of plasma volume from interstitial space takes a few hours after the dialysis. UF, ultrafiltration.
Fractions of sodium
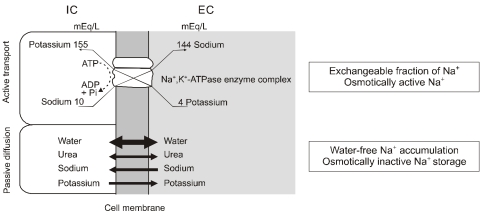
Sodium ions (Na+) may be divided into osmotically active and osmotically inactive fractions7). The traditional view is that Na+ and its accompanying anions are the principal extracellular osmoles and act to hold water in the extracellular space; conversely, K+ salts account for almost all the intracellular osmoles and act to hold water within the cells. Although the cell membrane is permeable to both Na+ and K+, these ions are able to act as effective osmoles because they are restricted to their respective compartments by the activity of the Na+,K+-ATPase pump in the cell membrane8). Thus, this fraction of Na+ is osmotically active because Na+ accumulation inevitably leads to water retention in the extracellular space (Fig. 3). In line with this concept, as shown originally by short-term isotope dilution studies done by Edelman et al.9), changes in the serum Na+ concentration reflect short-term changes in the exchangeable fraction of total body Na+ and K+ relative to total body water.
Fig. 3.
Fractions of sodium (Modified from the previous study8)). The Na+,K+-ATPase pump in the cell membrane actively transports sodium into the extracellular (EC) space, and Na+ also passively moves into the intracellular (IC) space. The former accompanies water movement and is osmotically active, and the latter does not accompany water movement and is osmotically inactive.
More recent data have suggested that large amounts of Na+ can be accumulated without accompanying water retention10, 11). Thus, plasma and extracellular water cannot be the only sites of Na+ and water metabolism, and tissues such as bone, cartilage and connective tissue may account for >50% of the total body Na+ content. Some osmotically inactive Na+ in the crystalline phase of bone was postulated in the 1960s12). This localization may be interpreted as "an internal Na+ escape into extracellular matrix components" to maintain the ECV despite a positive Na+ balance7). If this Na+ was bound in a "third" sodium space to negatively charged interstitial matrix components with polyanionic character or to the bone mineral, this bound Na+ would not readily equilibrate with the ECV (water-free Na+ accumulation) and thus would be osmotically inactive (Fig. 3). Under conditions of total starvation, however, this osmotically inactive Na+ can be mobilized and made available for exchange13). Recently, osmotically inactive sodium storage has been documented in humans11) and rats consuming a high-salt diet14).
The role of osmotically inactive Na+ storage in elevation of blood pressure
In patients with chronic renal failure, the blood pressure (BP), when related to urinary sodium excretion, rises exponentially with the decrease of creatinine clearance15). Intravascular volume-to-extracellular volume ratio increases more in patients with advanced renal insufficiency, and BP increases more in relation to the increase of ECV in these patients. The following Guyton's 2 examples show how, in the long run, small volume increases are associated with high BP increases16).
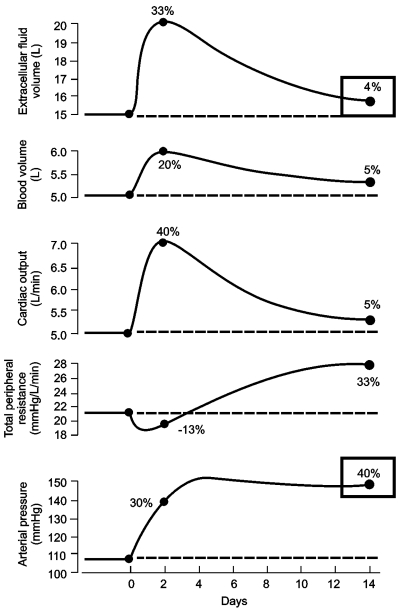
The first relates to changes in fluid volume and BP caused by hyperaldosteronism in humans. In one study, after hypertension was completely controlled by spironolactone, the drug was withheld for several weeks. During the next 2 weeks, extracellular fluid volume and BP increased by 20% to 40%. During the following 2 weeks, the ECV decreased toward normal, but BP remained elevated. Yet no other cause for the elevated BP was found in these patients, except for the small increase in fluid volume. Another example was a study on circulatory system variables, after acute volume loading in dogs with reduced kidney mass to 30%. The study showed, within 2 days, an increased extracellular fluid and blood volume, increased cardiac output, slight decrease in total peripheral resistance, and a rise in BP. Within the following few days, extracellular and blood volumes and cardiac output decreased; however, total peripheral resistance increased and BP remained elevated (Fig. 4)17).
Fig. 4.
Changes in circulatory variables after volume loading in dogs with reduced kidney mass to 30% (Modified from the previous study16)). Beginning at day 0, isotonic saline was infused for 2 weeks at about 6 times normal sodium intake. Note that at the fourteenth day extracellular fluid volume increased only 4% compared to day 0, but blood pressure increased 40%, mostly due to increased total peripheral resistance.
Guyton postulated that the BP remained elevated by increased total peripheral resistance due to autoregulation of blood flow at the tissue level16). Recently, however, the mechanisms leading to vasoconstriction in salt-dependent hypertension are being understood more clearly. Either excessive sodium intake or sodium retention by the kidneys and the consequent tendency toward plasma volume expansion lead to release of endogenous ouabain (EO) probably from the hypothalamus18). The Na+,K+-ATPase pumps in the vascular smooth muscle cells (VSMCs) are inhibited by the increase in plasma EO, resulting in the elevation of local Na+ on the submembrane area. This produces electrogenic depolarization of VSMCs and facilitates Ca2+ entry through the Na+/Ca2+ exchanger. The resulting rise in the cytosolic Ca2+ concentration should promote vasoconstriction and, in vivo, elevation of BP19).
The lag phenomenon: delayed decreases in BP after ECV normalization
Previous clinical observations revealed that the BP response to ECV reduction was delayed by some weeks. This represents the lag phenomenon, i.e., the delay of BP decrease after normalization of extracellular fluid volume17). It was first described in the middle of the twentieth century after introduction of the "rice diet"20, 21) and during treatment with thiazide diuretics22). In 1967, Scribner commented that "in many patients a time lag exists between reduction of ECV and adequate control of BP. Several days or weeks may be required for adequate control, even though striking weight loss and, presumably, reduction of ECV occurred immediately."23)
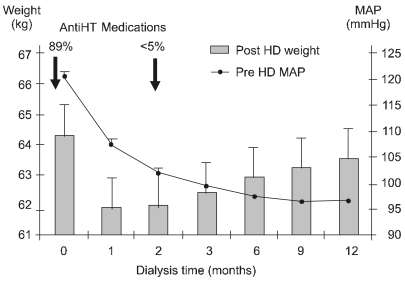
The time-dependent relationship between the ECV control by hemodialysis and the normalization of BP can be illustrated by the first year of dialysis of 712 patients started on hemodialysis in Tassin, France24). During the first month, ECV expressed by the postdialysis weight declined sharply by 2 to 3 kg. Predialysis mean arterial pressure also decreased rapidly. At 2 months, the postdialysis weight was stable, but BP continued to decrease. At that stage, antihypertensive medication was already stopped in almost all patients. Between 3 and 12 months, the curves crossed over, BP continued to decrease gently, but weight increased by several kilograms (Fig. 5). This gain in weight after 2 months was not related with an ECV increase but with the anabolic gain in lean and fat body mass following the start of dialysis25).
Fig. 5.
The lag phenomenon in first hemodialysis (HD) year from the experience in Tassin: delayed decreases in predialysis mean arterial pressure (MAP) after normalization of postdialysis weight (Modified from the previous study25)). Whereas almost 90% of patients were on antihypertensive (AntiHT) medications at the start of dialysis, <5% remained on antihypertensive drugs by the second month of dialysis when a true dry body weight was achieved.
There are several possible explanations for the lag phenomenon. First, vascular remodeling26), followed by a progressive reduction of peripheral resistances, is conceivable. Secondly, vasoactive middle molecular substances such as asymmetric dimethylarginine may be very slowly removed27). Thirdly, water-free sodium storage in the VSMCs may be very slowly relieved because of the restored Na+,K+-ATPase activity.
How to avoid sodium overload and hypertension in hemodialysis patients
With current hemodialysis practice, unphysiology of sodium balance is inevitable. Specifically, the liberalization of diet and short dialysis with a high sodium concentration in the dialysate are the main causes of positive sodium balance28).
According to the national survey performed in 2005, the average dietary sodium intake in Koreans was estimated to be 5.2 grams per day. Educating patients to restrict sodium intake <2 grams per day, while maintaining a good appetite, is not easy. Thus, reducing dietary sodium intake remains the most important tool in improving BP control in dialysis patients5), and a low-salt diet is more than ever a necessity in conventional hemodialysis29).
Sodium removal can be increased both by applying higher ultrafiltration volumes and by lowering dialysate sodium concentration5). However, the former may be difficult because of improper tolerance, and the latter may hamper the hemodynamic stability during the dialysis. The ultrafiltration rate is a major limiting factor because intravascular compartment refilling from the interstitium needs more time than is available with now-standard short sessions29). Thus, prolonging session length (long hemodialysis) will be desirable to improve hemodialysis tolerance while maintaining a high rate of ultrafiltration.
Current hemodialysis practices adopt a standard dialysate sodium prescription that is typically higher than the plasma sodium concentration of most patients. However, hypertonic dialysate sodium prescriptions, including sodium modeling, predispose to positive sodium balance and lead to higher BP and increased interdialytic weight gain6). Conversely, lowering or individualizing dialysate sodium reduces thirst, interdialytic weight gain, and BP in non-hypotension prone dialysis patients30). A random reduction of 3 mEq/L in dialysate sodium was well tolerated even by patients with preexisting hypotension31), and the sodium concentration in the dialysate may be reduced to <138 mEq/L28). It has become possible to individualize dialysate sodium concentration by means of online measurements of plasma conductivity and adjustment of dialysate conductivity by feedback technologies.
Conclusion
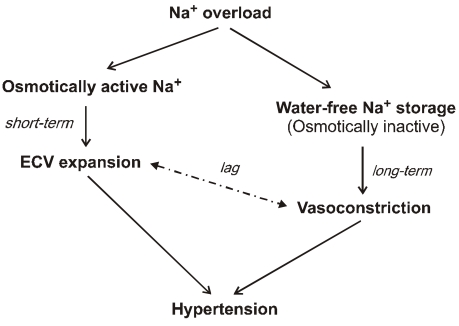
Sodium, which is accumulated over the interdialytic period in ESRD patients, may be divided into two fractions. The one is the fraction of osmotically active sodium which is mainly confined to the extracellular space, and the other is that of water-free (osmotically inactive) sodium which diffuses into the intracellular space. Both contribute to the pathogenesis of hypertension because the former may act to expand extracellular fluid volume and the latter may cause vasoconstriction in the long run by increasing cytosolic concentration of calcium in the vascular smooth muscle cells (Fig. 6). Even in intensive hemodialysis, it may take several weeks to months for water-free sodium storage in the vascular smooth muscle cells to be relieved. This may be an explanation for the lag phenomenon, i.e., the delay of blood pressure decrease after normalization of extracellular fluid volume shown in the Tassin experience. Modest restriction of dietary sodium intake, the dialytic session length long enough to maintain a high ultrafiltration volume, and the reasonably low dialysate sodium concentration are required to avoid unphysiology of positive sodium balance in current hemodialysis practice.
Fig. 6.
Dialysis unphysiology of sodium balance contributing to pathogenesis of hypertension. Osmotically active sodium acts to expand extracellular volume (ECV), and water-free (osmotically inactive) sodium causes vasoconstriction in the long run by increasing cytosolic concentration of calcium in the vascular smooth muscle cells. There is a time lag between corrections of ECV expansion and vasoconstriction for the resolution of hypertension.
References
- 1.Kjellstrand CM, Evans RL, Petersen RJ, Shideman JR, von Hartitzsch B, Buselmeier TJ. The "unphysiology" of dialysis: a major cause of dialysis side effects? Kidney Int. 1975;7(Suppl 2):30–34. [PubMed] [Google Scholar]
- 2.Home dialysis central [Internet] The Medical Education Institute. c2004-2009. [cited 2009 Sep 21]. Available from: http://www.homedialysis.org/
- 3.Lopot F, Valek A. Quantification of dialysis unphysiology. Nephrol Dial Transplant. 1998;13(Suppl 6):74–78. doi: 10.1093/ndt/13.suppl_6.74. [DOI] [PubMed] [Google Scholar]
- 4.Valek A, Lopot F. Uraemic toxins and blood purification strategies. Contrib Nephrol. 1989;70:178–187. doi: 10.1159/000416921. [DOI] [PubMed] [Google Scholar]
- 5.Kooman JP, van der Sande F, Leunissen K, Locatelli F. Sodium balance in hemodialysis therapy. Semin Dial. 2003;16:351–355. doi: 10.1046/j.1525-139x.2003.16070.x. [DOI] [PubMed] [Google Scholar]
- 6.Charra B. Fluid balance, dry weight, and blood pressure in dialysis. Hemodial Int. 2007;11:21–31. doi: 10.1111/j.1542-4758.2007.00148.x. [DOI] [PubMed] [Google Scholar]
- 7.Titze J. Water-free sodium accumulation. Semin Dial. 2009;22:253–255. doi: 10.1111/j.1525-139X.2009.00569.x. [DOI] [PubMed] [Google Scholar]
- 8.Stiller S, Bonnie-Schorn E, Grassmann A, Uhlenbusch-Körwer I, Mann H. A critical review of sodium profiling for hemodialysis. Semin Dial. 2001;14:337–347. doi: 10.1046/j.1525-139x.2001.00086.x. [DOI] [PubMed] [Google Scholar]
- 9.Edelman IS, Leibman J, O'Meara MP, Birkenfeld LW. Interrelations between serum sodium concentration, serum osmolarity and total exchangeable sodium, total exchangeable potassium and total body water. J Clin Invest. 1958;37:1236–1256. doi: 10.1172/JCI103712. [DOI] [PMC free article] [PubMed] [Google Scholar]
- 10.Heer M, Baisch F, Kropp J, Gerzer R, Drummer C. High dietary sodium chloride consumption may not induce body fluid retention in humans. Am J Physiol Renal Physiol. 2000;278:F585–F595. doi: 10.1152/ajprenal.2000.278.4.F585. [DOI] [PubMed] [Google Scholar]
- 11.Titze J, Maillet A, Lang R, et al. Long-term sodium balance in humans in a terrestrial space station simulation study. Am J Kidney Dis. 2002;40:508–516. doi: 10.1053/ajkd.2002.34908. [DOI] [PubMed] [Google Scholar]
- 12.Edelman IS, Leibman J. Anatomy of body water and electrolytes. Am J Med. 1959;27:256–277. doi: 10.1016/0002-9343(59)90346-8. [DOI] [PubMed] [Google Scholar]
- 13.Garnett ES, Ford J, Golding PL, Mardell RJ, Whyman AE. The mobilizaton of osmotically inactive sodium during total starvation in man. Clin Sci. 1968;35:93–103. [PubMed] [Google Scholar]
- 14.Titze J, Shakibaei M, Schafflhuber M, et al. Glycosaminoglycan polymerization may enable osmotically inactive Na+ storage in the skin. Am J Physiol Heart Circ Physiol. 2004;287:H203–H208. doi: 10.1152/ajpheart.01237.2003. [DOI] [PubMed] [Google Scholar]
- 15.Koomans HA, Roos JC, Boer P, Geyskes GG, Mees EJ. Salt sensitivity of blood pressure in chronic renal failure. Evidence for renal control of body fluid distribution in man. Hypertension. 1982;4:190–197. doi: 10.1161/01.hyp.4.2.190. [DOI] [PubMed] [Google Scholar]
- 16.Guyton AC. Kidneys and fluids in pressure regulation. Small volume but large pressure changes. Hypertension. 1992;19(Suppl 1):I2–I8. doi: 10.1161/01.hyp.19.1_suppl.i2. [DOI] [PubMed] [Google Scholar]
- 17.Twardowski ZJ. Sodium, hypertension, and an explanation of the "lag phenomenon" in hemodialysis patients. Hemodial Int. 2008;12:412–425. doi: 10.1111/j.1542-4758.2008.00304.x. [DOI] [PubMed] [Google Scholar]
- 18.Murrell JR, Randall JD, Rosoff J, et al. Endogenous ouabain: upregulation of steroidogenic genes in hypertensive hypothalamus but not adrenal. Circulation. 2005;112:1301–1308. doi: 10.1161/CIRCULATIONAHA.105.554071. [DOI] [PubMed] [Google Scholar]
- 19.Blaustein MP, Zhang J, Chen L, Hamilton BP. How does salt retention raise blood pressure? Am J Physiol Regul Integr Comp Physiol. 2006;290:R514–R523. doi: 10.1152/ajpregu.00819.2005. [DOI] [PubMed] [Google Scholar]
- 20.Kempner W. Treatment of hypertensive vascular disease with rice diet. Am J Med. 1948;4:545–577. doi: 10.1016/0002-9343(48)90441-0. [DOI] [PubMed] [Google Scholar]
- 21.Murphy RJ. The effect of "rice diet" on plasma volume and extracellular fluid space in hypertensive subjects. J Clin Invest. 1950;29:912–917. doi: 10.1172/JCI102325. [DOI] [PMC free article] [PubMed] [Google Scholar]
- 22.Conway J, Lauwers P. Hemodynamic and hypotensive effects of long-term therapy with chlorothiazide. Circulation. 1960;21:21–27. doi: 10.1161/01.cir.21.1.21. [DOI] [PubMed] [Google Scholar]
- 23.Blumberg A, Nelp WB, Hegstrom RM, Scribner BH. Extracellular volume in patients with chronic renal disease treated for hypertension by sodium restriction. Lancet. 1967;2:69–73. doi: 10.1016/s0140-6736(67)92061-2. [DOI] [PubMed] [Google Scholar]
- 24.Charra B, Bergstrom J, Scribner BH. Blood pressure control in dialysis patients: importance of the lag phenomenon. Am J Kidney Dis. 1998;32:720–724. doi: 10.1016/s0272-6386(98)70147-7. [DOI] [PubMed] [Google Scholar]
- 25.Charra B. Fluid balance, dry weight, and blood pressure in dialysis. Hemodial Int. 2007;11:21–31. doi: 10.1111/j.1542-4758.2007.00148.x. [DOI] [PubMed] [Google Scholar]
- 26.Gibbons GH, Dzau VJ. The emerging concept of vascular remodeling. N Engl J Med. 1994;330:1431–1438. doi: 10.1056/NEJM199405193302008. [DOI] [PubMed] [Google Scholar]
- 27.Khosla UM, Johnson RJ. Hypertension in the hemodialysis patient and the "lag phenomenon": insights into pathophysiology and clinical management. Am J Kidney Dis. 2004;43:739–751. doi: 10.1053/j.ajkd.2003.12.036. [DOI] [PubMed] [Google Scholar]
- 28.Perez-Garcia R, Lopez-Gomez JM, Jofre R, Junco E, Valderrabano F. Haemodialysis dose, extracellular volume control and arterial hypertension. Nephrol Dial Transplant. 2001;16(Suppl 1):98–101. doi: 10.1093/ndt/16.suppl_1.98. [DOI] [PubMed] [Google Scholar]
- 29.Charra B, Chazot C. The neglect of sodium restriction in dialysis patients: a short review. Hemodial Int. 2003;7:342–347. doi: 10.1046/j.1492-7535.2003.00060.x. [DOI] [PubMed] [Google Scholar]
- 30.Santos SF, Peixoto AJ. Revisiting the dialysate sodium prescription as a tool for better blood pressure and interdialytic weight gain management in hemodialysis patients. Clin J Am Soc Nephrol. 2008;3:522–530. doi: 10.2215/CJN.03360807. [DOI] [PMC free article] [PubMed] [Google Scholar]
- 31.Thein H, Haloob I, Marshall MR. Associations of a facility level decrease in dialysate sodium concentration with blood pressure and interdialytic weight gain. Nephrol Dial Transplant. 2007;22:2630–2639. doi: 10.1093/ndt/gfm220. [DOI] [PubMed] [Google Scholar]


