

Abstract
We present the design and implementation of VISAGE (VISual AGgregator and Explorer), a query interface for clinical research. We follow a user-centered development approach and incorporate visual, ontological, searchable and explorative features in three interrelated components: Query Builder, Query Manager and Query Explorer. The Query Explorer provides novel on-line data mining capabilities for purposes such as hypothesis generation or cohort identification. The VISAGE query interface has been implemented as a significant component of Physio-MIMI, an NCRR-funded, multi-CTSA-site pilot project. Preliminary evaluation results show that VISAGE is more efficient for query construction than the i2b2 web-client.
1. Introduction
VISAGE is the query interface being developed for Physio-MIMI, an NCRR-funded, multi-CTSA-site project [7] to improve informatics support for researchers conducting clinical studies.
The Physio-MIMI data integration environment has two salient features. First, it is a federated system linking data across institutions without requiring a common data model or uniform data source systems. This would greatly reduce data warehousing activities such ETL, often a significant overhead for data integration. Second, Physio-MIMI is tightly focused on serving the needs of clinical research investigators. VISAGE must therefore provide robust data mining capabilities and must support federated queries, while still being user friendly.
The goal is for VISAGE to be directly used by clinical researchers, for activities such as data exploration seeking to formulate, clarify, and determine the availability of support for potential hypotheses as well as for cohort identification for clinical trials. Such an interface would enable an evolution of the data access paradigm: the current paradigm (left of Fig. 1) is one in which clinical investigators communicate a data request to an Analyst or Database Manager (1) who in turn translates the request into a database query and interrogates the database (2) to obtain requested data, finally returning results (3). The time span between 1 and 3 can be weeks if not months, and steps 1–3 often need to be repeated as the query criteria are refined. VISAGE seeks to change this to a paradigm which empowers clinical investigators with data access and exploration tools directly (right of Fig. 1). In this case clinical investigators (1) and data analysts (2) access data directly, and then perform collaborative data exploration (3).
Figure 1:
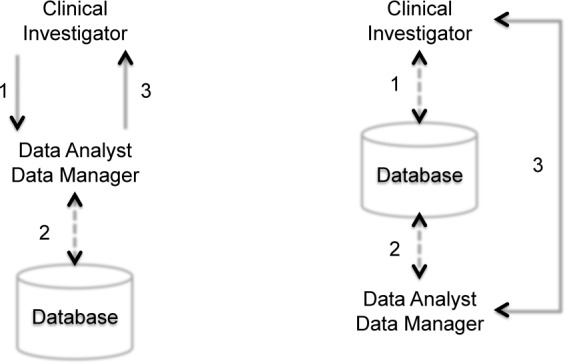
Evolution of the data access paradigm
This paper reports the design, implementation and preliminary evaluation results of VISAGE. We take a user-centered approach, proven essential for successful user interface development for websites [4]. This approach requires the engagement of the end-user in all steps of the developmental process, such as needs analysis, user and task analysis, functional analysis and requirement analysis. To improve usability, VISAGE incorporates visual, ontological, searchable and explorative features in three main components: (1) Query Builder, with ontology-driven terminology support and visual controls such as slider bar and radio button; (2) Query Manager, which stores and labels queries for reuse and sharing; and (3) Query Explorer, for comparative analysis of one or multiple sets of query results for purposes such as screening, case-control comparison and longitudinal studies. Together, these components help efficient query construction, query sharing and reuse, and data exploration, which are important objectives of the Physio-MIMI project.
2. Background
The query interface is increasingly recognized as a bottleneck for the rate of return for investments and innovations in clinical research [1, 3, 5, 8]. Improving query interfaces to clinical databases can only result from an approach that centers around the work requirements and cognitive characteristics of the end user [4], not the structure of the data. To date, few interfaces are usable directly by clinical investigators, with the i2b2 web client [3, 5] a possible exception. Aspects of query interface design that facilitate its use by investigators include query-by-example, tree-based construction, being database structure agnostic, obtaining counts in real time before the query is finished and executed, and saving queries for reuse.
The goal of Phyiso-MIMI is to develop informatics tools to be used directly by researchers to facilitate data access in a federated model for the purposes of hypothesis testing, cohort identification, data mining, and clinical research training. In order to accomplish this goal a new approach to the query interface was necessary.
3. Approach
To make VISAGE usable directly by clinical researchers, we adopt the agile development methodology [2]. A key requirement of this methodology is the close interaction between the developers and the users. In designing VISAGE, we follow user-centered design [4] principles, which involve use cases, user and task analysis and functional analysis, described in the rest of this section. In developing VISAGE, clinical researchers have been integrated in the same Physio-MIMI team, with weekly and monthly meetings focusing on design refinements based on feedback from live demonstration and user testing of working components.
3.1. Needs Analysis and Use Cases
The Physio-MIMI team consists of informaticians and clinical researchers from three CTSA Institutions listed in the author area. The needs of the intended user community were evaluated during a face-to-face meeting of the clinical researchers and the design team, and were refined through monthly telephone meetings between the developer team and the end-user team.
During these meetings the clinical researchers helped identify use cases to highlight the power of VISAGE to query physiological and clinical data from one or more repositories residing at one or more institutions. The first use case involves the identification of a research cohort that meets specific demographic, physiological, and clinical criteria and the subsequent identification of a second similar cohort to serve as control subjects. It is necessary for the user to be able to specify the selection criteria and quickly obtain results of the number of records available in the selected data repository(-ies), to save the query, and then to repeat the query modifying one or more criteria in order to identify a second cohort.
The needs analysis also revealed features of VISAGE that would be desired for it to be useful to clinical researchers. First, it was clear that the users wanted to be able to identify clinical criteria for use in the query based on clinical and logical terminology, not technical or database schema terminology. Similarly, the interface needed to allow for searching for available terms based on a number of synonyms (for example, searching for BMI or Body Mass Index). Second, users wanted to receive immediate feedback on the counts returned by a query rather than having to submit and wait each time criteria are adjusted. This allows the users to see the impact of adding or modifying criteria and more quickly construct the query that meets the current need. Third, the ability to direct a single query to one or more underlying sources of data without explicit knowledge of each of the different database structures. Fourth, the ability to save and reuse queries to avoid having to repeat the process of specifying very detailed criteria in order to change a single aspect of the query.
3.2. User and Task Analysis
The needs analysis made it clear that the overarching use case for VISAGE, of which there are several more specific thematic variations, is a clinical researcher exploring available data with the intent of discovering the nature, scope, and provenance of the data as it may apply to the researcher’s interests and intended uses. Among the variations thus far envisioned are the following: (1) searching for hitherto unnoticed patterns of association and correlation among the available data that suggest or reinforce nascent research hypotheses; (2) deriving and assembling clinical, demographic, behavioral, and assay data sets for use in statistical analyses that can be used in the justification of funding proposals for research studies; and (3) profiling patient populations to determine the availability of cohorts who could be recruited as subjects in proposed research studies.
Such tasks are commonly referred to as data mining, typical down-stream steps that require in-depth analysis, by statisticians or computer scientists, of queried data sets for the discovery of patterns and associations. VISAGE’s Query Explorer interface serves to incorporate those activities that are typically carried out in such down-stream data mining analysis, in order to support discovery-driven query exploration by clinical investigators directly. Understandably, what can be achieved by online analysis based on an extended query interface will neither be as powerful nor as comprehensive as dedicated off-line study which may take weeks or months to complete. VISAGE is not designed to replace the role of data mining; rather, it complements data mining by incorporating steps that may be routinely performed before a more in-depth, off-line analysis.
3.3. Functional Analysis
In order to support hypothesis generation and testing and cohort identification, the key challenge is an interface that greatly accelerates access to relevant data sets: past queries should be quickly recallable; new queries should be easily constructible; existing queries should be readily modifiable.
The sense of exploration would quickly diminish if it takes too much effort or too much time for a set of queries to return meaningful results. To help achieve a speedy response of the system during the highly explorative phase of the user, VISAGE provides the user a choice of three tiered query results: counts only; counts with attribute vectors; attribute vectors with associated files (physiological signal data, genetic data, or other large binary files such as images). Typically, results are limited to counts and aggregate statistics until the user achieved a sense of which direction to pursue further.
The Query Explorer and some of the design features are aimed at reducing the user’s effort in formulating new queries and revising existing ones. The visual slider bars have the added advantage of error reduction for constraint specification.
Ontological Support. Due to the complexity of the clinical and physiological data to be available through Physio-MIMI, a federated model was preferred. Rather than forcing each data source to conform to a standard database schema, Physio-MIMI is based on the mapping of individual databases to a common Sleep Domain Ontology (SDO), also being developed as part of Physio-MIMI. The SDO consists of a set of concepts (terms) in the sleep medicine domain and the relationships between the concepts. The concepts are organized in hierarchical (SubClass, IS-A) relationships, as well as others such as “partOf”, “findingSite”, “associated-Morphology”, etc. The Query Builder, backed by the domain ontology, provides a searchable list of terms as the starting point. And for each term, it provides the user with context-specific navigation to explore its relationships – allowing the user to traverse up or down the parent-child hierarchical relationships as well as along the other axis relevant to the term in order to further refine the query. By employing the SDO, a standard set of terminology can be employed while allowing individual data contributors to maintain data according to their desired schema. The ability of VISAGE to query across disparate databases acros institutions is therefore dependent on this ontological mapping. The Query Builder provides the user interface to formulate the necessary patterns – allowing the construction of a logical query. The logical query is translated into a local database query based on the mapping between the ontology model and the database specific data model.
4. Results
This section focuses on the resulting design and implementation of Query Builder (Fig. 2) and Query Explorer (Fig. 3). The Query Manager saves queries (optionally their results) for reuse, which can be searched by keywords in title, description, or the query itself (e.g. for finding queries about a specific symptom or disorder). We omit the description of Query Manager since the functionalities of this component is similar to that of an email management application.
Figure 2:

Query Builder Interface with specific features labeled 1–12. This shows a sample query specification for subjects in the UH Sleep Data database with ages 18–65, BMI 35–40, and Apnea Hypopnea Index ≥ 30. The sample query run in a fraction of a second and returns 57 records.
Figure 3:

The Query Explorer Interface. The distributions for Gender and Age from the result obtained from the query in Fig. 2 are displayed as a pie chart and histogram, respectively.
4.1. Query Builder
The query builder interface includes functional areas 1–12 (Fig. 2).
The (1) Database Selector lets the user select which database(s) in the system against which to run the query. VISAGE allows informaticians to quickly make data sources available for querying by supplying tools for secure database connectivity and online tools for mapping database elements to SDO concepts. Once mapped, the database can be available to query and will appear to the user in the Database Selector. Using the Query Builder researchers can quickly generate a query across multiple databases or compare results of the same criteria against different databases.
The (2) Search Bar allows the user to search the hierarchy of terms, displaying those that match in the (3) Term Selection Area below. When terms are clicked, they are added to the (4) Term Display Area. As mentioned above, the user can search for any synonyms of concepts in the ontology and be presented with the appropriate ontological concept. The searchable list of terms is backed by the SDO and provides the user the ability to navigate using ontological relations to further refine the query, in a similar manner to i2b2 [3]. To use the VISAGE interface, the clinical researcher needs only to understand the clinical model (domain ontology), and the Query Builder provides the interface for formulating the necessary patterns for the construction of a logical query. The logical query is then translated into a database-specific query based on the mapping between the ontology model and the database schema.
By default, the query’s logic is in Conjunctive Normal Form, which means records need only satisfy one condition in each group to be included in the query result set. To change to Disjunctive Normal Form, the (6) Flip action is made available. The grouping logic is denoted by the color of the box. Elements in a green box are logically connected by AND, while elements in a light blue box are joined by OR. Terms can be selected with the checkboxes and grouped together or separated by clicking (5) Group or Ungroup, allowing for different parenthetical groupings of terms for the conjunctive or disjunctive relationships. Additional term manipulation functionality includes (7) Rearrangement, which lets a user drag and drop the terms to arrange them how he wishes, and (8) Deletion, which allows removal of terms that the user may have mistakenly added to the query. To specify inclusion conditions, each term added to a query comes with term-specific controls.
For categorical data, (9) Checkboxes display the possible values for categorical variables. The values for categorical variables are also derived from the SDO, and map to specific values in the underlying database schema(s). The user need only know the conceptual categories not the underlying structure, and due to the VISAGE database mapping individual databases need not code categorical variables in the same manner. For continuous variables, (10) Sliders allow easy and expressive creation of intervals, with ranges of inclusion specified by light blue shading as well as numeric display. The Sliders have the additional advantage of allowing for the creation of multiple disjoint intervals, something that is often not possible in interfaces that provide manual specification of continuous ranges.
When the user is finished adding terms and modifying inclusion conditions, the number of records that satisfy the conditions is displayed in the (11) Result Count Area. Finally, the user can (12) Describe/Save/Update the query to the Query Manager for future use in the Query Explorer or re-use in the Query Builder.
4.2. Query Explorer
The Query Explorer allows the records returned by one or more queries to be further investigated. Not only can the user view distributions of the terms that were used as criteria in the specification of the query, but any other available term can be selected for exploration within that result set. The Query Explorer provides numeric distributional information including frequency and percent for each level of categorical variables, and mean, standard deviation, and range for continuous variable. The Query Explorer also provides graphical displays of distributions including pie charts and histograms for categorical and continuous variables, respectively.
Discovery-driven query exploration may start with one, two or multiple queries in a query group, arranged in a specific order by the end user, not unlike a work-flow. The queries in a query group are “aligned” to allow the user to zero in on selected attributes to gain a sense of value distribution of the selected attribute among the patients represented in the query results.
By exploring the value distribution of a certain variable within a set of query results, a user may discover how some of the baseline query criteria influence the value distribution of specific attributes (e.g., as pie-chart in Fig. 3), without issuing another query with an additional attribute specified. For example, Fig. 3 illustrates an explorative step for the query used in Fig. 2, where no gender criteria is included. The Query Explorer interface allows one to search and select variables that may or may not be present in the original query. The pie-chart on left shows the gender distribution in the result for the selected query (in Fig. 2). The histogram of age distribution is displayed on the right. One can imagine that by selecting two or more queries, one can explore potential patterns for with a case population and a control population (one query for each), or for Longitudinal Studies (same query with varying time points).
4.3. Preliminary Evaluation
A preliminary evaluation was performed on the efficiency of VISAGE for query construction. Three common queries with increasing levels of logical complexity on patient demographics were selected. Two expert users created the queries in both VISAGE and the i2b2 web client, respectively. The number of clicks and time needed for creating the queries were recorded and tabulated in the next table.
| Query | VISAGE | i2b2 Web Client | ||
|---|---|---|---|---|
| # of clicks | time (sec.) | clicks | time (sec.) | |
| 1 | 5 | 13 | 14 | 59 |
| 2 | 6 | 16 | 25 | 119 |
| 3 | 20 | 52 | 37 | 160 |
As can be seen from the table, VISAGE reduced time and effort (in terms of the number of clicks) to a half or nearly a third. However, we caution that this evaluation is very preliminary and it only looks one specific aspect of the query interface. For example, a larger number of query samples and users with varying computer experiences should be included for a more comprehensive usability evaluation, followed by a rigorous statistical analysis.
5. Discussion
The development of VISAGE has focused on a powerful interface that is intuitive, usable and simple. Agile [2] and user-centered methodologies [4] are used for the query interface development. It entails that a clear separation between design and implementation is neither feasible, nor necessary. Design versions are usually at a conceptual or functional level, and the details are relegated to the prototyping phase, which drives the design revision. This is the reason that the complete interface design of VISAGE is embodied in its implementation in Section 4. Rapid prototyping of VISAGE is achieved through the use of various Open Source Web development tools and frameworks including Ruby on Rails, Prototype, and script.aculo.us JavaScript libraries. All of these are web-based (Web 2.0) and work across platforms.
Acknowledgments
We like to thank other members of the Phyiso-MIMI team for their support, including but not limited to: Susan Redline, Ron Chervin, Justin Staren, Kevin Smith and Ken Loparo. The project described was supported by NIH grants UL1RR024989, UL1RR025011, UL1RR024986 and NCRR-94681DBS78.
References
- [1].Calinescu R, Harris S, Gibbons J, Davies J, Cross-trial query system for cancer clinical trials International Joint Conferences on Computer, Information and Systems Sciences and Engineering. 2006.
- [2].Cockburn A. Agile Software Development. Addison-Wesley; 2001. [Google Scholar]
- [3]. http://services.i2b2.org/webclient/i2b2 Web Client, Accessed October 09, 2009.
- [4].McCracken D, Rosalee W. User-Centered Website Development: A Human-Computer Interaction Approach. Prentice Hall; 2004. [Google Scholar]
- [5].Murphy S, Mendis M, Hackett K, Kuttan R, Pan W, Phillips LC, Gainer V, Berkowicz D, Glaser JP, Kohane I, Chueh HC. Architecture of the open-source clinical research chart from Informatics for Integrating Biology and the Bedside. AMIA Annual Symposium Proceedings. 2007:548–552. [PMC free article] [PubMed] [Google Scholar]
- [6].Wang TD, Plaisant C, Quinn AJ, Stanchak R, Shnei-derman B, Murphy S. Aligning temporal data by sentinel events: Discovering Patterns in Electronic Health Records, CHI Proceedings. 2008. pp. 457–466.
- [7]. Three New Informatics Pilot Projects to Aid Clinical and Translational Scientists Nationwide, http://www.nih.gov/news/health/jan2009/ncrr-26.htm.
- [8].Weber G, Murphy S, McMurry A, MacFadden D, Ni-grin D, Churchill S, Kohane I. The shared health research information network (SHRINE): a prototype federated query tool for clinical data repositories. JAMIA. 2009;16(5):624–630. doi: 10.1197/jamia.M3191. [DOI] [PMC free article] [PubMed] [Google Scholar]