

Abstract
There is great interest in achieving reproducibly high survivals of mammalian oocytes (especially human) after cryopreservation, but the results to date have not matched the interest. A prime cause of cell death is the formation of more than trace amounts of intracellular ice, and one strategy to avoid it is vitrification. In vitrification procedures, cells are loaded with high concentrations of glass-inducing solutes and cooled to −196°C at rates high enough to presumably induce the glassy state. In the last decade, several devices have been developed to achieve very high cooling rates. Nearly all in the field have assumed that the cooling rate is the critical factor. The purpose of our study was to test that assumption by examining the consequences of cooling mouse oocytes in a vitrification solution at four rates ranging from 95°C/min to 69,250°C/min to −196°C and for each cooling rate, subjecting them to five warming rates back above 0°C at rates ranging from 610°C/min to 118,000°C/min. In samples warmed at the highest rate (118,000°C/min), survivals were 70 to 85% regardless of the prior cooling rate. In samples warmed at the lowest rate (610°C/min), survivals were low regardless of the prior cooling rate, but decreased from 25% to 0% as the cooling rate was increased from 95°C/min to 69,000°C/min. Intermediate cooling and warming rates gave intermediate survivals. The especially high sensitivity of survival to warming rate suggests that either the crystallization of intracellular glass during warming or the growth by recrystallization of small intracellular ice crystals formed during cooling are responsible for the lethality of slow warming.
Keywords: Vitrification, recrystallization, intracellular freezing, mouse oocytes, cooling rate, warming rate, cryopreservation
Introduction
There is great interest in achieving reproducibly high survivals of mammalian oocytes (especially human) after cryopreservation, but the results to date have not matched the interest. A prime cause of cell death is the formation of more than trace amounts of intracellular ice, and two contrasting strategies have been pursued to avoid it. They are slow equilibrium freezing and vitrification. Although neither approach has yielded reproducibly high survivals for mouse and human oocytes, there seems a slowly emerging consensus that vitrification procedures are somewhat the better [3,6]. In vitrification procedures, investigators load cells with high concentrations of glass-inducing solutes and cool them to −196°C at high rates. The presumption is that high rates are required to induce the glassy state.
This emphasis on the importance of high cooling rates has been accompanied the last decade by the development of devices to achieve very high cooling rates. Among the most recent is the Cryotop [6]. It is a thin rectangular sheet of plastic affixed to a small handle (Fig. 1). In use, a very small droplet of a suspension of a few oocytes in a vitrification solution is placed on the strip, which is then abruptly immersed in liquid nitrogen. As we shall see, this yields a cooling rate of over 50,000°C/min.
Fig. 1.
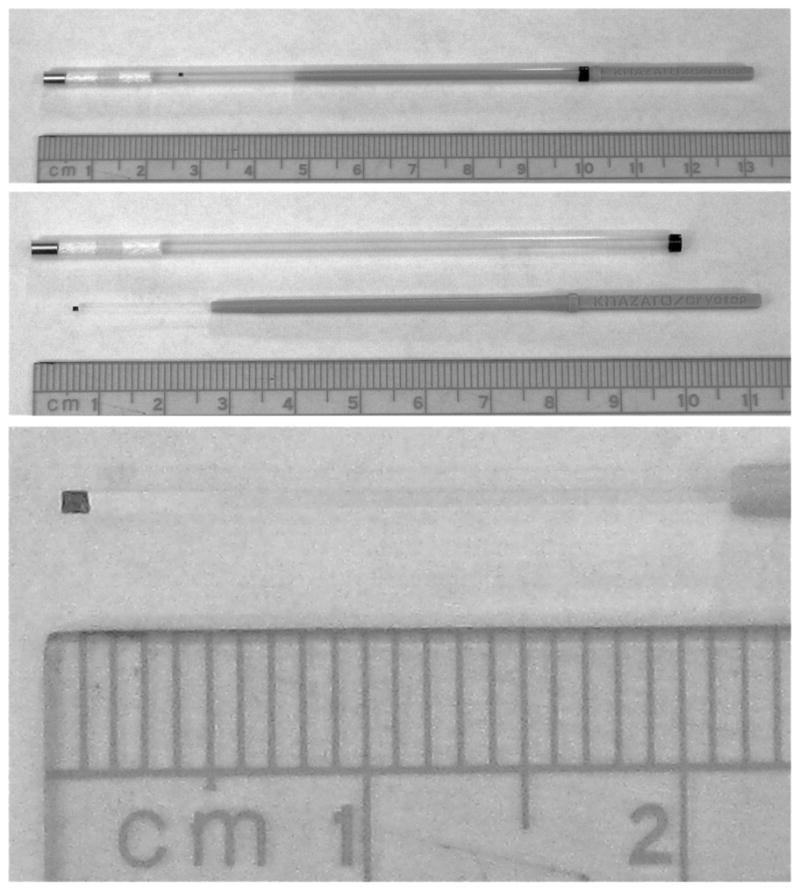
Photographs of a Cryotop. The top photograph shows the Cryotop (spanning from 4.8 to 13.2 cm) inserted into its protective cap (spanning 0 to 10 cm). The photograph just below shows the two items separated. The flat plastic leaf of the Cryotop runs from 0.6 cm to 2.7 cm. The bottom photograph is an enlargement of that leaf.
With some exceptions [1,2], the vitrification literature has almost wholly emphasized the role of cooling rate, but we have shown recently [18,19] that when mouse oocytes are subjected to vitrification procedures in standard ¼ ml insemination straws, the warming rate turns out to be a far more important determinant of cell survival than is the cooling rate. As mentioned, newer devices such as cryo loops [7], open pulled straws [20], and Cryotops [6] are being used with increasing frequency and under the assumption that the salutary results obtained with their use are due to the higher cooling rates that they produce (40× higher than with straws according to our measurements). We wished to test that assumption; hence the research presented in this paper investigated the interactions of cooling rate and warming rate on the survival of mouse oocytes frozen in a vitrification solution on Cryotops to −196°C in LN2. We found that assumption to be incorrect. These devices automatically produce very high warming rates as well as very high cooling rates, and it is the very high warming rates that are responsible for the resulting high survivals–not the high cooling rates.
Methods and materials
Collection of Oocytes
Mature female ICR mice were induced to superovulate with intraperitoneal injections of 5 IU of equine chronic gonadotropin (eCG) and 5 IU of hCG (Sigma, St. Louis) given 48h apart. Ovulated unfertilized oocytes were collected from the ampullar portion of the oviducts at 13 h after hCG injection and were freed from cumulus cells by suspending them in modified phosphate-buffered saline (PB1) containing 0.5 mg/ml hyaluronidase followed by washing with fresh PB1 medium. These procedures were carried out under the University of Tennessee IACUC protocol 911-0607.
Composition of Vitrification Solution
The vitrification solution (EAFS 10/10) was developed by Pedro et al. [14] for cryopreservation of mouse oocytes at metaphase II stage. It consists of 10% (v/v) ethylene glycol (EG) and 10.7% (w/v) acetamide dissolved in a stock consisting of 30% (w/v) Ficoll 70 and 0.5 M sucrose in PB1 medium. The final concentration of sucrose and Ficoll are 0.4 M and 24% (w/v), respectively. Its mass composition was given in a previous report [18]; namely, 3.23 molal EG and 3.27 molal acetamide as the highly permeating cryoprotectants [13], and 0.150 molal salts (as NaCl) and 0.720 molal sucrose as impermeable solutes, plus 20.68 weight % of Ficoll and 0.166 weight % of bovine serum albumin.
Description of the Cryotop
The Cryotop (Kitazato Co., Japan) consists of a flat rectangular leaf of polypropylene measuring 20 X 0.4 X 0.1 mm that is attached to a thin handle some 5 cm long (Fig. 1). For determinations of cooling and warming rates, the junction of a 50-μm copper-constantan thermocouple was fixed to the rectangle with nail-polish with the distal wires attached to the computer-oscilloscope instrumentation recently described by Kleinhans et al. [5]. A 0.1 μl droplet of EAFS 10/10 was placed over the junction. A wide range of cooling and warming rates was obtained be the methods described below. The thermocouple was omitted in the runs involving the determination of survivals after the various treatments.
In these latter runs, 0.1 μl of EAFS containing about 6 oocytes was pipetted on to the Cryotop. Twenty combinations of cooling and warming rate were investigated, generally with 4 to 6 replicate runs for each. The procedures for achieving these various rates were as follows:
Achieving various cooling and warming rates
Various cooling and warming rates were achieved by insulating the Cryotop plastic leaf in various ways and by varying the cooling and warming media and their temperature.
1. Achieving various cooling rates
As shown in Protocol 4 of Table 1, the uninsulated Cryotop with 0.1 μl of EAFS 10/10 cools at a mean of 69,250 ± 4,280°C/min from 20°C to −120°C when immersed directly into LN2. An oscilloscope trace of one cooling run is shown in Fig. 2A. Cooling rates of 3,700, 875, and 95°C/min were obtained as indicated in protocols 3, 2, and 1 in Table 1. In Protocol 3, the rectangular leaf of the Cryotop was covered by the elongated cap that comes with the Cryotop (Fig. 1) and the assembly immersed in LN2.. Protocol 2 was the same except the Cryotop- cap assembly was layed on a Styrofoam boat floating on LN2. Finally, Protocol 1 was the same as 2 except that the Cryotop-cap assembly was placed in a 7 mm OD glass tube.
Table 1.
Protocols for achieving four different cooling rates with Cryotops
| Protocol No. | Insulation around Cryotop | Cooled by | Cooling ratea ± S.E (°C/min) |
|---|---|---|---|
| 1 | Cryotop cap + glass tubeb | LN2 vaporc | 95±4 (N = 5) |
| 2 | Cryotop cap | LN2 vaporc | 876±11 (N = 5) |
| 3 | Cryotop cap | LN2 | 3,700±71 (N = 4) |
| 4 | None | LN2 | 69,250±4,285 (N = 6) |
The cooling rates were determined from 20 to −120 °C by the instruments described by Kleinhans et al. [5]. N is the number of replicate runs.
Cryotop was covered with its cap and 7 mm OD × 90 mm glass tube.
The assembly was placed horizontally on a Styrofoam boat floated on the surface of LN2 in a Dewar flask for about 5 min, and was then immersed in LN2.
Fig. 2.

(A) Representative cooling rate trace for a 0.1 μl drop of EAFS 10/10 on a thermocouple-fitted cryotop abruptly immersed in LN2. (B) The warming rate trace for the same sample immersed abruptly in water at 23°C. The tracings were obtained using the computerized oscilloscope recently described by Kleinhans et al.[5].
2. Achieving various WR
The uninsulated cryotop warms from −170°C to −30°C at a mean of 117,500 ± 10,630°C/min when abruptly transferred from LN2 into a 2 ml 0.5 M sucrose/PB1 “bath” at 23°C (Protocol 5 of Table 2). An oscilloscope recording is shown in Fig. 2B. Warming rates of 24,000°C/min, 7,850°C/min, 4,050°C/min, and 612°C/min were obtained by adding insulation around the Cryotop, by warming either in room-temperature air or in the sucrose bath, and by keeping the temperature of that bath at either 23°C or 0°C. Warming rates were calculated from the time taken for the temperature to rise from about −170°C to about −30°C. The upper limit of −30°C was chosen for two reasons. The first is that the temperature/time curve became very curvilinear above −30°C because of the progressive melting of ice in a concentrated solution. This was especially so when the bath temperature was 0°C. The other is that relevant events like the recrystallization of ice cease above about −35°C [18]
Table 2.
Protocols for warming Cryotops from −196 °C at five different rates
| Protocol No. | Insulation around Cryotop | Warmed by | Warming ratea± S.E. (°C/min) |
|---|---|---|---|
| 1 | Cryotop cap | Air at 23 °C | 612±40 (N = 5) |
| 2 | Cryotop cap | Water at 23 °C | 4,050±328 (N = 4) |
| 3 | None | Air at 23 °C | 7,850±415 (N = 5) |
| 4 | None | Sucrose solutionb at 0 °C | 24,000±5,843 (N = 5) |
| 5 | None | Sucrose solutionb 23 °C | 117,500±10,632 (N =6) |
The warming rates were determined from ~ −170 to −30 °C by the instruments described by Kleinhans et al. [5]. N is the number of replicate runs.
2 ml of 0.5 M sucrose in PB1.
Some combinations of cooling and warming rates required changing the insulation surrounding the Cryotop while it was immersed in LN2 or in LN2 vapor. For example, to cool a Cryotop at about 70,000°C/min (Protocol 4 of Table 1) and warm it at 4,050°C/min (Protocol 2 of Table 2) the naked Cryotop had to be immersed in LN2, and then under LN2 capped with the provided sheath. Finally, the combination was removed from the liquid nitrogen and abruptly immersed in 2 ml of a 0.5 M sucrose/PB1 solution at 23°C. Sucrose is an impermeant solute, the purpose of which is to provide osmotic buffering when the oocytes are diluted out of the concentrated EAFS 10/10.
Post-warming procedures and the determination of survival
The warmed oocytes were collected from the 2 ml of 0.5 M sucrose/PB1 and were then pipetted into fresh 0.5 M sucrose/PB1 solution Approximately 10 min later, they were transferred to fresh PB1 medium lacking sucrose, and then transferred to and cultured in modified M16 medium [14] for 2 hrs. (For simplicity, this will henceforth be referred to as M16).
Viability was assessed at three time points based on osmotic responsiveness and morphological normality. First, the oocytes were examined during the 10 min in sucrose/PB1. Membrane-intact oocytes were expected to shrink with time because the sucrose is hypertonic. Second and third, they were examined after being placed in M16 and after two hours incubation. They fall into two binary groups: Degenerate oocytes are clearly non-viable. The others are indistinguishable from fresh oocytes, and we know from past experiments that the plasma membranes in this latter group are intact and function normally with respect to their osmotic response to hypertonic and hypotonic media, and with respect to their ability to remain supercooled in the presence of external ice. The ability to manifest these characteristics after two hours in M16 is considered a rather stringent test of viability. Still other criteria of normality are given in [12, pp. 48–49]. They mostly deal with measures of the integrity of the plasma membrane.
Statistics
Error figures in tables and error bars in graphs are standard errors (standard deviations of the mean). Tests of significance were carried out by 1-way ANOVA using Graphpad Software’s Instat, V. 3.02 followed by the Tukey-Kramer Multiple Comparison Test.
Results
Table 3 is a matrix of survivals for oocytes that were cooled in EAFS 10/10 at four different rates from 95°C/min to 69,000°C/min, and for each cooling rate, warmed at one of five rates from 600°C/min to 117,500°C/min. The columns list survivals for various warming rates with a constant cooling rate. The rows list survivals for various cooling rates and constant warming rate.
Table 3.
Survival of mouse oocytes in EAFS10/10 on Cryotops after cooling to −196 °C at each of four rates and warming at each of five rates
| Warming rate (°C/min) | Cooling rate (°C/min) |
|||
|---|---|---|---|---|
| 95 | 880 | 3700 | 69250 | |
| 610 | 25.0 ± 12.6A,a (11/39, N = 8) | 12.5 ± 6.0 A,a (4/34, N = 6) | 8.9 ± 4.0 A,a (3/33, N = 6) | 0.0 ± 0.0 A,a (0/23, N = 4) |
| 4,050 | 69.4 ± 6.7 A,b (19/29, N = 6) | 75.0 ± 5.7 A,b (24/33, N = 6) | 32.9 ±11.4 B,ab (15/46, N = 8) | 31.5 ± 7.6 B,a (17/54, N = 9) |
| 7,850 | 72.2 ± 8.2 A,b (26/36, N = 6) | 48.0 ± 10.3 AB,ab (25/52, N = 10) | 33.3 ± 8.9 B,ab (16/46, N = 8) | 15.4 ± 6.3 B,a (7/47, N = 8) |
| 24,000 | 43.8 ± 12.6 A,ab (21/48, N = 8) | 48.8 ± 12.7 A,ab (23/47, N = 8) | 37.5 ± 12.1 A,ab (18/48, N = 8) | 30.6 ± 8.0 A,a (11/36, N = 6) |
| 117,500 | 85.6 ± 5.2 A,b (30/35, N = 6) | 77.2 ± 9.2 A,b (27/35, N = 6) | 69.4 ± 2.8 A,b (25/36, N = 6) | 78.6 ± 8.7 A,b (33/42, N = 7) |
The data are % survival ± SEM. The first values in the parentheses are the ratios of the number of surviving oocytes to the number frozen or vitrified. N is the number of replicates.
Values with different superscripts were significantly different (P < 0.05) by one-way ANOVA. Capital letters shows the differences of survivals with the same warming rate and various cooling rate, and small letters shows those with various warming rates and the same cooling rate.
One quickly sees that all the survivals in the bottom row (which represents the fastest warming) were high (70 to 86%) irrespective of the cooling rate. Conversely, all the survivals in the top row (which depicts the slowest warming) are low (0 to 25%). The survivals in the middle three rows are intermediate.
Superimposed on this primary effect, however, is an effect of cooling rate in the top four rows; namely, the faster the cells are cooled, the lower is the survival for a given warming rate. For example, in the third row, survivals decreased from 72% for oocytes cooled at 95°C/min to 15% for oocytes cooled at 69,000°C/min when they were warmed at 7,850°c/min. Another way to express this, as can be seen moving down the columns, is that, with a few exceptions, the faster the oocytes are cooled, the faster they have to be warmed to show high survivals.
Figures 3 and 4 express the relationships graphically. Figure 3 is a plot of survival vs. cooling rate for the five warming rates. The top curve represents the results with warming at the highest rate (117,500°C/min). The survivals are near 80%; there is almost no effect of cooling rate. The bottom curve represents the results with warming at the lowest rate (610°C/min). The survivals are 25% or less with all four cooling rates and decrease from 25% to 0% with increased cooling rate.
Fig. 3.

Plot of the survival of mouse MII oocytes suspended in EAFS 10/10 vitrification solution as a function of the cooling rate when followed by five different warming rates.
Fig. 4.

Plot of the survival of mouse MII oocytes suspended in EAFS 10/10 vitrification solution as a function of the warming rate after being cooled to −196°C at each of four different cooling rates.
Figure 4 is a plot of survival vs. warming rate for the four cooling rates. There is a clustering of four high survivals at the upper right. These represent the results with the highest warming rate. There is also a somewhat looser clustering of four low survivals at the lower left. This represents the results for the slowest warming. In both these clusters, especially the high survival cluster at the upper right, there is little effect of cooling rate.
With the exception of three values, there is a general trend for survivals to rise with increasing warming rate. The three exceptions occur at warming rates of 4,000 and 7,850°C/min for oocytes cooled at the two lowest rates (880 and 95°C/min). These three survivals are substantially higher than the general trend lines. Alternatively, one could argue that three data points are abnormally low, two shown by the squares at warming rates of 7,850 and 24,000°C/min, and one point shown by the triangle at a warming rate of 24,000°C/min. We doubt that these anomlies are random statistical artifacts because 20 to 48 oocytes contributed to each data point. However, we currently have no explanation for them.
Discussion
A new way of thinking about vitrification
In recent years, there has been increasing attention paid to the cryopreservation of cells and tissues by vitrification as opposed to classical slow freezing. This has been especially true of cell and tissue types that have fared poorly with the latter, One cell type in this category is the mammalian M II oocyte and especially the human oocyte. Theory and experiments by investigators such as Fahy [2] and Boutron and Mehl [1] have shown that there is a strong reciprocal interaction between the cooling rate required to achieve vitrification of solutions and the concentration of solutes in those solutions. The total concentrations required are usually between 6 and 8 molal. These are so near the tolerable limits for cells, that it might be highly beneficial if the use of higher cooling rates were able to lower the required concentrations by even a small amount. Consequently, over the last decade investigators have developed a series of devices that permit cooling at 10 to 20 times the rates achievable with ¼ ml insemination straws immersed in LN2. The devices achieve these results primarily because they have a low thermal mass and because they use very small volumes of cell suspensions. They include the open-pulled straw, electron microscope grids, the cryo loop, and more recently the Cryotop.
This picture changed in 2008 and 2009 when Seki and Mazur [18,19] published comparisons of the effects of warming rates on the survival of mouse MII oocytes “vitrified” in EAFS 10/10 solution in ¼ ml straws vs. the effect of cooling rate. They reported that survival is determined primarily by the warming rate. Cooling rate has little effect, and high survivals occur even when samples are cooled as slowly as 40°C/min provided that they are warmed as rapidly as possible (3,000°C/min in straws).
Comparisons between the results for Cryotops and those for straws
The results previously obtained with ¼ ml straws are compared in Figures 5 and 6 with those reported here for Cryotops. In making this comparison, note three things: (1) The scales of the ordinates and abscissas are the same in both the upper (A) and lower (B) plots. (2) The abscissas in both are logarithmic. In [18,19] they are arithmetic. But (3), the values of the cooling and warming rates in the top plots are very different from those in the lower plots. For example, in Fig. 5, the highest warming rate obtained in straws (2,950°C/min) (5A) is lower than the next to lowest warming rate obtained with Cryotops (4,050°C/min) (5B). To help visualize the similarities and differences between straws (A) and Cryotops (B), we have drawn two vertical dotted lines to emphasize the region where the cooling rates overlap in Figs. 5A,B and where the warming rates overlap in Fig. 6A,B. But note that each curve in the “A” figures represents a very different warming rate from that in the “B” figures in Fig. 5 and a very different cooling rate in Fig. 6.
Fig. 5.

Plot of the survival of mouse MII oocytes suspended in EAFS 10/10 vitrification solution as a function of the cooling rate when followed by five different warming rates. In (A), the oocytes were cooled and warmed in ¼ ml insemination straws surrounded by various forms of insulation. The data are from Seki and Mazur [19] except that the cooling rates are plotted on a log scale. In (B), the oocytes were cooled and warmed on Cryotops insulated in various ways. The data are from Fig. 3. The two dotted vertical lines demarcate the region where the cooling rates overlap in A and B.
Fig. 6.

Like Fig. 5 except that survival is plotted as a function of warming rate for oocytes subjected to four different cooling rates in (A) straws and (B) Cryotops. The two dotted vertical lines demarcate the region where the warming rates overlap in A and B
Similarities
The overall response of the oocytes to cooling and warming rate on Cryotops is quite similar to that in ¼ ml straws:
When warmed at the highest rate attainable, survivals are high regardless of the cooling rate
When warmed at the lowest rate used, survivals are low regardless of the cooling rate.
For each warming rate, survivals were maximal or nearly so with a cooling rate of 95 to 187°C. Survivals decreased with higher cooling rates.
The faster one cools, the faster one must warm to achieve high survivals.
Differences
However, there are some substantial differences between the A and B sets of curves. One difference is that in the straws, survival drops to zero or near zero when straws were cooled at 37°C/min and warmed at rates lower than the maximum of 2,950°C/min. That drop in survival was not seen with Cryotops, probably because a low cooling rate such as 37°C/min was not attainable with them. A second difference is that some of the survival peaks and valleys occur at different absolute cooling and warming rates in straws than in Cryotops. For example, a tight grouping of the high survivals occurs with a warming rate of 2,950°C/min in straws (Fig. 6A) but at a warming rate of 117,500°C/min with Cryotops (Fig. 6B). But on the other hand, with the Cryotops a secondary cluster of high survivals also appears with a warming rate of 4,050°C/min (Fig. 6B), essentially the same as with straws (Fig. 6A). We can not currently explain some of the differences, but we do feel that we have supportable hypotheses for the major similarities.
Comments on survival
We have defined a surviving cell as one that has remained morphologically indistinguishable from an untreated control and has maintained an intact membrane as evidenced by normal osmotic response and the ability to supercool after experimental treatment and a subsequent 2–4 hours incubation in M16 medium. We realize that satisfying this definition by no means ensures that the oocyte is functionally viable in the sense of being fertilizable and being able to develop to expanded blastocyst (although in most published reports, high morphological/osmotic survival of oocytes and embryos does usually in fact equate with high functional survival [4,7]). Although we can not now confirm that high survivals based on our criteria of membrane intactness and morphological normality equate with high functional survival, we believe we can say with assurance that low survivals based on our criteria will equate with low functional survival. Our strategy will be to initiate tests of the functional survivals of those conditions in the matrix of Table 3 that resulted in high survivals based on our current criteria. In unpublished preliminary data, M. Kasai has found that 84% of ICR oocytes vitrified in EAFS 10/10 undergo fertilization if the zona is removed, a finding that we have confirmed; however, few undergo subsequent in vitro development using standard procedures.
Interpretation of the fact that rapid warming is essential for achieving high survivals
Theory and cryomicroscopy have shown that when mouse oocytes and embryos are cooled at 20° to 30°C/min to below −40°C, nearly 100% undergo lethal intracellular ice formation (IIF) [8,9,16]. IIF also forms in cells cooled at ~100°C/min, but in that case, we argue, it is not immediately lethal. We believe that the difference is a matter of crystal size. It is well known that slow cooling produces larger intracellular crystals than does rapid cooling [21]. We suggest that large internal ice crystals are formed with a cooling rate of 20° to 30°C/min and are immediately lethal. But when the oocytes are cooled at 100°C/min or faster, the internal crystals are small and are not immediately lethal. Whether they become lethal or not depends on the subsequent rate of warming. If they are warmed slowly, they grow by recrystallization to a lethal size. However, if they are warmed very rapidly, there is insufficient time for recrystallization to occur and the oocytes or embryos survive. Ice recrystallization is the conversion of a population of small crystals into a smaller number of large one. It occurs because the surface free energy of small crystals is higher than that of large crystals. Seki and Mazur [17,18] have observed and quantified the rates of intracellular recrystallization in mouse oocytes in 1, 1.5, and 2 M ethylene glycol. Unfortunately, it cannot be observed in oocytes in EAFS 10/10 because the very high opacity of the solution obscures the oocytes in the cryomicroscope.
Interpretation of the finding that when the oocytes are warmed at the highest rates, survivals are high with all cooling rates from 187°C/min to 117,500°C/min
Our interpretation is that the IIF that forms in all these cases is innocuous, and it remains innocuous when warming is very rapid because there is insufficient time for recrystallization to occur.
There is an important practical consequence of not having to cool at very high rates. One substantial concern of using high cooling rate devices like Cryotops, cryo loops, and open pulled straws in which oocytes/embryos come in direct contact with liquid nitrogen is that they may become contaminated by non- animate but viable bacteria or fungi in the LN2. The fact that survivals approach 80% even when oocytes are cooled on Cryotops as slowly as 100°C essentially eliminates this concern, for in the procedure to attain that rate (Protocol 1, Table 1), the Cryotops and oocytes do not come in contact with LN2 during cooling. They still can be warmed at the highest rates simply by removing the Cryotop and cap from the 7 mm glass tube, and then removing the cap–all in LN2 vapor– followed by immersion of the naked Cryotop in the sterile sucrose warming solution at room temperature.
Interpretation of fact that the faster you cool at rates above about 100°c/min, the faster you have to warm to obtain high survivals
We believe the explanation here is also a matter of crystal size. The faster one cools, the smaller the size of the internal crystals [21], and the smaller the crystals, the greater is the driving force for them to increase in size from recrystallization during warming. To compensate for the greater driving force, one needs to warm more rapidly to block recrystallization. If this explanation is correct, it means that striving for higher and higher cooling rates may in fact be counterproductive because the higher cooling rates will require the use of higher and higher warming rates to avoid killing from recrystallization.
If our overall interpretation is substantially correct, it represents a paradigm shift in cryopreservation by vitrification. In this altered view, whether or not cells vitrify during cooling becomes relatively unimportant. What is important is that whatever ice crystals form during cooling be small, and that the subsequent warming be rapid enough to prevent recrystallization. It may have to be very rapid.
Older data pointing to a similar conclusion
There have been older reports going back 50 years showing that when cells are cooled at rates high enough to induce IIF, the warming rate is a far more important factor in obtaining high survival than is the cooling rate. One report is that of Rall [15] dealing with 8-cell mouse embryos. Another by Mazur et al. [10] showed that when Drosophila embryos in a vitrification medium are cooled to −196°C at very high rates, the percentage that undergo significant development after “thawing” increases from 0% to 55% as the warming rate is increased from 200°C/min to 100,000°C/min. Twenty-five years earlier, Mazur and Schmidt [11] obtained similar results with the yeast Saccaromyces cerevisiae. When the yeast were cooled at 1,370°C/min, survival rose 20,000-fold as the warming rate was increased from 1 to 1,160°C/min. When they were warmed 48,200°C/min, survivals were relatively high and were unaffected by cooling rates ranging from 8°C/min to 1,430°C/min. Until now, these scattered reports have generally been ignored. But when they are considered in association with the data reported in [18] and [19] and that reported here, we believe they ought no longer be ignored. Of course, we still do not know how widely applicable they are to other cell types and taxonomic groups.
Conclusions
As reported in our preceding paper using insemination straws [19], survival using Cryotops depends much more on the warming rate from −196°C than on the prior cooling rate. When oocytes are warmed at the highest rate (117,000°C/min), survivals are 70% to 85% regardless of the cooling rate (95 to 69,000 °C/min.) When oocytes are warmed at the lowest rate (600°C/min), survivals range from 25% to 0%
Except in the case of the highest warming rate, the faster the cooling, the lower the survival for a given warming rate. Or put differently, the higher the cooling rate, the higher was the warming rate required to achieve high survivals.
The survival patterns are similar to those obtained using straws but there are differences.
The overall conclusion is similar with both Cryotops and straws; namely, slow warming is damaging because it allows time for small intracellular ice crystals formed during cooling to grow to damaging size during warming. We propose that this increase in ice crystal size is a consequence of recrystallization, the conversion of many small ice crystals into fewer larger crystals. It is possible, however, that the cell water vitrifies during cooling, and then devitrifes to form small intracellular crystals above the glass transition (Tg ), which then proceed to grow to damaging size by recrystallization with further rise in temperature.
Acknowledgments
We thank F. W. Kleinhans for the development in our laboratory of a high-speed temperature measurement system [5] which was central to our being able to quantify the cooling and warming rates we were obtaining.
Footnotes
Statement of funding: Supported by National Instiututes of Health Grant R01-RR18470
Publisher's Disclaimer: This is a PDF file of an unedited manuscript that has been accepted for publication. As a service to our customers we are providing this early version of the manuscript. The manuscript will undergo copyediting, typesetting, and review of the resulting proof before it is published in its final citable form. Please note that during the production process errors may be discovered which could affect the content, and all legal disclaimers that apply to the journal pertain.
References
- 1.Boutron P, Mehl P. Theoretical prediction of devitrification tendency: Determination of critical warming rates without using finite expansions. Cryobiology. 1990;27:359–377. doi: 10.1016/0011-2240(90)90015-v. [DOI] [PubMed] [Google Scholar]
- 2.Fahy GM. Biological effects of vitrification and devitrification. In: Pegg DE, Karow AM Jr, editors. The Biophysics of Organ Cryopreservation. Plenum Press; New York: 1987. pp. 265–297. [Google Scholar]
- 3.Gardner DK, Sheehan CB, Rienzi L, Katz-Jaffe M, Larman MG. Analysis of oocytes physiology to improve cryopreservation procedures. Theriogenology. 2007;67:64–72. doi: 10.1016/j.theriogenology.2006.09.012. [DOI] [PubMed] [Google Scholar]
- 4.Jin B, Mochida K, Ogura A, Hotta E, Kobayashi Y, Ito K, Egawa G, Seki S, Honda H, Edashige K, Kasai M. Equilibrium vitrification of mouse embryos. Biol Reprod. 2010;83:444–450. doi: 10.1095/biolreprod.109.077685. [DOI] [PubMed] [Google Scholar]
- 5.Kleinhans FW, Seki S, Mazur P. Simple. inexpensive attainment and measurement of very high cooling and warming rates. Cryobiology. 2010;61:231–233. doi: 10.1016/j.cryobiol.2010.06.011. [DOI] [PMC free article] [PubMed] [Google Scholar]
- 6.Kuwayama M, Vajta G, Kato O, Leibo SP. Highly efficient vitrification method for cryopreservation of human oocytes. Reproductive Biomedicine Online. 2005;11:300–308. doi: 10.1016/s1472-6483(10)60837-1. [DOI] [PubMed] [Google Scholar]
- 7.Lane M, Gardner DK. Vitrification of mouse oocytes using a nylon loop. Mol Reprod Develop. 2001;58:342–347. doi: 10.1002/1098-2795(200103)58:3<342::AID-MRD13>3.0.CO;2-X. [DOI] [PubMed] [Google Scholar]
- 8.Leibo SP, McGrath JJ, Cravalho EG. Microscopic observations of intracellular ice formation in unfertilized mouse ova as a function of cooling rate. Cryobiology. 1978;15:257–271. doi: 10.1016/0011-2240(78)90036-6. [DOI] [PubMed] [Google Scholar]
- 9.Mazur P. Freezing of living cells: mechanisms and implications. Amer J Physiol. 247 doi: 10.1152/ajpcell.1984.247.3.C125. [DOI] [PubMed] [Google Scholar]; Cell Physiol. 1984;16:C125–142. [Google Scholar]
- 10.Mazur P, Cole KW, Schreuders PD, Mahowald AP. Contributions of cooling and warming rate and developmental stage to the survival of Drosophila embryos cooled to − 205°C. Cryobiology. 1993;30:45–73. doi: 10.1006/cryo.1993.1006. [DOI] [PubMed] [Google Scholar]
- 11.Mazur P, Schmidt JJ. Interactions of cooling velocity, temperature, and warming velocity on the survival of frozen and thawed yeast. Cryobiology. 1968;5:1–17. doi: 10.1016/s0011-2240(68)80138-5. [DOI] [PubMed] [Google Scholar]
- 12.Mazur P, Seki S, Pinn IL, Kleinhans FW, Edashige K. Extra- and intracellular ice formation in mouse oocytes. Cryobiology. 2005;51:29–53. doi: 10.1016/j.cryobiol.2005.04.008. [DOI] [PubMed] [Google Scholar]
- 13.Pedro PB, Yokoyama E, Zhu SE, Yoshida N, DMV, Tanaka M, Edashige K, Kasai M. Permeability of mouse oocytes and embryos at various developmental stages to five cryoprotectants. J Reprod Develop. 2005;51:235–246. doi: 10.1262/jrd.16079. [DOI] [PubMed] [Google Scholar]
- 14.Pedro PB, Zhu SE, Makino N, Sakurai T, Edashige K, Kasai M. Effect of hypotonic stress on the survival of mouse oocytes and embryos at various stages. Cryobiology. 1997;35:150–158. doi: 10.1006/cryo.1997.2034. [DOI] [PubMed] [Google Scholar]
- 15.Rall WF. Factors affecting survival of mouse embryos cryopreserved by vitrification. Cryobiology. 1987;24:387–402. doi: 10.1016/0011-2240(87)90042-3. [DOI] [PubMed] [Google Scholar]
- 16.Rall WF, Mazur P, McGrath JJ. Depression of the ice-nucleation temperature of rapidly cooled mouse embryos by glycerol and dimethyl sulfoxide. Biophysical J. 1983;41:1–12. doi: 10.1016/S0006-3495(83)84399-9. [DOI] [PMC free article] [PubMed] [Google Scholar]
- 17.Seki S, Mazur P. Kinetics and activation energy of recrystallization of intracellular ice in mouse oocytes subjected to interrupted rapid cooling. Cryobiology. 2008;56:171–180. doi: 10.1016/j.cryobiol.2008.02.001. [DOI] [PMC free article] [PubMed] [Google Scholar]
- 18.Seki S, Mazur P. Effect of warming rate on the survival of vitrified mouse oocytes and on the recrystallization of intracellular ice. Biology of Reproduction. 2008;79:727–737. doi: 10.1095/biolreprod.108.069401. [DOI] [PMC free article] [PubMed] [Google Scholar]
- 19.Seki S, Mazur P. The dominance of warming rate over cooling rate in the survival of mouse oocytes subjected to a vitrification procedure. Cryobiology. 2009;59:79–82. doi: 10.1016/j.cryobiol.2009.04.012. [DOI] [PMC free article] [PubMed] [Google Scholar]
- 20.Vajta G, Booth PJ, Holm P, Greve T, Callesen H. Successful vitrification of early stage bovine in vitro produced embryos with the open pulled straw (OPS) method. Cryo- Letters. 1997;18:191–195. [Google Scholar]
- 21.Van Venrooij GEPP, Aersten AMHJ, Hax WMA, Ververgaert PHJT, Vorst HAVD. Freeze-etching: freezing velocity and crystal size at different locations in samples. Cryobiology. 1975;12:46–61. doi: 10.1016/0011-2240(75)90040-1. [DOI] [PubMed] [Google Scholar]