

Abstract
The mobilities of a set of common α-amino acids, four tetraalkylammonium ions, 2,4-dimethyl pyridine (2,4-lutidine), 2,6-di-tert-butyl pyridine (DTBP), and valinol were determined using electrospray ionization-ion mobility spectrometry-quadrupole mass spectrometry (ESI-IMS-QMS) while introducing 2-butanol into the buffer gas. The mobilities of the test compounds decreased by varying extents with 2-butanol concentration in the mobility spectrometer. When the concentration of 2-butanol increased from 0.0 to 6.8 mmol m−3 (2.5×10² ppmv), percentage reductions in mobilities were: 13.6% (serine), 12.2% (threonine), 10.4% (methionine), 10.3% (tyrosine), 9.8% (valinol), 9.2% (phenylalanine), 7.8% (tryptophan), 5.6% (2,4-lutidine), 2.2% (DTBP), 1.0% (tetramethylammonium ion, TMA, and tetraethylammonium ion, TEA), 0.0% (tetrapropylammonium ion, TPA), and 0.3% (tetrabutylammonium ion, TBA). These variations in mobility depended on the size and steric hindrance on the charge of the ions, and were due to formation of large ion-2-butanol clusters. This selective variation in mobilities was applied to the resolution of a mixture of compounds with similar reduced mobilities such as serine and valinol, which overlapped in N2-only buffer gas in the IMS spectrum. The relative insensitivity of tetraalkylammonium ions and DTBP to the introduction of 2-butanol into the buffer gas was explained by steric hindrance of the four alkyl substituents in tetraalkylammonium ions and the two tert-butyl groups in DTBP, which shielded the positive charge of the ion from the attachment of 2-butanol molecules. Low buffer gas temperatures (100 °C) produced the largest reductions in mobilities by increasing ion-2-butanol interactions and formation of clusters; high temperatures (250 °C) prevented the formation of clusters, and no reduction in ion mobility was obtained with the introduction of 2-butanol into the buffer gas. Low temperatures and high concentrations of 2-butanol produced a series of ion clusters with one to three 2-butanol molecules in compounds without steric hindrance. Clusters of two and three molecules of 2-butanol were also visible. Ligand-saturation on the positive ions with 2-butanol molecules occurred at high concentrations of modifier (6.8 mmol m−3 at 150°C); when saturated, no further reduction in mobility occurred when 2-butanol was introduced into the buffer gas.
Keywords: Ion mobility spectrometry, gas modifier, 2-butanol, clustering, dopant
1. INTRODUCTION
Adding trace quantities of vapors to ion mobility spectrometers to produce specific analytical effects was first utilized by Kim et al. (1978) who added ammonia to the N2 carrier gas to selectively ionize a series of amines [1]. Later, Blyth (1983) used acetone for the selective detection of chemical warfare agents [2] and Spangler et al. (1985) introduced the use of carbon tetrachloride for the selective detection of explosives [3]. In a comparative study of halogen containing dopants, Proctor and Todd found dichloromethane to be superior to dibromomethane, methyl iodide, acetic acid, dimethyl sulfide, and acetonitrile [4] for the detection of explosives. Eiceman et al. (1995) selectively detected mixtures of volatile organic and organophosphorus compounds using acetone and dimethylsulfoxide reagent gases [5] and Meng et al. (1995) used water, acetone, and dimethylsulfoxide reagent gases to provide specific ionization of indoor ambient atmospheres for volatile organic compounds [6].
Eiceman et al. (1993) used acetone and 5-nonanone to monitor hydrazine (HZ) and monomethylhydrazine (MMH) in air, avoiding the interference of ammonia [7]. They produced (C9H18O)H+ reactant ions, which reacted with HZ and MMH to form HZ:(C9H18O)nH+ and MMH:(C9H18O)nH+ complexes; these complexes had different drift times from the original HZ and MMH ions, and the interference of ammonia was avoided. In a similar study, Gan and Corino (2000) introduced 4-heptanone reagent gas in the carrier gas to detect alkanolamines in the presence of ammonia, Freon 22, and diesel fuel vapors [8]. Puton et al. (2008) reviewed the use of reagent gases and modifiers in IMS in negative and positive modes (66 references) [9].
In most cases, when trace quantities of dopant vapors are added to IMS instruments, the purpose is to reduce ionization interferences and selectively ionize the target analytes of interest. When doping agents are introduced directly into the drift region of the mobility spectrometer rather than the ionization region, they modify mobilities through dynamic ion-molecule interactions as they drift through the buffer gas. In work similar to Eiceman et al. (1993), Bollan et al. (2007) complexed hydrazines by introducing ketones into the buffer gas of an ion mobility spectrometer to avoid the interference of ammonia on the determination of hydrazines [10]. Dwivedi et al. (2006) demonstrated the separation of enantiomers of sugars, drugs, and amino acids by introducing 10 ppm of (S)-2-butanol modifier into the buffer gas. As the concentration of this modifier was increased, drift times of both enantiomers increased up to 5 ms. Interestingly, shifts in drift times were different for different compounds [11]. It is these differential shifts in drift times for various analytes as a result of the addition of a buffer gas modifier, which is the subject of this investigation. In this study, 2-butanol was introduced into the buffer gas of an ion mobility spectrometer to investigate the analytical potential of modifying the buffer gas for separation selectivity.
2. EXPERIMENTAL SECTION
2.1. Instrumentation
Experiments were performed using an electrospray-ionization atmospheric-pressure ion mobility spectrometer interfaced through a 40-μm pinhole to a quadrupole mass spectrometer (ESI-IMS-QMS) (Figure 1). The operating conditions routinely used for this instrument were: ESI flow, 3 μl min−1; reaction region length, 7.5 cm; drift tube length, 25.0 cm; ESI voltage, 15.6 kV; voltage at first ring, 12.1 kV; voltage at the gate, 10.80 ± 0.01 kV; gate closure potential, ±40 V; gate pulse width, 0.1 ms; scan time, 35 ms; pressure, 680-710 Torr; buffer gas, nitrogen; buffer gas temperature, 150 ± 2 °C; buffer gas flow, 1 liter min−1; 2-butanol flow rate (liquid), 0.17 to 0.75 μl min−1(Table 1).
Figure 1.

Photograph (a) and sketch (b) of the electrospray ionization-atmospheric pressure ion mobility-mass spectrometer.
Table 1.
ESI-APIMS Operating Conditions Summary
| Parameter | Settings |
|---|---|
| Reaction region length | 7.5 cm |
| Drift tube length | 25.0 cm |
| ESI voltage | 15.6 kV |
| Voltage at first ring | 12.1 kV |
| ESI flow | 3 μl min−1 |
| Voltage at the gate | 10.80 kV |
| Gate closure potential | ±40 V |
| Gate pulse width | 200 μs |
| Scan time | 35 ms |
| Buffer gas | Nitrogen |
| Buffer gas temperature | 150 ± 1 °C |
| Buffer gas flow | 900 ml min−1 |
| 2-butanol flow rate | 0.17 to 0.75 μl min−1 |
2.2. IMS instrument
The IMS instrument was built at Washington State University, and its full description and schematics can be found elsewhere [11,12]. A brief description of the instrument follows. The ESI-APIMS instrument was equipped with an electrospray ionization source and a drift tube. The tube had two parts: a desolvation and a drift region operating in positive mode, and separated by a Bradbury-Nielsen-type ion gate. Both regions had alternating 2.2”-OD, 2.0”-ID alumina insulating spacers (99.6% Al2O3, Advalue Tech., Tucson, AZ) and conducting stainless steel rings. A counterbore into each drift ring external face supplied a pocket for the neighboring ceramic insulator. Insulating spacers and steel rings were stacked in a horizontally interlocking design. All rings were kept together in a 2.5”-OD, 2.3”-ID alumina tube housed in an aluminum heating block. Steel rings were connected in series by 1 MΩ (drift region) or 0.5 MΩ (desolvation region) high-temperature resistors (Caddock Electronics Inc., ±1%). When a high electrical potential was applied to the first ring, a 200-500 V cm−1 electric field was created throughout the drift tube [13]. To help desolvate ions, a countercurrent of preheated N2buffer gas was introduced at the end of the drift tube at a flow rate of 0.93 L min−1 through a stainless-steel tube. To heat the buffer gas, it was passed through a 2 meter stainless-steel tube coiled inside a heated aluminum block (Figure 1). The mobility spectrometer was operated at ambient pressure (690-710 Torr in Pullman, WA). Custom LabView software (National Instruments, Austin, TX) collected the IMS data and controlled the ion gate. The electronic controls for IMS gating and data acquisition were built at Washington State University (WSU) [14].
2.3 Ion gate
The ion gate was made of eighty 75-μm parallel Alloy 46 wires (California Fine Wire Co., Grove Beach, CA) separated 0.6 mm. When the gate was open, all wires had a voltage with a value equal to the average of the adjacent drift rings. The gate was closed when ±40 V were applied to adjacent wires so that a 320 V cm−1 orthogonal field stopped positive or negative ions approaching the gate. These voltages neutralized the ions on the negative or positive wires. This closure voltage was removed for 0.1 ms so that a narrow pulse of ions could enter the drift region to be analyzed.
2.4. MS instrument
An ABB Extrel 150-QC (Pittsburgh, PA) quadrupole mass spectrometer (0-4000 Da) was used in these experiments. A Keithley model 427 amplifier (Keithley Instruments, Cleveland, OH) amplified the output signal from the electron multiplier detector of the mass spectrometer and sent it to the data acquisition systems. The mass spectrometer was controlled with Merlin software (version 3.0 ABB Extrel, Pittsburgh, PA), which collected the mass spectral data. Igor Pro 5.0.3 (WaveMetrics, Portland, OR) was used to process the spectral data text files.
2.5. Modes of operation
When coupling an ion mobility spectrometer to a quadrupole mass spectrometer, there are several possible modes of operation. In radiofrequency-IMS mode (IMS), the DC voltages in the mass spectrometer are off, and all ions reach the detector; in this mode, the IMS spectrum of ions of all masses is obtained. In single ion monitoring-IMS mode (SIM-IMS), the DC and RF voltages in the mass spectrometer are set to allow only ions with a specific mass or a selection of specific masses to reach the detector. SIM-IMS allows the analysis of specific compounds without the interference of others of different masses. In MS mode, all ions pass continuously, without pulsing, through the mobility spectrometer directly to the mass spectrometer, and are mass analyzed; mass spectra are obtained in this mode.
2.6. Materials and reagents
The amino acids methionine, phenylalanine, serine, threonine, tryptophan, and tyrosine; valinol, 2,4-dimethylpyridine (2,4-lutidine), 2,6-di-tert-butyl pyridine (DTBP), 2-butanol (2B), and tetramethylammonium, tetraethylammonium, tetrapropylammonium, and tetrabutylammonium chlorides (ACS reagent grade, ≥98% purity) were purchased from Sigma Aldrich Chemical Co. (Milwaukee, WI). These compounds were selected as analytes because they provide a series of ions with different molecular weights and steric properties required to test the effects of size and steric hindrance on the change in mobilities with the introduction of 2-butanol into the buffer gas. 2B was used here because in a previous study 2B was found to interact with several compounds and not just with enantiomers [11]. In this study, we investigate selective effects of 2B on non-enantiomers.
2.7. Sample preparation and introduction
50 μM standard solutions of the analytes were prepared in ESI solution (47.5 % methanol: 47.5 % water: 5 % acetic acid). Liquid samples or blank solution (ESI solution) was infused continuously by electrospray ionization using 250 μl syringes (Hamilton, Reno, NV) at a flow rate of 3 μl min−1 into 30 cm long, 100 μM ID capillary (Polymicro Technologies, Phoenix, AZ). This capillary was connected, through a stainless steel union (Valco, Houston, TX), to a 50 μm ID silica capillary. The end of this capillary was centered at a target screen, placed at the entrance of the mobility spectrometer. The target screen was made out of 2-mm stainless steel mesh with a 0.5-cm round hole in the center. A high voltage of 15.6 kV (or 3.5 kV bias with respect to the target screen at the first ring) was applied to the stainless steel union to produce positive electrosprayed ions. To prevent cross contamination between the analytes, different syringes and capillaries were used for every compound whenever possible.
2.8. 2-butanol introduction
2-butanol was introduced into the buffer gas at concentrations up to 6.8 mmol m−3. To introduce the modifier, the method used by Dwivedi et al. was modified as follows [11]. 2-butanol was injected with gas tight syringes (pumped by a KD Scientific pump, model 210) to avoid leaking. 2-butanol was introduced through a 10-cm-long, 50-μm ID silica capillary into the buffer gas line using a T-junction, before the buffer gas heater (Figure 1). Introducing 2-butanol before the buffer gas heater provided a longer path to obtain a homogeneous mixture of 2-butanol with the buffer gas. To help vaporize the modifier, the temperature of the T-junction was increased to approximately 150 °C using a heating tape (OMEGA Engineering, Stamford, CT).
2.9. Identification of compounds and calibration
All analytes were detected as [M+H]+ ions or their clusters with 2-butanol. Analytes were identified by comparing their m/z ratio in mass spectrometry to the molecular weight of their protonated molecules or clusters. Also, reduced mobilities of protonated analyte ions were compared with those from literature.
To account for errors in measuring instrumental parameters, Eiceman et al. [15] recommend correcting reduced mobilities by comparing with standards:
| (1) |
where K0 is the reduced mobility in cm2V−1s−1 and td the drift time in ms. A new IMS calibration method, recently proposed, was used [16]. This method uses DTBP as the chemical standard to calibrate the instrument by replacing its drift time and mobility value in Equation 1. The method also uses 2,4-lutidine to determine the presence of contamination in the buffer gas.
3. RESULTS AND DISCUSSIONS
3.1. 2-butanol and the reactant ions
When no modifier was added to the buffer gas, the ion mobility spectrum of the reactant ions after electrospray ionization is shown in Figure 2a. In this spectrum, the main reactant ion peak was observed at a drift time of 13.7 ms, which corresponded to a reduced mobility value of 2.65 cm2V−1s−1. When the ion gate was held open, and all of the ions passed into the mass spectrometer, the predominant ions seen in the mass spectrum were (H2O)nH+ at m/z 37, 55, 73, and 91 as shown in Figure 2b. These peaks coalesced into a single mobility peak at 13.7 ms in the IMS spectrum due to the equilibria (H2O)nH+ ↔ (H2O)n-mH+ + mH2O. Figures 2c and 2d show the spectra of the solvent when 1.7 mmol m−3 of 2-butanol (2B) was added to the buffer gas. At these 2-butanol concentrations the reactant ion was modified by forming proton bound dimers with 2-butanol. The monomer and dimer of 2-butanol occurred at m/z 75 and 149 (Figure 2d); in the IMS spectra in Figure 2c, the major reactant ion occurred at a drift time of 20.3 ms, which corresponded to the monomer and dimer ions of 2-butanol, with a reduced mobility of 1.71 cm2V−1s−1; (H2O)nH+ ions were shifted to 16.6 ms, with a reduced mobility of 2.16 cm2V−1s−1.
Figure 2. Clustering of the reactant ion peaks with 2-butanol, and clusters of 2-butanol.

IMS (a and c) and MS spectra (b and d) of the ESI solvent in pure nitrogen (a and b), and when 1.7 mmol m−3 of 2-butanol was injected into the buffer gas (c and d). The reactant ion peak, (H2O)nH+ , appeared at 13.7 ms in (a). The IMS peaks are broadened and shifted to lower mobilities in (c) due to interactions with the modifier. The peak at 32 ms in (c) is due to a contaminant at m/z 371.
3.2. Drift region equilibria
When the amino acid serine was electrosprayed at a concentration of 500 μM into the IMS-MS, with no modifier added to the buffer gas, the product ion peak was observed at 18.4 ms, as shown in Figure 3a. When 2-butanol was added to the buffer gas at concentrations of 1.7 mmol m−3 (62ppmv), 3.4 mmol m−3 (125ppmv), and 6.8 mmol m−3 (250 ppmv) the drift time of the serine product ion peak increased from 18.4 ms with no modifier to 19.3, 20.0, and 20.4 ms. The ion mobility spectra from each of these conditions are shown in Figure 3a. Figure 3b is the mass spectrum of serine at the maximal modifier concentration of 6.8 mmol m−3. Under these conditions, clusters of 2-butanol with serine are formed. Ion peaks at m/z values of 180, 254, and 328 were observed, which corresponded to the ion clusters of Ser(2B)H+, Ser(2B)2H+, and Ser(2B)3H+.
Figure 3. Reduction in mobility with the introduction of 2-butanol into the buffer gas.

(a) IMS spectra showing the variation in drift times of a 500-μM solution of serine (Ser) with 2-butanol (2B) concentration in the buffer gas at 150°C; serine protonated molecule, Ser.H+, and the clusters of serine, Ser(2B)nH+, appeared at the same drift time, which indicates that the peaks shown in the mass spectrum (b) were serine-2-butanol clusters. (b) Mass spectrum of a 100-μM solution of serine (500 averages) when 6.8 mmol m−3 (2.5×10² ppmv) of 2-butanol were introduced into the buffer gas at 100°C; formation of serine clusters with up to 3 molecules of 2-butanol are evident.
Although the mass spectra showed several ion clusters, the ion mobility spectrum contained only one peak for serine. This single peak indicated that the clustering/declustering reactions occurred in equilibrium in the buffer gas at rates sufficiently rapid to produce a single ion mobility peak with a weighted average of the mobilities of the individual ions. The protonated analyte ion traveled through the drift tube interconverting rapidly into analyte-modifier clusters, back and forth . Thus, the following equilibria occurred in the drift region between the protonated molecule of serine, 2-butanol, and serine-2-butanol clusters:
This clustering is possible due to the formation of hydrogen bonds between the electronegative oxygen atom in 2-butanol and the partially positive charge on the amine hydrogen atoms of serine. As a result of these equilibria, the drift time of serine increased with increasing 2-butanol concentration in the buffer gas. Assuming that the clusters do not form or decompose at the atmospheric/vacuum interface, the intensity of each ion species in the mass spectrometer is indicative of the relative concentration of the individual ion species that produced the ion mobility peak. The clusters formed in the source, and were in equilibria with 2-butanol while traveling the drift tube because serine’s drift time increased as 2-butanol concentration increased, and the IMS peaks were well defined.
The maximum number of 2-butanol molecules clustering with serine was three, which corresponded to the number of hydrogen atoms on the positive nitrogen. These results agreed with those reported by Bollan et al [10]. They found that the number of ketone molecules binding to hydrazines and ammonia analytes, when the buffer gas was doped with ketones, depended on the number of hydrogen atoms on the protonated nitrogen of the analytes; these were four H atoms for ammonia, three for hydrazine, two for monomethyl hydrazine, and one for 1,1-dimethylhydrazine.
3.3. Selective clustering with 2-butanol
Reductions in mobilities for analytes other than serine also were found when 2-butanol was introduced into the buffer gas. Figures 4a and 4b plot the changes in K0 values for a number of analytes as a function of modifier concentration when 2-butanol was increased in the buffer gas at 150 °C. As the 2-butanol concentration increased, the mobility of threonine, methionine, tyrosine, valinol, phenylalanine, tryptophan, and 2,4-lutidine decreased, but the mobility of tetraalkylammonium ions and DTBP did not change. Table 2 summarizes the percentage reduction in mobilities (%ΔK0) for the test compounds with the introduction of 2-butanol in the drift tube. %ΔK0 was defined as the percentage difference between K0 in N2-only buffer gas and K0 when 2-butanol modifier was introduced into the buffer gas at a given concentration. When 2-butanol concentration was increased from 0.0 to 6.8 mmol m−3 (2.5×10² ppmv) at 150 °C, %ΔK0 values were: 13.6% (serine), 12.2% (threonine), 10.4% (methionine), 10.3% (tyrosine), 9.8% (valinol), 9.2% (phenylalanine), 7.8% (tryptophan), 5.6% (2,4-lutidine), 2.2% (DTBP), 1.0% (TEA and TMA), 0.3% (TBA), and 0.0% (TPA) (Table 2). These %ΔK0 values were not statistically different between TBA and TPA. Only differences greater than 0.32% were considered significant. This value was calculated from the maximum relative standard deviation of the drift times, 0.05 ms.
Figure 4. Effect of 2-butanol concentration in the buffer gas and temperature in ion mobility.

(a) TMA (–○–), 2,4-lutidine (–□–), TEA (–*–), TPA (–x–), DTBP (–◇–), TBA (–△–); (b) valinol (--□--), serine (--○--), threonine (--◇--), methionine (--△--), phenylalanine (--*--), tyrosine (--•--), and tryptophan (--x--). (c) serine and TBA at 100 (··○··), 150 (··◇··), 200 (··□··), and 250 °C (··△··); the mobility of analytes decreased due to the formation of ion-2-butanol clusters as 2-butanol concentration increased at 150 °C (a and b) or as the temperature decreased (c). Figure 4c indicates an increase in the ion-2-butanol interactions at lower temperatures for serine (revealed by a reduction in mobility). TBA was not affected by temperature due to its lack of clustering. The mobilities of serine were lower at lower temperatures in N2-only buffer gas due to clustering with moisture.
Table 2.
Percentage decrease in K0 values, %ΔK0, at 6.8 mmol m−3 of 2-butanol in the buffer gas for selected compounds. Differences of less than 0.32 units in %ΔK0 may arise from the standard deviation of the drift time measurements (0.05 ms). %ΔK0 was defined as the percentage difference between K0 in N2-only buffer gas and K0 when a modifier was introduced into the buffer gas at a given concentration
| Class | Compound | %ΔK0 |
|---|---|---|
| 2,4-lutidine | 5.6 | |
| DTBP | 2.2 | |
| Amines | TBA | 0.3 |
| TEA | 1.0 | |
| TPA | 0.0 | |
| TMA | 1.0 | |
| Methionine | 10.4 | |
| Phenylalanine | 9.2 | |
| Amino acids | Serine | 13.6 |
| Threonine | 12.2 | |
| Tryptophan | 7.8 | |
| Tyrosine | 10.3 | |
| Amino alcohol | Valinol | 9.8 |
In general, the changes in mobility with the introduction of modifier into the buffer gas were selective and depended on the analyte structure. %ΔK0 values decreased with molecular weight of the analytes; this trend may be due to the small effect on ion size when a molecule of 2-butanol clusters to large molecules.
3.4. Effects of ion structure on clustering
%ΔK0 values also appeared to depend on the steric hindrance on the ion charge. %ΔK0 values were small or negligible for tetraalkylammonium ions and 2,6-di-tert-butyl pyridine (DTBP). The other pyridine, 2,4-lutidine, showed significant changes with the concentration of 2-butanol. When 2-butanol concentration was increased from 0.0 to 6.8 mmol m−3 (2.5×10² ppmv) at 150 °C, %ΔK0 values for these compounds were: 5.6% (2,4-lutidine), 2.2% (DTBP), 1.0% (TMA and TEA), 0.3% (TBA), and 0.0% (TPA) (Table 2). This relative insensitivity of tetraalkylammonium ions and DTBP to 2-butanol concentration in the buffer gas was due to the lack of clustering of these ions; the mass spectrum of tetraalkylammonium ions exhibits only single peaks for these compounds up to 6.8 mmol m−3 (2.5×10² ppmv) of 2-butanol in the buffer gas at 150 °C (Figure 5); also, Figure 5b shows only a single peak for DTBP in the mass spectrum of a mixture of DTBP and 2,4-lutidine when 6.8 mmol m−3 (2.5×10² ppmv) of 2-butanol were introduced into the buffer gas. This lack of clustering of DTBP and tetraalkylammonium ions was probably due to steric hindrance that deterred the attachment of 2-butanol molecules to the positive nitrogen in these compounds, as illustrated in Figure 6; in tetraalkylammonium ions, this steric hindrance was caused by the four alkyl substituents [17]. In DTBP, the hindrance was produced by the two tert-butyl groups. The mobility of 2,4-lutidine was affected by 2-butanol more than that of the other pyridine, DTBP, because 2,4-lutidine formed one cluster at m/z 182 in the mass spectrum in Figure 5b; this clustering with 2,4-lutidine was due to lack of steric hindrance to the charge; the substituents on the ring of 2,4-lutidine are small methyl groups located at positions 2 and 4 on the ring, ineffectively shielding the positive pyridine nitrogen from the attachment of 2-butanol molecules. In contrast, DTBP has two large tert butyl groups in positions 2 and 6 on the ring, more effectively shielding the charge. These large substituents in tetraalkylammonium ions and DTBP also delocalized the charge, weakening the ion-modifier interactions, which resulted in less clustering [18,19].
Figure 5. Non-clustering compounds.

Mass spectra (500 averages) of selected compounds when 6.8 mmol m−3 (2.5×10² ppmv) of 2-butanol were introduced into the buffer gas at 150°C (a) 100-μM solution of tetraalkylammonium ions showing the lack of clustering of these ions; this lack of clustering was due to steric hindrance produced by the four alkyl substituents on the positive nitrogen that shield the positive charge from 2-butanol molecules. (b) Mixture of DTBP (0.2 μM) and 2,4-lutidine (0.001 ppm) showing the absence of the cluster of DTBP with 2-butanol at m/z 266.3 due to steric hindrance, and the cluster of 2,4-lutidine at m/z 182.3.
Figure 6. 3D models of TMA, 2,6-di-tert-butyl pyridine (DTBP), and 2,4-lutidine.

The arrows signal the positive charge, sterically hindered in TMA and DTBP, but more accessible in 2,4-lutidine. The models were generated using the program Chem3D Pro 11.0.
3.5. Effects of buffer gas temperature on clustering
As expected from early work in our laboratory [16], clustering decreased with higher temperatures due to more energetic collisions of the clustered ions with the buffer gas. Figure 4c plot the changes in K0 values for serine at four different temperatures when 2-butanol concentration was increased from 0.0 to 6.8 mmol m−3 (2.5×10² ppmv) in the buffer gas. For serine %ΔK0 values were 1.3% (250°C), 7.0% (200°C), 14% (150°C), and 16% (100 °C). Figure 7a shows the absence of ion-2-butanol clusters at high temperature (250°C) in the mass spectrum of an amino acid mixture containing serine, threonine, phenylalanine, tyrosine, and tryptophan when 6.8 mmol m−3 of 2-butanol were introduced into the buffer gas; these clusters were abundant in the mass spectrum of the mixture at low temperatures (100 °C) at the same 2-butanol concentration (Figure 7b); this figure displays 1:1 clusters of serine, threonine, phenylalanine, tyrosine, and tryptophan with 2-butanol occurring at m/z 180, 195, 240, 256, and 279, respectively. The clusters of serine with one and two molecules of 2-butanol at m/z 180 and 254 may be overlapping with the protonated molecule peak of tyrosine at m/z 182 and its cluster at m/z 256. The cluster of threonine with two molecules of 2-butanol appears as a small peak at m/z 264. These clusters had large collision cross sections, which reduced the mobilities of the analytes.
Figure 7. Absence of clusters at high temperature.
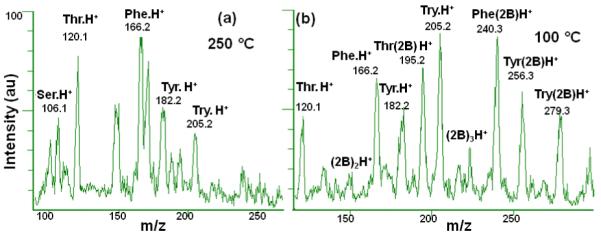
Mass spectra (500 averages) of 100-μM mixtures of the amino acids serine (Ser), threonine (Thr), phenylalanine (Phe), tyrosine (Tyr), and tryptophan (Try) at 250 °C (a) or 100 °C (b) and 6.8 mmol m−3 (2.5×10² ppmv) of 2-butanol (2B) in the buffer gas. No clusters were present at high temperature; in contrast, at low temperature, there is an extensive formation of clusters. The clusters of serine (m/z 180.2 and 254) may be overlapped with the broad protonated molecule peak of tyrosine (m/z 182) and its cluster at (m/z 256 ). The cluster of threonine with two molecules of 2-butanol appears as a small peak at m/z 264.3.
For compounds that sterically hindered the formation of clusters, temperature did not affect their reduced mobilities even in the presence of modifiers. Figure 4c shows that the reduced mobility of TBA was not affected by temperature between 100 and 250°C. The stability of TBA’s mobility is due to its non-clustering behavior (Figure 5a); if TBA had formed clusters with 2-butanol, these clusters would have survived at 100°C, producing changes in mobility of TBA with the increase in 2-butanol concentration.
3.6. Modifier Saturation
Locations for ligand binding on an ion are limited. A limit to mobility change as a function of modifier concentration indicates ligand saturation on the analyte’s positive charge. Figure 4 demonstrates a flattening of mobility values at a concentration of 6.8 mmol m−3 of 2-butanol in the buffer gas, which indicates ligand saturation of the hydrogen atoms, available for binding with modifier molecules, on the positive charge of the analyte [10]; this saturation, due to overloading of the buffer gas with 2-butanol, would deter or decrease the attachment of additional modifier molecules to the analytes, and a smaller decrease in mobility would be obtained with increasing concentrations of the modifier. Overloading with 2-butanol was evident in the presence of clusters of serine with one, two, and three 2-butanol molecules, and also from the occurrence of the dimer, trimer, and tetramer peaks of 2-butanol in the mass spectrum at high concentrations of the modifier (Figure 3b). Further investigation is required to determine if the curves in Figure 4b reach a plateau or if the mobilities keep slowly decreasing.
3.7. Separation Selectivity
The primary reason why modifiers are useful in IMS is that separations can be affected, which cannot be achieved in the pure buffer gas alone. For example, Figure 4b shows that the product ions of valinol and serine had the same mobility in N2 buffer gas. When 2-butanol modifier is added to the buffer gas, the mobility of serine changed more than that of valinol. Thus, it should not be possible to separate these two compounds in N2, but when the modifier is added, they should separate. In Figure 8a, the IMS spectrum of a mixture of valinol and serine in N2-only buffer gas show the peaks of these amino acids overlapping at 18.9 ms; when introducing 1.7 mmol m−3 of 2-butanol modifier into the buffer gas, valinol and serine clustered with 2-butanol, the response ions shifted to 19.5 ms and 21.0 ms (Δtd = 1.5 ms), respectively, and the mixture was baselined resolved with a resolution 1.5. This separation would not be possible with this modifier using the current instrument because the separation between these compounds was less than 0.3 ms. To separate these compounds without using modifier a longer instrument or the use of higher voltages on the tube would be needed which would make the instrument expensive. The separation of overlapping peaks by adding modifiers to the buffer gas is, therefore, an inexpensive alternative to instrument modification, as is demonstrated here.
Figure 8. Separation of a mixture of valinol and serine by introducing 2-butanol into the buffer gas.
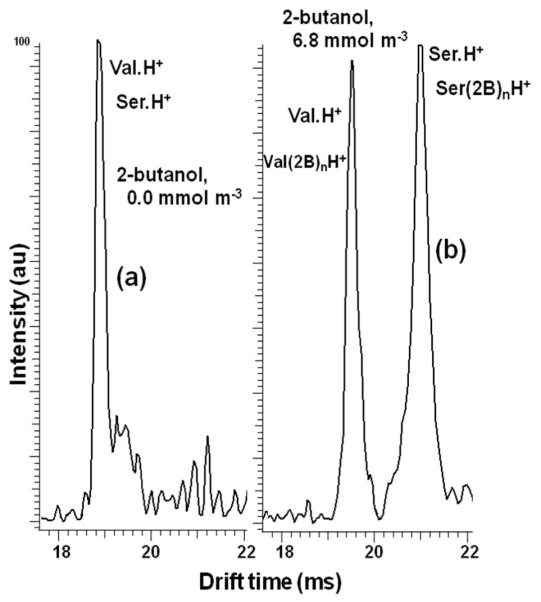
(a) IMS spectra of the mixture in N2-only buffer gas showing one overlapping peak for both compounds at 18.9 ms. (b) Resolution of the mixture by introducing 1.7 mmol m−3 of 2-butanol modifier into the buffer gas.
4. CONCLUSIONS
The primary objective of this paper was to investigate the addition of modifiers in IMS for the purpose of generating selective ion separations. 2-Butanol was chosen as a model modifier because of its volatility and previous experience in our lab as a buffer gas modifier. The introduction of 2-butanol in the buffer gas of an ion mobility spectrometer decreased the mobilities of several target compounds while other compounds were unaffected. The extent of the reductions in mobility for the compounds that changed was also different; the reductions in mobility were due to the formation of transient ion-2-butanol clusters of large collision cross sections. Clustering depended on the structure and molecular weight of the analyte; steric hindrance deterred formation of clusters with tetraalkylammonium ions and DTBP, and, therefore, the mobility of these compounds were less affected by the presence of a modifier; the mobilities of large compounds, such as tryptophan when compared to smaller amino acids, were less affected by the attachment of 2-butanol molecules because the collision cross section of ions of large size is less affected by formation of clusters; on the contrary, the mobilities of small molecules were largely affected by clustering. These differences in the reductions in ion mobilities were applied towards the separation of compounds with similar K0 values, such as valinol and serine, which overlapped in the IMS spectra in N2-only buffer gas. The ion-2-butanol clusters were abundant at low temperatures, due to strong interactions of the ions with 2-butanol. Finally, the change in mobility values as a function of modifier concentration was found to reach a limit at high concentrations of 2-butanol due to ligand saturation of the hydrogen atoms available for binding on the positive nitrogen of the analytes.
Research highlights.
Mobilities of ions were determined using IMS-MS while introducing 2-butanol into the buffer gas
The mobilities of the test ions decreased by varying extents
These variations in mobility depended on the size and steric hindrance on the charge of the ions
These variations in mobility were due to formation of large ion-2-butanol clusters
This selective variation in mobilities was applied to the resolution of a mixture of compounds
Graph 1.

Table 3.
Reduced mobility values (K0) in cm2/(V.s) for this work and literature values
| This work |
||||
|---|---|---|---|---|
| Analytes | Literature K0 |
K0 | RSD | %δK0 |
| Alanine | 1.82 a 1.81 b | 1.92 | 0.4 | 5.1 a 5.7 b |
| Serine | 1.73 a 1.82 b | 1.87 | 0.3 | 7.2 a 2.7 b |
| Threonine | 1.68 a 1.76 b | 1.81 | 0.2 | 6.9 a 2.8 b |
| Isoleucine | 1.58 a 1.63 b | 1.68 | 0.4 | 5.8 a 3.0 b |
| Methionine | 1.55 a 1.60 b | 1.67 | 0.1 | 7.4 a 4.2 b |
| Phenylalanine | 1.45 a 1.50 b | 1.55 | 0.1 | 6.7 a 3.2 b |
| Tyrosine | 1.37 a 1.44 b | 1.48 | 0.3 | 8.0 a 2.7 b |
| Tryptophan | 1.31 a 1.35 b | 1.40 | 0.2 | 7.1 a 3.6 b |
| Valinol | 1.74 c | 1.85 | 0.1 | 6.0 c |
[20]
[21]
[11]
RSD: Relative standard deviation (repeatability). The repeatability of the reduced mobilities, calculated as the RSD of the K0 values of one sample analyzed continuously (n≥5), showed an average of less than 0.2%. The reproducibility of the reduced mobilities, calculated as the relative standard deviation of the K0 values of 5 different samples of different concentrations, prepared independently and analyzed in different days, was <2%. Data were obtained in the SIM-IMS mode. %δK0: % difference in K0 values with respect to values of Beegle 2001 [20], Dwivedi 2006 [11], or Asbury 2000 [21].
ACKNOWLEDGEMENTS
This work was supported by a grant from Excellims Corporation (Acton, MA) and NIH grant R33DK0702740351. The authors thank Dr. Brad Bendiak (University of Colorado) for his kind donation of reagents and the WSU-GPWC for proofreading the manuscript.
ABBREVIATIONS
- (DTBP)
2,4-dimethyl pyridine (2,4-lutidine), 2,6-di-tert-butyl pyridine
- (TMA)
tetramethylammonium ion
- (TEA)
tetraethylammonium ion
- (TPA)
tetrapropylammonium ion
- (TBA)
tetrabutylammonium ion
- (ESI-IMS-QMS)
electrospray ionization-ion mobility spectrometry-quadrupole mass spectrometry
- (HZ)
hydrazine
- (MMH)
monomethylhydrazine
- (SIM-IMS)
single ion monitoring-IMS mode
- (K0)
reduced mobility
- (td)
drift time
Footnotes
Publisher's Disclaimer: This is a PDF file of an unedited manuscript that has been accepted for publication. As a service to our customers we are providing this early version of the manuscript. The manuscript will undergo copyediting, typesetting, and review of the resulting proof before it is published in its final citable form. Please note that during the production process errors may be discovered which could affect the content, and all legal disclaimers that apply to the journal pertain.
REFERENCES
- [1].Kim SH, Karasek FW, Rokushika S. Anal. Chem. 1978;50:152–155. [Google Scholar]
- [2].Blyth DA. A vapor monitor for detection and contamination control; Proc. Int. Symp, Against Chem, Warfare Agents; Stockholm. 1983. [Google Scholar]
- [3].Spangler GE, Carrico JP, Campbell DN. J. Test Eval. 1985;13:234. [Google Scholar]
- [4].Proctor CJ, Todd JFJ. Anal. Chem. 1984;56:1794–1797. [Google Scholar]
- [5].Eiceman GA, Wang YF, Garcia-Gonzalez L, Harden CS, Shoff DB. Anal. Chim. Acta. 1995;306:21–33. [Google Scholar]
- [6].Meng Q, Karpas Z, Eiceman GA. Int. J. Environ. Anal. Chem. 1995;61:81–94. [Google Scholar]
- [7].Eiceman GA, Salazar MR, Rodriguez MR, Limero TF, Beck SW, Cross JH, Young R, James JT. Anal. Chem. 1993;65:1696–1702. doi: 10.1021/ac00061a011. [DOI] [PubMed] [Google Scholar]
- [8].Gan H, Corino GT. Anal. Chem. 2000;72:807–815. doi: 10.1021/ac990549k. [DOI] [PubMed] [Google Scholar]
- [9].Puton J, Nousiainen M, Sillanpaa M. Talanta. 2008;76:978–987. doi: 10.1016/j.talanta.2008.05.031. [DOI] [PubMed] [Google Scholar]
- [10].Bollan HR, Stone JA, Brokenshire JL, Rodriguez JE, Eiceman GA. J. Am. Soc. Mass Spectrom. 2007;18:940–951. doi: 10.1016/j.jasms.2007.01.014. [DOI] [PubMed] [Google Scholar]
- [11].Dwivedi P, Wu C, Matz LM, Clowers BH, Siems WF, Hill HH., Jr. Anal. Chem. 2006;78:8200–8206. doi: 10.1021/ac0608772. [DOI] [PMC free article] [PubMed] [Google Scholar]
- [12].Wu C, Siems WF, Asbury GR, Hill HH. Anal. Chem. 1998;70:4929–4938. doi: 10.1021/ac980414z. [DOI] [PubMed] [Google Scholar]
- [13].Hill HH, Jr., Simpson GJ. Field Anal. Chem. Technol. 1997;1:119–134. [Google Scholar]
- [14].Wittmer D, Chen YH, Luckenbill BK, Hill HH. Anal. Chem. 1994;66:2348–2355. [Google Scholar]
- [15].Eiceman GA, Nazarov EG, Stone JA. Anal. Chim. Acta. 2003;493:185–194. [Google Scholar]
- [16].Fernandez-Maestre R, Harden CS, Ewing RG, Crawford CL, Hill HH., Jr Analyst. 2010;135:1433–1442. doi: 10.1039/b915202d. [DOI] [PMC free article] [PubMed] [Google Scholar]
- [17].Viidanoja J, Sysoev A, Adamov A, Kotiaho T. Rapid Commun. Mass. Spectrom. 2005;19:3051–3055. doi: 10.1002/rcm.2172. [DOI] [PubMed] [Google Scholar]
- [18].Eiceman GA, Karpas Z. Ion mobility spectrometry. Second ed. Taylor & Francis; Boca Raton, FL, USA: 2005. [Google Scholar]
- [19].Sunner J, Ikonomou MG, Kebarle P. Anal. Chem. 1988;60:1308–1313. [Google Scholar]
- [20].Beegle LW, Kanik I, Matz L, Hill HH. Anal. Chem. 2001;73:3028–3034. doi: 10.1021/ac001519g. [DOI] [PubMed] [Google Scholar]
- [21].Asbury GR, Klasmeier J, Hill HH., Jr. Talanta. 2000;50:1291–1298. doi: 10.1016/s0039-9140(99)00241-6. [DOI] [PubMed] [Google Scholar]