

Abstract
Both adenosine and nitric oxide (NO) are known for their role in sleep homeostasis, with the basal forebrain (BF) wakefulness center as an important site of action. Previously we reported a cascade of homeostatic events, wherein sleep deprivation (SD) induces the production of inducible nitric oxide synthase (iNOS)-dependent NO in BF, leading to enhanced release of extracellular adenosine. In turn, increased BF adenosine leads to enhanced sleep intensity, as measured by increased non-rapid eye movement (NREM) EEG delta activity. However, the presence and time course of similar events in cortex has not been studied, although a frontal cortical role for the increase in NREM recovery sleep EEG delta power is known. Accordingly, we performed simultaneous hourly microdialysis sample collection from BF and frontal cortex (FC) during 11h SD. We observed that both areas showed sequential increases in iNOS and NO, followed by increases in adenosine. BF increases began at 1h SD, while FC increases began at 5h SD. iNOS and Fos-double labeling indicated that iNOS induction occurred in BF and FC wake-active neurons. These data support the role of BF adenosine and NO in sleep homeostasis and indicate the temporal and spatial sequence of sleep homeostatic cascade for NO and adenosine.
Keywords: Adenosine, Nitric Oxide, Inducible Nitric Oxide Synthase, Sleep Homeostasis, Cholinergic Basal Forebrain, Frontal Cortex
INTRODUCTION
Although the temporal dynamics of non-rapid eye movement (NREM) sleep homeostatic regulation have been described (Borbely, 1982), discovery of the underlying endogenous factors involved in NREM sleep homeostatic regulation and the biological mechanisms leading to enhanced sleepiness after sleep deprivation (SD) remains a key area of investigation. Recent studies from our lab and others have identified adenosine as an important homeostatic sleep factor, and the basal forebrain (BF) wakefulness center as an important site of its action (Basheer et al., 2004; McCarley, 2007). The levels of extracellular adenosine increase during spontaneous and forced waking (Porkka-Heiskanen et al., 1997; Basheer et al., 1999; Murillo-Rodriguez et al., 2004; McKenna et al., 2007). Data indicate that increased adenosine acts on the inhibitory A1 adenosine receptors (A1R) to inhibit the BF wakefulness-active neurons, thereby allowing the onset of sleep (Thakkar et al., 2003; Arrigoni et al., 2006). More than one mechanism and brain region are likely involved in sleep homeostasis. For example, SD longer than 12h results in increased number of active A1R in the BF and cortex, indicating an increased inhibitory tone of adenosine in the longer-term homeostatic sleep response (Basheer et al., 2007; Elmenhorst et al., 2007; 2009). Mechanistically, we have postulated that the cause of the increased cortical A1R binding likely parallels that observed in BF, where data indicate that adenosine acts on the A1R to activate an intracellular signaling pathway leading to a positive feedback regulation of A1R expression (Basheer et al., 2002; Ramesh et al., 2007). These findings thus suggest that the term “homeostatic cascade” is appropriate for sleep homeostasis, since a series of events in several brain regions are called into play according to the severity of sleep loss. However, a critical element in the postulated cascade has not yet been measured. Although A1R binding in cortical areas receiving BF projections increases with longer-term SD, it is not known whether there is a corresponding increase in adenosine levels in the cortex and its timing relative to adenosine increases in the BF.
With respect to adenosine production, our recent reports suggest that the gaseous neuromodulator, nitric oxide (NO), constitutes an integral part of the homeostatic cascade (Kalinchuk et al., 2006a,b). During SD, there was a doubling of the BF concentration of nitrite and nitrate (NO2− and NO3−, abbreviated NOx), which are indirect measures of NO (described in Methods). Pharmacological studies have demonstrated that NOx increase is dependent on the activity of inducible nitric oxide synthase (iNOS) and that in the cascade of events, NO production occurs upstream from adenosine release, since inhibiting iNOS also prevented the SD-induced adenosine increase (Kalinchuk et al., 2006b). Recently, we reported that iNOS-dependent NO production occurs in wakefulness-active BF neurons, and that the extent of this production was positively correlated with the degree of homeostatic sleep pressure (Kalinchuk et al., 2010). This study employed iNOS immunohistochemistry and a novel assay of in vivo intracellular fluorescent NO staining using a cell-membrane permeable dye that bound intracellular NO, 4,5-Diaminofluorescein-2/Diacetate (DAF-2/DA) (Kojima et al., 1998a, b).
The present study was designed to measure the relative time course of adenosine and NOx in the cortex, not previously done, and to compare with that in BF and thereby to test whether there is a temporal and regional sequence of occurrence of homeostatic events with progressively more severe SD. The present study examined hourly changes in adenosine and NOx in microdialysates obtained simultaneously from three regions of the rat brain, the BF, frontal associative cortex (FC) and cingulate cortex (CC) during 11h SD followed by 2h recovery sleep. Since we have found SD-induced NOx production to be iNOS-dependent in the BF (Kalinchuk et al., 2006b) and iNOS is regulated both at the transcriptional and translational levels (Aktan, 2004; Kleinert et al., 2004; Calabrese et al., 2007), we also used the same SD paradigm to examine the time course of increase in iNOS mRNA using real time polymerase chain reaction (RT-PCR), as well as iNOS protein using Western blots. We here report findings on the time-course of SD-dependent changes in iNOS, NOx and adenosine, and their close correspondence with the increase in sleep propensity during recovery sleep that follows increasing durations of SD. These data lend support to our homeostatic cascade model: BF initially reacts to SD by -dependent NO and adenosine release, while longer episodes of SD lead to cortical production of NO and adenosine.
MATERIALS AND METHODS
Subjects
Male rats (Wistar, Charles River, n=174), 250–300g used in this study were kept in a room with constant temperature (23.5–24°C) and 12-h light-dark cycle (lights on at 7:00AM). Water and food were provided ad libitum. Animals were treated in accordance with the Association for Assessment and Accreditation of Laboratory Animal Care and Use Committee at Boston VA Healthcare system, Harvard University and U.S. National Institute of Health. Every effort was made to minimize animal suffering and to reduce the number of animals used.
Surgical preparation
Under general anesthesia (i.m. ketamine 7.5mg/100g body weight, xylazine 0.38mg/100g, acepromazine 0.075mg/100g) all rats were implanted with electroencephalogram (EEG) and electromyogram (EMG) electrodes. EEG electrodes were implanted epidurally over the frontal (primary motor, AP=+2.0; ML=2.0) and parietal (retrosplenial, AP=−4.0; ML=1.0) cortices. The electrodes were connected to a multichannel electrode pedestal (Plastic One Inc) and fixed onto the scull by acrylic cement. Rats assigned for the measurements of adenosine and NOx (Experiment 1, n=6) were also implanted with intracerebral guide cannulae (CMA/Microdialysis, Stockholm, Sweden) targeting the BF and two cortical areas which receive projections from the BF (Gaykema et al., 1990) - cingulate (CC) and frontal associative (FC). The coordinates for the target sites were as follows: BF (horizontal limb of diagonal band, HDB/substantia innominata, SI/magnocellular preoptic area, MCPO, AP=−0.3, L=1.8, H=−9.0), the FC (AP=4.7, L=2.0, H=2.0) and the CC (AP=1.7, L=0.5, H=2.4) (Paxinos and Watson, 1998) (Fig. 1A, B&C).
Figure 1. Schematic illustration of the sites of measurements.

(A,B,C) Localization of microdialysis probe tips for adenosine and NOx measurements. (D, E, F) Brain regions dissected for iNOS mRNA and iNOS protein measurements. (A, D) – frontal cortex, FC; (B, E) – cingulate cortex CC; (C, F) – the basal forebrain, BF. Section sketches and location are from Paxinos and Watson (1998).
Recovery and adaptation
After surgery rats were housed in individual cages and were allowed 1 week of recovery before experiments. Beginning 3 days after surgery, animals were habituated to experimenters by daily 10min training sessions that included handling and removal from the cages. Habituation was regarded as complete when there were no reactions of fear or aggression when the researcher approached the cage and touched them.
After 1 week of the recovery period, animals were connected to EEG/EMG recording leads for adaptation for 4 days. On the last day of adaptation, animals were connected to the EEG/EMG recording cables at 7:00AM, and EEG/EMG were continuously recorded for at least 24h to monitor the stabilization of EEG and sleep-waking cycle. All efforts were made to achieve maximal adaptation of animals to the experimental conditions and minimize possible stress related to novelty of manipulations during experiments.
SD paradigm
In all experiments animals were sleep deprived for different periods starting at 8:00AM (1h after lights on). SD was performed using the widely accepted technique of gentle handling (Tobler and Borbely, 1990; Franken et al., 1991; Basheer et al., 2001; Kalinchuk et al., 2003). Animals were kept awake by introducing novel objects into the cage when they became sleepy or by a slight touch of a brush or hands. Only rats with less than 10% of sleep during SD were taken for final analysis. Animals in the diurnal control groups (see Experiments 2 and 3) were also gently handled (touched with brush or hands) for 3–5min during episodes of spontaneous wakefulness. In this way the possibility that SD-induced changes were evoked by sensory stimulation associated with the gentle handling procedure rather than prolongation of wakefulness was minimized.
Experimental paradigm
Five experiments were performed. In Experiment 1 EEG/EMG recording was accompanied by microdialysis sample collection; in other experiments only EEG/EMG recording was performed.
Experiment 1
Microdialysis measurements of adenosine and NOx during 11h SD (n=6)
Samples were collected simultaneously from BF, FC and CC. This experiment was performed in 2 days. On Day 1 spontaneous sleep-wake cycle recording, accompanied by microdialysis sample collection, was conducted between 7:00AM–7:00PM to confirm that the diurnal adenosine and NOx levels did not fluctuate significantly during the experimental period (data not shown). On Day 2 11h SD was performed between 8:00AM – 7:00PM. Both days, EEG/EMG was continuously recorded between 7:00AM–7:00AM. Microdialysis samples were collected within 1h of pre-deprivation baseline (7:00AM–8:00AM), during the 11h SD and the 2h of recovery sleep (7:00PM–9:00PM). We used the pre-deprivation hour levels of adenosine and NOx as baseline for comparison with later measures, as previously done for these compounds (Porkka-Heiskanen et al., 1997; Porkka-Heiskanen et al., 2000; Kalinchuk et al., 2006a,b). Our pilot in vitro experiments and previous studies (Porkka-Heiskanen et al., 2000) showed that recovery of CMA microdialysis probe may decrease by 1–3% after each day of use (for details of in vitro recovery measurements see manufacturer’s application notes). Thus, in the case of adenosine and NOx, we did not compare SD with the corresponding time of day (diurnal) levels in baseline samples because of the possible difference in probe recovery during different days
Experiment 2
Measurements of iNOS mRNA (n=90)
Sleep deprived rats were sacrificed at the end of SD of 5 different durations (1h SD, 3h SD, 5h SD, 6h SD, 11h SD, n=9/group). Non-deprived diurnal controls, sacrificed at the end of respective SD, were used for comparison (n=9/group). Brain tissue samples were collected for analysis using RT-PCR.
Experiment 3
Measurements of iNOS protein after SD (n=48)
Sleep deprived rats were sacrificed at the end of SD of 5 different durations (1h SD, 3h SD, 5h SD, 6h SD, 11h SD, n=4/group). An additional group (n=4) was sacrificed after 2h of recovery sleep after 11h SD. Continuous EEG/EMG recording was performed to monitor the effectiveness of SD. Non-sleep deprived rats sacrificed at the same diurnal times served as diurnal controls (n=4/group). Specific brain regions (BF, FC, CC) were carefully dissected and flash frozen for iNOS protein analysis using Western blot.
Experiment 4
Immunolabeling of iNOS+ cells in the BF and cortex after SD (n=12)
Sleep deprived rats were transcardially perfused at the end of 3h or 6h SD (n=4/group). Non-sleep deprived rats (n=4) were perfused at the same diurnal time as 6h SD to serve as sleeping control. Brains were collected and used for immunostaining.
Experiment 5
Measurements of EEG delta power (0.45–4.5Hz) during 2h of recovery sleep after each SD duration of 3h, 6h and 11h (n=18)
The experiment was performed over 2 days. Day 1 was always spontaneous (baseline) sleep-wake cycle recording performed between 7:00AM–7:00AM. SD of different durations (3h, 6h and 11h) was performed on Day 2 in 3 different groups of rats starting at 8:00AM; EEG/EMG recording was continued until 7:00AM. We compared EEG delta power within the first 2h of recovery sleep and the corresponding time bin of the baseline day.
EEG recording and analysis
Polygraphic recordings were performed using the Grass 15LT physiodata amplifier system. Signal was captured by Gamma (version 4.2) acquisition software (Grass-Telefactor) at the sampling rate of 256Hz. EEG recordings was visually scored at 10-sec epochs using rodent sleep stager software (RSS version 3; Grass-Telefactor) according to previously described criteria (Kalinchuk et al., 2006a,b). In Experiments 1–4 recordings were performed to monitor the quality of SD. In Experiment 5, recordings were performed to analyze the increase in EEG delta power (0.45–4.5Hz) during NREM recovery sleep after SD. Recordings were divided into 2 h bins; the amount of slow-wave EEG power in delta range during NREM episodes in the first 2 h after SD was compared with the corresponding time bin on the spontaneous sleep-wake (baseline) day (BL,=100%) and the percentage difference was calculated.
Microdialysis experiments
Dialysates were simultaneously collected from 3 brain areas – the BF, FC and CC (Fig. 1). At least 16h prior to the beginning of experiment, 3 microdialysis probes (CMA7, 2mm membrane length, 0.24 mm diameter; CMA/Microdialysis, Stockholm, Sweden) were inserted through the implanted guide cannulae. During experiments, the flow rate for artificial cerebrospinal fluid (aCSF, Harvard Apparatus, Holliston, MA) was set at 1.0 μl/min for the probe inlet and outlet tubing (FEP tubing; CMA/Microdialysis). Samples were collected every 30 min from the outlet tubing after it exited the cage.
Adenosine measurements using HPLC
As previously described (Porkka-Heiskanen et al., 1997; Kalinchuk et al., 2003), 10μl microdialysis samples were analyzed with a microbore high performance liquid chromatography (HPLC) system coupled to a Shimadzu UV detector (detection wavelength = 258 nm). The detection limit for the assay was 0.8nM. The comparison was performed between the concentration in samples collected during pre-deprivation baseline (BL, values from two 30-min samples were averaged, =100%), each hour of SD and 2nd hour of recovery sleep.
Nitrate/nitrite measurements
As no endogenous source other than NO is known for NO2− and NO3− (collectively NOx) this metabolite has generally been taken as indicative of NO production (Mackenzie et al. 1996). NOx concentrations were measured using a Nitrate/Nitrite Fluorometric Assay kit (Cayman Chemical Company, Ann Arbor, MI, USA) according to the manufacturer’s instructions. The detection limit of the assay was 0.06 μM in the final reaction mixture. The results were calculated as NOx. Concentrations of the samples collected during SD and recovery sleep were normalized to the mean concentration of samples collected during the pre-deprivation baseline (BL, 2 values were averaged, = 100%).
Tissue collection for Western blot and RT-PCR
Sleep deprived rats and their time-matched controls were sacrificed at the end of each of the 5 SD durations and 2h of recovery sleep after 11h SD (for protein measurements). Brain tissue samples (volume ~2mm/2mm/1mm) were collected from the same brain regions where microdialysis measurements of adenosine and NOx were made: BF (HDB/SI/MCPO), FC and CC (Fig. 1D, E&F).
Measurement of iNOS mRNA by RT-PCR
The RNA extracted using TRIZOL extraction buffer (Invitrogen Corporation, Carlsbad, CA) was reverse transcribed using random hexamer and superscript II (Invitrogen Corporation, Carlsbad, CA). Real time RT-PCR (in duplicates) was performed using Pre-made TaqMan Gene expression primer/probe for iNOS gene (RN 00561646_m1; Applied Biosystem Inc, Foster City, CA). Ribosomal 18SRNA (Applied Biosystem Inc, Foster City, CA) was used as the internal control to normalize the levels of mRNA of the target gene. The difference in the levels of mRNA expression was calculated using the comparative 2−ΔΔCT method (Livak and Schmittgen, 2001). Comparisons were made between values in SD groups and time-matched control samples (BL, =100%) and expressed in percentages.
Measurement of iNOS protein by Western blot
iNOS protein levels were measured as described previously (Kalinchuk et al., 2006b; Rytkonen et al., 2008; see Supplemental Materials for details). The protein expression levels were determined by calculating the difference in densitometric values between SD and time-matched control samples (BL,=100%) and expressed in percentages.
Immunohistochemistry and cell counting
At the end of experiments animals designated for immunohistochemistry were transcardially perfused with 4% formaldehyde. Brains were removed from the skull and further processed as described in (Kalinchuk et al., 2010) (see Supplemental Materials for details).
Fos+ cells were identified by the presence of a black nucleus, and iNOS+ cells were defined by the presence of brown cytoplasm. For counting iNOS+ cells, images were collected at 20× using a light microscope. In total, the following images were used for counting: for the BF area, images of 5 sections per rat (4 rats/group, AP levels +0.48; +0.2; −0.26; −0.4; −0.8; Paxinos and Watson, 1998) and for the FC – images of 2 sections per rat (AP levels +5.20 and +4.70).
Histological verification of microdialysis probe tips location
At the conclusion of the experiments rats were euthanized with CO2, the brains were removed and frozen. Brain sections (40μ) were cut and histology was performed to locate the microdialysis probe tips in all three brain regions.
Statistics
Data are shown as mean ± SEM. Experiment 1. First the overall significance of SD on levels of adenosine and NOx was assessed using the non-parametric Friedman Repeated Measures Analysis of Variance on Ranks (Friedman RMANOVA, SigmaStat, SPSS Inc., Chicago, IL). Then, in planned comparisons, the significance of changes between baseline and successive hours of SD was addressed using the Mann-Whitney Rank Sum Test (Mann-Whitney RST). As additional information, post-hoc Mann-Whitney comparisons were done between selected bins; their significance levels would not have survived Bonferroni corrections. In Experiment 2, statistical significance was calculated by t-test using the ΔΔCT values of individual samples for each group. In Experiments 3, 4 and 5, the effect of different durations of SD on iNOS protein level, number of iNOS+ cells or recovery sleep delta power was first assessed by Kruskall-Wallis One Way ANOVA on Ranks (Kruskall-Wallis ANOVA) and the follow-up significance between individual groups was evaluated using Mann-Whitney RST. In Experiment 5, the correlation between recovery sleep delta power and the adenosine levels was evaluated using Pearson Product Moment correlation.
RESULTS
1. Changes in adenosine level in the course of 11h SD (Experiment 1)
In the BF, the baseline level of adenosine in microdialysis samples, collected during the pre-deprivation period (BL=100%), was 2.3±0.7nmol/l, which is comparable to previously published data (Kalinchuk et al., 2006a). There was an overall statistically significant increase in adenosine level during SD and recovery sleep (Friedman RMANOVA, chi-square=41.868(12), P<0.001). As shown in Fig. 2A, adenosine levels gradually increased within the first 6h of SD and remained elevated up to the end of 11h SD. Planned pair-wise comparisons revealed that the first significant increase was observed after 2h SD (by 99±36%, Mann-Whitney RST, T=21.000(6), p=0.002). After 3h SD adenosine increased by 158±34% (T=21.000(6), p=0.002), after 6h – by 308±43% (T=21.000(6), p=0.002) and after 11h – by 315±115% (T=21.000(6), p=0.002). Post-hoc tests showed a statistically significant difference between hours 3 and 6 (T=24.000(6), p=0.015), but there was no difference between hours 6 and 11 (T=42.000(6), p=0.699) (Fig. 2A). During recovery sleep the adenosine level showed a decline as compared to SD, however, it was higher than baseline by 153±36% (T=21.000(6), p=0.002).
Figure 2. Changes in adenosine levels in the course of 11h SD in the BF (A) and FC (B).

BL (baseline, 100%) = adenosine level in pre-deprivation samples (average of 2 samples). (A). Increase in the BF becomes significant relative to baseline after 2h of SD, continues increasing through 6h SD and remains elevated until recovery sleep (RS) is allowed. (B) A significant increase in the FC relative to baseline begins after 6h SD, levels continue increasing until 8h, and then remain elevated until RS. * = p < 0.05, difference vs. BL.
In the FC, the baseline level of adenosine was 6.0±2nmol/l. As shown in Fig. 2B, there was an overall increase in adenosine level during SD and recovery sleep (Friedman RMANOVA, chi-square=44.608(12), P<0.001). However, planned pair-wise comparisons revealed no change in adenosine levels between pre-deprivation baseline and hours 1–5 (Mann-Whitney RST, all T»27.000(6), p»0.065). The adenosine level was gradually increasing at 6h (by 58±20%, T=21.000(6), p=0.002), 7h (by 99±12%, T=21.000(6), p=0.002) and remained elevated relative to baseline at hours 8–11 (T=21.000(6), p=0.002). After 11h it was increased by 285±16% (T=21.000(6), p=0.002). Post-hoc evaluations showed a statistically significant difference between hours 6 and 11 (T=22.000(6), p=0.004). After 2h of recovery sleep, adenosine was non-significantly higher than baseline by 65±24% (T=27.000(6), p=0.065).
In the CC, no significant increase in adenosine levels were observed during SD (Friedman RMANOVA, chi-square=6.344(12), P=0.898, data not shown).
2. Changes in NOx level in the course of 11h SD (Experiment 1)
In the BF, there was an overall statistically significant increase in the NOx level during SD and recovery sleep as compared to pre-deprivation baseline (BL,=100%) (Fig. 3A) (Friedman RMANOVA, chi-square=19.135(7), P=0.008). NOx levels gradually increased during the first 3h of SD, and remained elevated between 3h–11h SD. Planned pair-wise comparisons revealed that the first significant increase was observed after 1h SD (68±31%, T=21.000(6), p=0.002). After 3h SD it increased by 178±51% (T=21.000(6), p=0.002), after 5h – by 213±63% (T=21.000(6), p=0.002), after 6h by 160±62% (T=21.000(6), p=0.002) and after 11h – by 194±37% (T=21.000(6), p=0.002). Post-hoc evaluations showed was no statistically significant difference between hours 3 and 6 (T=40.000(6), p=0.937) or hours 6 and 11 (T=40.000(6), p=0.937). After 2h recovery sleep, NOx level still was increased by 47±44%, but this difference was not significant (T=33.000(6), p=0.349).
Figure 3. Changes in NOx levels in the course of 11h SD in the BF (A) and FC (B).

BL (baseline, 100%) = NOx level in pre-deprivation samples (average of 2 samples). (A) Increase in the BF is significant after 1h of SD, reaches a maximal value at 3h SD, and remains elevated. The values at 5h, 6h and 11h are statistically different from BL and not statistically different from 3h value. (B) Increase in the FC becomes statistically significant only after 5h SD. *, p=<0.05, difference vs. BL.
In the FC, there was an overall increase in NOx level during SD and recovery sleep (Fig. 3B) (Friedman RMANOVA, chi-square=15.898(7), P=0.026). However, planned pair-wise comparisons revealed no change in NOx levels between pre-deprivation baseline and hours 1–4 (Mann-Whitney RST, all T»33.000(6), all p»0.394). NOx level was increased at 5h by 140±30%, T=21.000(6), p=0.002) and remained elevated between hours 6 (increase by 179±58%, T=21.000(6), p=0.002) and 11 (increase by 150±54%, T=21.000(6), p=0.002). After 2h of recovery sleep, it was still increased by 42±40%, T=33.000(6), p=0.349).
In the CC, no significant increases in NOx level were observed during SD (data not shown).
3. Changes in iNOS mRNA during SD of varying durations (Experiment 2)
Measurements of iNOS mRNA level at different time points in control group showed that there was no statistically significant diurnal variation in the level of iNOS mRNA across 12h in any of the brain regions (data not shown).
In the BF, increase in iNOS mRNA level was detected as early as after first 1h of SD (by 82±58%, t-test, t =2.307(16), p=0.035). It was further increased after 3h (by 114±26%, t=2.172(16), p=0.043) and reached a plateau between hours 5, 6 and 11 (all increases » 119%, all t»2.193(16), all p«0.042) (Fig. 4A).
Figure 4. Time course of changes in iNOS mRNA in the BF (A) and FC (B).

BL (baseline, 100%) = iNOS mRNA level in non-SD diurnal control samples. (A) In the BF, levels of iNOS mRNA significantly and progressively increase after 1h and 3h of SD, and remain elevated through the 11h of SD. (B) In the FC iNOS mRNA significantly increases only after 5h SD. *, p=<0.05, difference vs. BL.
In FC, there was no significant change in iNOS mRNA in samples collected after SD for 1h (decrease by 7±18%, t=0.306(16), p=0.763) and 3h (decrease by 20±22%, t=0.657(16), p=0.520). The first significant increase was detected after 5h (by 87±43%, t=2.223(16), p=0.040). Continued SD for 6h or 11h did not induce further increases (all increases »82%, all t»2.327(16), all p«0.033) (Fig. 4B).
In CC, no significant changes in iNOS mRNA level were detected (data not shown).
4. Changes in iNOS protein during SD and recovery sleep (Experiment 3)
Since no change in iNOS mRNA level was detected in CC, iNOS protein in this area was not measured. There was no statistically significant diurnal variation in the level of iNOS protein across 12h in any of the brain regions studied (data not shown).
In the BF, there was an overall increase in the level of iNOS protein during SD and recovery sleep (Fig. 5A) (Kruskal-Wallis ANOVA, H=16.741, P=0.010). The first significant increase was detected after 1h SD (by 89±36%, Mann-Whitney RST, T=10.000(4), p=0.029). It further increased after 3h (by 169±33%, T=10.000(4), p=0.029) and plateaued between hours 5, 6 and 11 (all increases »185%, all T=10.000(4), p=0.029). After 2h of recovery sleep, iNOS protein level was insignificantly increased by 30±14% (T=14.000(4), p=0.343).
Figure 5. Time course of changes in iNOS protein in the BF(A) and FC (B).

BL (baseline, 100%) = iNOS protein level in non-SD diurnal control samples. (A) In the BF the level of iNOS protein significantly increases after 1h and 3h SD, and remains elevated until recovery sleep (RS) was allowed. (B) In the FC, iNOS protein became significantly increased at 5h SD, later than in BF. *, p=<0.05, difference vs. BL.
In the FC, there was an overall increase in the level of iNOS protein during SD and recovery sleep (Fig. 5B) (Kruskal-Wallis ANOVA, H=17.811, P=0.007). However, there was no significant change in iNOS protein after SD for 1h and 3h (all increases «28%, Mann-Whitney RST, T=14.000(4), p=0.343). The first increase was detected 5h after the beginning of SD (67±15%, T=10.000(4), p=0.029). Continuation of SD for 6h induced a further increase (213±14%, T=10.000(4), p=0.029), which was stable at plateau level within 6h–11h SD (increase by 161±39%, T=10.000(4), p=0.029) (Fig. 5B). After 2h of recovery sleep, iNOS protein level was insignificantly increased by 28±14% (T=14.000(4), p=0.343).
5. iNOS is induced in wake-active cells in the FC (Experiment 4)
We used immunohistochemistry to detect iNOS+ cells in the BF, FC and CC after 3h and 6h SD. We found that iNOS+ cells were present in the BF both after 3h and 6h SD, but were almost not detectable in control (Fig. 6F, I & L). The number of iNOS+ cells in the BF was significantly increased between control (34±7%) and 3h SD (139±8%) (Kruskal-Wallis ANOVA, H=9.846, P=0.001, post-hoc Mann-Whitney RST, T=26.000(4), p=0.029), and control and 6h SD (245±7%) (T=10.000(4), p=0.029). Also there was a significant difference between numbers of iNOS+ cells after 3h and 6h SD (T=26.000(4), p=0.029) (Fig. 7). In the FC iNOS+ cells were detected only after 6h SD (Fig. 6D, G & J; Fig. 7), and were not detected in the CC even after 6h SD (Fig. 6E, H & K).
Figure 6. Immunolabeling of iNOS+ and Fos+ cells in the BF and cortex in control animals and animals after 3h and 6h SD.

(A,B,C) Areas in the FC (A), CC (B) and the BF (C) which are shown in photomicrographs are indicated by squares. (D,E,F) In controls, iNOS+ cells were absent in any of areas studied. Only rare Fos+ cells could be identified. (G, H, I) After 3h SD, iNOS+ cells were absent in the FC (G) and CC (H), but were present in the BF (I). In the BF they were co-localized with Fos+ staining. (J, K, L) After 6h SD, iNOS+ cells were detected both in the FC (J) and the BF (L) but not the CC (K). In the FC iNOS+ staining was also co-localized with Fos+ staining.
Figure 7. The numbers of iNOS+ cells in the BF and FC in control and after 3h and 6h SD.
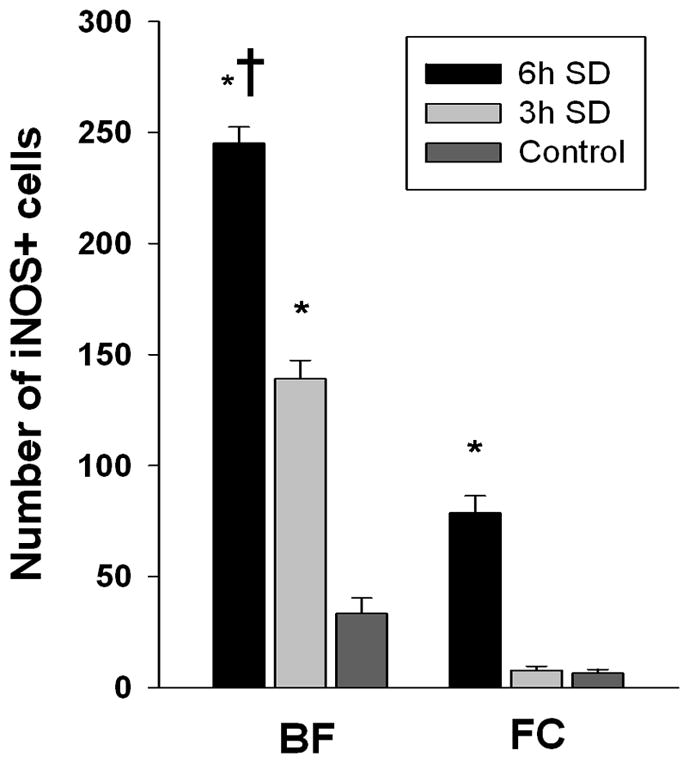
*, p=<0.05, difference vs. BL; †, p=<0.05, difference vs. SD of shorter duration.
In our previous study, we showed that in the BF iNOS is induced in wake-active neurons (Kalinchuk et al., 2010). In order to understand whether of iNOS induction in the FC correlates with neuronal activation, we performed double-labeling with Fos antibody. We found that, similar to the BF (Fig. 6I & L), in the FC the majority of iNOS+ cells were also Fos+ (Fig. 6J).
6. Changes in EEG delta power after SD of varying durations (Experiment 5)
Comparisons of EEG delta power during first 2h of recovery after 3h, 6h and 11hSD to corresponding time bins of baseline day (BL, =100%) revealed a progressive and statistically significant increase in delta power with increasing of SD duration (Kruskal-Wallis ANOVA, H=20.533, P<0.001) (Fig. 8A). After 3h of SD, delta power was increased by 61±10% (Mann-Whitney RST, T=21.000(6), p=0.002) and this increase was doubled after 6h (122±18%, T=21.000(6), p=0.002). However, further prolongation of SD up to 11h only tripled the initial delta power increase (183±10%, T=21.000(6), p=0.002). There was a statistically significant difference between 3 and 6h SD (T=25.000(6), p=0.026) and 6 and 11h SD (T=23.000(6), p=0.009).
Figure 8. Correlation of NREM EEG delta power (0.45–4.5Hz) and adenosine increase.

(A) Increase in NREM EEG delta power over baseline (BL,=0) within first 2h of recovery sleep. Delta power increases progressively following 3h, 6h and 11h SD. (B) Sum of adenosine increase in the BF and FC over baseline (BL,=0). Combining the AD levels measured in BF and FC reveals a progressive increase following 3h, 6h and 11h SD and matches the pattern of delta power increase. (C) The strong positive correlation between EEG delta power and BF + FC adenosine increase after 3h, 6h and 11h SD. *, p=<0.05, difference vs. BL; †, p=<0.05, difference vs. SD of shorter duration.
7. Correlation between delta power and adenosine release
The preceding time course data indicated an initial increase in BF and then an increase in FC adenosine. Our hypothesis is of a major role of adenosine concentration in increasing sleep need, and we tested this hypothesis using delta power as a proxy for indexing sleep need (Borbely, 1982). Accordingly, we correlated the increase in adenosine from its baseline to the level after 3h SD, after 6h SD and after 11h SD with the increase in NREM delta power over baseline within first 2h of recovery sleep after SDs of these durations. This was done for both BF and FC.
Although there was some positive correlation between recovery sleep delta power and the adenosine levels in each brain region, the correlations were not statistically significant (R=0.883; P=0.311 for BF and R=0.962; P=0.176 for FC, Pearson Product Moment correlation). Then, based on our hypothesis of a cascade of homeostatic responses, we calculated the combined percentage increase from both regions (BF+FC adenosine levels) after 3h, 6h and 11h SD for each rat (Fig. 8B). Averaging the values for 3h, 6h and 11h SD over the N=6 rats showed an overall increase in adenosine level (Kruskal-Wallis ANOVA, H=19.984, P<0.001). After 3h SD BF+FC adenosine was increased by 163±29% as compared with BL (Mann-Whitney RST, T=21.000(6), p=0.002), after 6h SD adenosine increased by 366±48%, (T=21.000(6), p=0.002) and after 11h SD, adenosine increased by 536±91%, (T=21.000(6), p=0.002) There was a significant difference between hours 3 and 6 (T=21.000(6), p=0.002). Of note, the BF+FC sum of percentages of adenosine increase was positively and statistically significantly correlated with the increase in delta power (R=0.998, P=0.036) (Fig. 8C).
DISCUSSION
The data from this study support our hypothesis of a sleep homeostatic cascade and define the time course of adenosine, iNOS and NOx accumulation in BF, FC and CC during 11h SD. Simultaneous microdialysis sample collection revealed that first the BF, and then the FC show sequential increases in NOx, followed by increases in extracellular adenosine. This BF before FC sequence was also found for iNOS. The BF adenosine/NOx increases began in the first hour of SD and were maximal at 6h SD. In the FC, first increase was showed at 5h and a maximum level was maintained from 6 to 11h SD. These data thus illustrate a cascade of effects, both in the order of homeostatic factor production-- first NO-related changes, then adenosine—and also in the brain region—first BF and then FC. To our knowledge, this is the first study that examined simultaneous changes in two major components of the homeostatic cascade in three rat brain regions. The data further indicated that the effects of adenosine in the BF and FC on homeostasis are additive. The sum of adenosine level increases in BF and FC showed a tight correlation with the increases in intensity of delta activity in recovery sleep allowed after 3, 6, and 12h SD. A much later component of the homeostatic cascade is the increased binding of the adenosine A1 receptor, beginning after 12h SD with statistically significant increases after 24h in BF and after 24h in humans in widespread cortical regions (Basheer et al., 2007; Elmenhorst et al., 2007; 2009). We thus think that sleep homeostasis involves progressively more brain mechanisms and regions as the sleep loss becomes more pronounced. This concept of sleep homeostasis puts sleep control into the same conceptual domain as many physiological systems, such as, for example, temperature and blood glucose control, where multiple systems contribute to regulation. This also is faithful to the original definition of Cannon, who, building on Bernard’s concept of a milieu interieur (Bernard, 1974), elaborated the concept of homeostasis in his work with Rosenblueth (Cannon and Rosenblueth, 1949). While our study has focused on the role of adenosine and NO-related factors, we do not intend to exclude the presence of other sleep homeostatic factors, which are discussed in Steriade and McCarley (2005).
We note that increases in BF adenosine up to 6h of total SD have been measured in rats and cats, but none have examined changes in the FC and CC, cortical regions that receive projections from BF and thus could potentially reflect BF-induced or simultaneous changes (Porkka-Heiskanen et al., 1997; 2000; Basheer et al., 1999; Kalinchuk et al., 2003; 2006a; McKenna et al., 2007; Blanco-Centurion et al., 2006). The only cortical study of adenosine measurements was performed in cat lateral gyrus; this showed increases that paralleled the BF increase, although to a lesser extent (Porkka-Heiskanen et al., 2000). In the current study, simultaneous sampling from BF and FC allowed us to establish the precise time course of changes in these brain regions.
Anatomical data clearly show that BF projects to FC; and our data are compatible with this projection since they show changes in NO and adenosine in FC that could arise, at least in part, from BF projections (Rye et al., 1984; Saper 1984; Woolf et al., 1986; Gaykema et al., 1990; Gritti et al., 2003; Henny and Jones, 2008). In rats characterization of pre- and post-synaptic constituents of the BF projections to the prefrontal cortex established the presence of dense projections to both medially located prelimbic cortex and lateral prefrontal cortex, locations of the microdialysis probes in the present study (Gaykema et al., 1990). A sleep-related decrease in the BF excitation of FC is in accord with the frontal increase in delta EEG power during sleep found in both rodents and humans (Huber et al., 2000; Douglas et al., 2002; Muzur et al., 2002), and with the observation of decreased metabolic rate in frontal cortex during sleep in humans (Nofzinger et al., 2002).
The absence of changes in CC is notable and also somewhat puzzling since CC also receives projections from BF (Henny and Jones, 2008). However, a rat study of kainate lesions of BF failed to show any effect on the multiple unit activity recorded from the CC (area 29) during wake, NREM sleep and REM sleep (Borst et al., 1987). This was in contrast to changes observed with kainate lesions of the medial septum, thus suggesting that the electrical activity of CC neurons is predominantly modulated by medial septum (Borst et al., 1987). It is also possible that the differences in FC and CC may be related to the functional differences, with FC involved in higher order cognition and attention and the CC involved in more limbic, emotional and motivational functions, as revealed by imaging studies in humans (Bush et al., 2002; Koo et al., 2008). The FC region studied by is usually considered homologous to primates’ dorsal prefrontal cortex (Douglas et al., 2001; Fuster, 2001; Van Dort et al., 2009), which plays an important role in cognition including control of attention and working memory (Gabrieli et al., 1998; Fletcher and Henson, 2001). Of note, these functions are impaired after SD both in rats and humans (Cordova et al., 2006; McCoy et al., 2007; Christie et al., 2008; Muzur et al., 2002; Sarter et al., 2003). In a 5-choice serial reaction time task in rodents, attentional impairment correlated with sleep pressure: short-term SD (4h) induced only small and insignificant increases in the latency of correct responses as compared to 7h and 10h SD (Cordova et al., 2006).
A widely accepted marker of the homeostatic sleep response is NREM EEG delta activity (0.5–4.5 Hz) during recovery sleep that follows periods of wakefulness (Tobler and Borbey, 1986). Our data strongly suggest that, with longer-term SD, adenosine’s action on both BF and FC jointly contribute to homeostatic sleep pressure, since the sum of adenosine levels from these two regions closely correlates with the progressive increase in recovery sleep intensity, as measured by NREM delta activity. There is ample evidence for the mechanisms by which BF adenosine acting via the A1R facilitates delta activity. In the BF adenosine postsynaptically inhibits cholinergic neurons by activating IKir current and non-cholinergic neurons by a reduction of the Ih current (Arrigoni et al., 2006). It is suggested that adenosine can promote delta activity during recovery sleep via reduction of the cholinergic tone which inhibits burst-pause firing patterns (McCormick et al., 1993) by acting at cholinergic nuclei in the BF and thus reducing cholinergic input to the cortex and thalamus (Rainnie et. al., 1994; Arrigoni et al., 2006) or directly by inhibiting cortical acetylcholine release at the terminal fields of thalamocortical cells (Materi et al., 2000). Recently, it has been shown that A1R-mediated inhibition of acetylcholine release in FC (prefrontal cortex, an area similar to our current study) decreases wakefulness and promotes slow EEG activity (Van Dort et al., 2009), the effects similar to those described for the BF (Basheer et al., 2004; McCarley, 2007).
There are several lines of evidence indicating the role for NO in the induction of sleep (Kapas et al., 1994a,b; Dzoljic and De Vries, 1994; Kapas and Krueger, 1996; Monti et al., 1999; Monti, Jantos, 2004). Several studies confirmed the role of neuronal NOS (nNOS), the constitutively expressed isoform of NOS in the brain, in the regulation of spontaneous sleep-waking cycle (Dzoljic et al., 1996; Dzoljic et al., 1997; Williams et al., 1997; Burlet et al., 1999). In contrast to that, we found that SD-induced NO and recovery sleep after SD are dependent on the activity of iNOS (Kalinchuk et al., 2006b; Kalinchuk et al., 2010). Our previous study demonstrated a close and sequential link between SD-induced iNOS/NO and extracellular adenosine in the BF, thus providing evidence in support of NO’s role in the adenosinergic homeostatic cascade (Kalinchuk et al., 2006a,b). We showed previously that inhibition of iNOS activity lead to the attenuation of both recovery sleep and adenosine release during SD (Kalinchuk et al., 2006b). The current study confirms the temporal relationship between NO and adenosine in BF and FC. Importantly, we showed that SD-induced iNOS expression is regulated at the transcriptional level, and is associated with increases in both iNOS mRNA and protein. Transcriptional induction of iNOS mRNA after SD occurs very quickly, within the first hour of SD. The majority of the literature describes iNOS induction in the brain as a slower process and it is assumed that its induction might need a lag period of 2–6h (Lowenstein and Padalko, 2006), however similar rapid induction of iNOS mRNA was also reported, for example, in brain hypoxia (Udayabanu et al., 2008) or a model of Alzheimer’s disease (Medeiros et al., 2007). In contrast to pathological conditions, triggering of iNOS induction in the BF and FC in response to sleep loss is suggestive of a neuroprotective mechanism, through which adenosine release prevents over-activation and related neuronal damage. It is still unknown how NO stimulates adenosine release: the pathways might include the inhibition of adenosine kinase, the enzyme which converts adenosine to AMP (Rosenberg et al., 2000) or increasing ATP hydrolysis (Brorson et al., 1998). Data indicate that cholinergic neurons in the BF are especially sensitive to NO (McKinney and Jacksonville, 2005), thus they might be the first to sense the changes in NO level during SD and respond to it by adenosine release. Alternatively, adenosine might be released from astrocytes (Halassa et al., 2009).
Finally, we note that the literature has suggested many potential sleep factors, of which NO and adenosine have been the topic of the present paper (see review in Steriade and McCarley, 2005). In relation to other sleep factors, we note that tissue damage from microelectrode probes and consequent cytokine release, other tissue damage factors, or altered blood flow are unlikely to play a role in the present findings since probes were inserted at least 16h before microdialysis collection began and each brain region did not show a NO and adenosine response during the 24h of spontaneous sleep preceding SD.
In summary, the data presented in this report show a progressive homeostatic cascade for sleep. The cascade occurs both in the order of homeostatic factor production-- first NO-related changes, then adenosine—and also in the brain region first—BF and then FC. This concept of sleep homeostasis puts sleep control into the same conceptual domain as many physiological systems, such as, for example, temperature and blood glucose control, where multiple systems are recruited for regulation according to the severity of disturbance.
Supplementary Material
Acknowledgments
This work was supported by the Department of Veterans Affairs Medical Research Service Award to RB, SRSF Christian Gillin Research Award to AVK, the National Institute of Mental Health Grant (NIMH39683) to RWM and Academy of Finland. We thank Drs. Ritchie E. Brown, James T. McKenna and Robert E. Strecker for stimulating discussions, Farzana Pervin Nipa, Pirjo Saarelainen, Sari Leevo-Siitari and Ernst Mecke for excellent technical assistance, Peter Hirsch, Diane Ghera and Dewayne Williams for providing animal care.
REFERENCE LIST
- Aktan F. iNOS-mediated nitric oxide production and its regulation. Life Sci. 2004;75:639–653. doi: 10.1016/j.lfs.2003.10.042. [DOI] [PubMed] [Google Scholar]
- Arrigoni E, Chamberlin NL, Saper CB, McCarley RW. Adenosine inhibits basal forebrain cholinergic and noncholinergic neurons in vitro. Neurosci. 2006;140:403–413. doi: 10.1016/j.neuroscience.2006.02.010. [DOI] [PubMed] [Google Scholar]
- Basheer R, Porkka-Heiskanen T, Stenberg D, McCarley RW. Adenosine and behavioral state control: adenosine increases c-Fos protein and AP1 binding in basal forebrain of rats. Brain Res Mol Brain Res. 1999;73:1–10. doi: 10.1016/s0169-328x(99)00219-3. [DOI] [PubMed] [Google Scholar]
- Basheer R, Halldner L, Alanko L, McCarley RW, Fredholm BB, Porkka-Heiskanen T. Opposite changes in adenosine A1 and A2A receptor mRNA in the rat following sleep deprivation. Neuroreport. 2001;12:1577–1580. doi: 10.1097/00001756-200106130-00013. [DOI] [PubMed] [Google Scholar]
- Basheer R, Arrigoni E, Thatte HS, Greene RW, Ambudkar IS, McCarley RW. Adenosine induces inositol 1,4,5-trisphosphate receptor-mediated mobilization of intracellular calcium stores in basal forebrain cholinergic neurons. J Neurosci. 2002;22:7680–7686. doi: 10.1523/JNEUROSCI.22-17-07680.2002. [DOI] [PMC free article] [PubMed] [Google Scholar]
- Basheer R, Strecker RE, Thakkar MM, McCarley RW. Adenosine and sleep-wake regulation. Prog Neurobiol. 2004;73:379–396. doi: 10.1016/j.pneurobio.2004.06.004. [DOI] [PubMed] [Google Scholar]
- Basheer R, Bauer A, Elmenhorst D, Ramesh V, McCarley RW. Sleep deprivation upregulates A1 adenosine receptors in the rat basal forebrain. Neuroreport. 2007;18:1895–1899. doi: 10.1097/WNR.0b013e3282f262f6. [DOI] [PubMed] [Google Scholar]
- Bernard C. Lectures on the Phenomena of Life Common to Animals and Plants. Charles C. Thomas Pub Ltd; Springfield: 1974. [Google Scholar]
- Blanco-Centurion C, Xu M, Murillo-Rodriguez E, Gerashchenko D, Shiromani AM, Shiromani PJ. Adenosine and sleep homeostasis in the basal forebrain. J Neurosci. 2006;26:8092–8100. doi: 10.1523/JNEUROSCI.2181-06.2006. [DOI] [PMC free article] [PubMed] [Google Scholar]
- Borbely AA. A two process model of sleep regulation. Hum Neurobiol. 1982;1:195–204. [PubMed] [Google Scholar]
- Borst JG, Leung LW, MacFabe DF. Electrical activity of the cingulate cortex. II. Cholinergic modulation. Brain Res. 1987;407:81–93. doi: 10.1016/0006-8993(87)91221-2. [DOI] [PubMed] [Google Scholar]
- Brorson JR, Schumacker PT, Zhang H. Nitric oxide acutely inhibits neuronal energy production. The Committees on Neurobiology and Cell Physiology. J Neurosci. 1998;19:147–158. doi: 10.1523/JNEUROSCI.19-01-00147.1999. [DOI] [PMC free article] [PubMed] [Google Scholar]
- Burlet S, Leger L, Cespuglio R. Nitric oxide and sleep in the rat: a puzzling relationship. Neurosci. 1999;92:627–639. doi: 10.1016/s0306-4522(99)00031-7. [DOI] [PubMed] [Google Scholar]
- Bush G, Vogt BA, Holmes J, Dale AM, Greve D, Jenike MA, Rosen BR. Dorsal anterior cingulate cortex: a role in reward-based decision making. Proc Natl Acad Sci USA. 2002;99:523–528. doi: 10.1073/pnas.012470999. [DOI] [PMC free article] [PubMed] [Google Scholar]
- Calabrese V, Mancuso C, Calvani M, Rizzarelli E, Butterfield DA, Stella AM. Nitric oxide in the central nervous system: neuroprotection versus neurotoxicity. Nat Rev Neurosci. 2007;8:766–775. doi: 10.1038/nrn2214. [DOI] [PubMed] [Google Scholar]
- Cannon WB, Rosenblueth A. The supersensitivity of denervated structures: a law of denervation. Macmillan; New York: 1949. [Google Scholar]
- Christie MA, Bolortuya Y, Chen LC, McKenna JT, McCarley RW, Strecker RE. Microdialysis elevation of adenosine in the basal forebrain produces vigilance impairments in the rat psychomotor vigilance task. Sleep. 2008;31:1393–1398. [PMC free article] [PubMed] [Google Scholar]
- Córdova CA, Said BO, McCarley RW, Baxter MG, Chiba AA, Strecker RE. Sleep deprivation in rats produces attentional impairments on a 5-choice serial reaction time task. Sleep. 2006;29:69–76. [PMC free article] [PubMed] [Google Scholar]
- Douglas CL, Baghdoyan HA, Lydic R. M2 muscarinic autoreceptors modulate acetylcholine release in prefrontal cortex of C57BL/6J mouse. J Pharmacol Exp Ther. 2001;299:960–966. [PubMed] [Google Scholar]
- Douglas CL, Baghdoyan HA, Lydic R. Postsynaptic muscarinic M1 receptors activate prefrontal cortical EEG of C57BL/6J mouse. J Neurophysiol. 2002;88:3003–3009. doi: 10.1152/jn.00318.2002. [DOI] [PubMed] [Google Scholar]
- Dzoljic MR, De Vries R. Nitric oxide synthase inhibition reduces wakefulness. Neuropharmacology. 1994;33:1505–1509. doi: 10.1016/0028-3908(94)90055-8. [DOI] [PubMed] [Google Scholar]
- Dzoljic MR, De Vries R, van Leeuwen R. Sleep and nitric oxide: effects of 7-nitro indazole, inhibitor of brain nitric oxide synthase. Brain Res. 1996;718:145–150. doi: 10.1016/0006-8993(96)00102-3. [DOI] [PubMed] [Google Scholar]
- Dzoljic E, van Leeuwen R, De Vries R, Dzoljic MR. Vigilance and EEG power in rats: effects of potent inhibitors of the neuronal nitric oxide synthase. Naunyn Schmiedebergs Arch Pharmacol. 1997;356:56–61. doi: 10.1007/pl00005028. [DOI] [PubMed] [Google Scholar]
- Elmenhorst D, Meyer PT, Winz OH, Matusch A, Ermert J, Coenen HH, Basheer R, Haas HL, Zilles K, Bauer A. Sleep deprivation increases A1 adenosine receptor binding in the human brain: a positron emission tomography study. J Neurosci. 2007;27:2410–2415. doi: 10.1523/JNEUROSCI.5066-06.2007. [DOI] [PMC free article] [PubMed] [Google Scholar]
- Elmenhorst D, Basheer R, McCarley RW, Bauer A. Sleep deprivation increases A(1) adenosine receptor density in the rat brain. Brain Res. 2009;1258:53–58. doi: 10.1016/j.brainres.2008.12.056. [DOI] [PMC free article] [PubMed] [Google Scholar]
- Fletcher PC, Henson RN. Frontal lobes and human memory: insights from functional neuroimaging. Brain. 2001;124(Pt 5):849–881. doi: 10.1093/brain/124.5.849. [DOI] [PubMed] [Google Scholar]
- Franken P, Dijk DJ, Tobler I, Borbely AA. Sleep deprivation in rats: effects on EEG power spectra, vigilance states, and cortical temperature. Am J Physiol. 1991;261:R198–208. doi: 10.1152/ajpregu.1991.261.1.R198. [DOI] [PubMed] [Google Scholar]
- Fuster JM. The prefrontal cortex--an update: time is of the essence. Neuron. 2001;30:319–333. doi: 10.1016/s0896-6273(01)00285-9. [DOI] [PubMed] [Google Scholar]
- Gabrieli JD, Poldrack RA, Desmond JE. The role of left prefrontal cortex in language and memory. Proc Natl Acad Sci USA. 1998;95:906–913. doi: 10.1073/pnas.95.3.906. [DOI] [PMC free article] [PubMed] [Google Scholar]
- Gaykema RP, Luiten PG, Nyakas C, Traber J. Cortical projection patterns of the medial septum-diagonal band complex. J Comp Neurol. 1990;293:103–124. doi: 10.1002/cne.902930109. [DOI] [PubMed] [Google Scholar]
- Gaykema RP, Gaal G, Traber J, Hersh LB, Luiten PG. The basal forebrain cholinergic system: efferent and afferent connectivity and long-term effects of lesions. Acta Psychiatr Scand Suppl. 1991;366:14–26. doi: 10.1111/j.1600-0447.1991.tb03105.x. [DOI] [PubMed] [Google Scholar]
- Gritti I, Manns ID, Mainville L, Jones BE. Parvalbumin, calbindin, or calretinin in cortically projecting and GABAergic, cholinergic, or glutamatergic basal forebrain neurons of the rat. J Comp Neurol. 2003;458:11–31. doi: 10.1002/cne.10505. [DOI] [PubMed] [Google Scholar]
- Halassa MM, Florian C, Fellin T, Munoz JR, Lee SY, Abel T, Haydon PG, Frank MG. Astrocytic modulation of sleep homeostasis and cognitive consequences of sleep loss. Neuron. 2009;61:213–219. doi: 10.1016/j.neuron.2008.11.024. [DOI] [PMC free article] [PubMed] [Google Scholar]
- Henny P, Jones BE. Projections from basal forebrain to prefrontal cortex comprise cholinergic, GABAergic and glutamatergic inputs to pyramidal cells or interneurons. Eur J Neurosci. 2008;27:654–670. doi: 10.1111/j.1460-9568.2008.06029.x. [DOI] [PMC free article] [PubMed] [Google Scholar]
- Huber R, Deboer T, Tobler I. Topography of EEG dynamics after sleep deprivation in mice. J Neurophysiol. 2000;84:1888–1893. doi: 10.1152/jn.2000.84.4.1888. [DOI] [PubMed] [Google Scholar]
- Kalinchuk AV, Lu Y, Stenberg D, Rosenberg PA, Porkka-Heiskanen T. Nitric oxide production in the basal forebrain is required for recovery sleep. J Neurochem. 2006a;99:483–498. doi: 10.1111/j.1471-4159.2006.04077.x. [DOI] [PubMed] [Google Scholar]
- Kalinchuk AV, Stenberg D, Rosenberg PA, Porkka-Heiskanen T. Inducible and neuronal nitric oxide synthases (NOS) have complementary roles in recovery sleep induction. Eur J Neurosci. 2006b;24:1443–1456. doi: 10.1111/j.1460-9568.2006.05019.x. [DOI] [PubMed] [Google Scholar]
- Kalinchuk AV, Urrila AS, Alanko L, Heiskanen S, Wigren HK, Suomela M, Stenberg D, Porkka-Heiskanen T. Local energy depletion in the basal forebrain increases sleep. Eur J Neurosci. 2003;17:863–869. doi: 10.1046/j.1460-9568.2003.02532.x. [DOI] [PubMed] [Google Scholar]
- Kalinchuk AV, Porkka-Heiskanen T, McCarley RW, Basheer R. Sleep deprivation triggers inducible nitric oxide – dependent nitric oxide production in wake-active basal forebrain neurons. J Neurosci. 2010;30:13254–13264. doi: 10.1523/JNEUROSCI.0014-10.2010. [DOI] [PMC free article] [PubMed] [Google Scholar]
- Kleinert H, Pautz A, Linker K, Schwarz PM. Regulation of the expression of inducible nitric oxide synthase. Eur J Pharmacol. 2004;500:255–266. doi: 10.1016/j.ejphar.2004.07.030. [DOI] [PubMed] [Google Scholar]
- Kapás L, Shibata M, Kimura M, Krueger JM. Inhibition of nitric oxide synthesis suppresses sleep in rabbits. Am J Physiol. 1994a;266:R151–R157. doi: 10.1152/ajpregu.1994.266.1.R151. [DOI] [PubMed] [Google Scholar]
- Kapás L, Fang J, Krueger JM. Inhibition of nitric oxide synthesis inhibits rat sleep. Brain Res. 1994b;664:189–196. doi: 10.1016/0006-8993(94)91969-0. [DOI] [PubMed] [Google Scholar]
- Kapás L, Krueger JM. Nitric oxide donors SIN-1 and SNAP promote nonrapid-eye-movement sleep in rats. Brain Res Bull. 1996;41:293–298. doi: 10.1016/s0361-9230(96)00227-4. [DOI] [PubMed] [Google Scholar]
- Kojima H, Nakatsubo N, Kikuchi K, Kawahara S, Kirino Y, Nagoshi H, Hirata Y, Nagano T. Detection and imaging of nitric oxide with novel fluorescent indicators: diaminofluoresceins. Anal Chem. 1998a;70:2446–2453. doi: 10.1021/ac9801723. [DOI] [PubMed] [Google Scholar]
- Kojima H, Nakatsubo N, Kikuchi K, Urano Y, Higuchi T, Tanaka J, Kudo Y, Nagano T. Direct evidence of NO production in rat hippocampus and cortex using a new fluorescent indicator: DAF-2 DA. Neuroreport. 1998b;9:3345–3348. doi: 10.1097/00001756-199810260-00001. [DOI] [PubMed] [Google Scholar]
- Koo MS, Levitt JJ, Salisbury DF, Nakamura M, Shenton ME, McCarley RW. A cross-sectional and longitudinal magnetic resonance imaging study of cingulate gyrus gray matter volume abnormalities in first-episode schizophrenia and first-episode affective psychosis. Arch Gen Psychiatry. 2008;65:746–760. doi: 10.1001/archpsyc.65.7.746. [DOI] [PMC free article] [PubMed] [Google Scholar]
- Livak KJ, Schmittgen TD. Analysis of relative gene expression data using real-time quantitative PCR and the 2(−Delta Delta C(T)) Method. Methods. 2001;25:402–408. doi: 10.1006/meth.2001.1262. [DOI] [PubMed] [Google Scholar]
- Lowenstein CJ, Padalko E. iNOS (NOS2) at a glance. J Cell Sci. 2004;117:2865–2867. doi: 10.1242/jcs.01166. [DOI] [PubMed] [Google Scholar]
- Mackenzie IM, Ekangaki A, Young JD, Garrard CS. Effect of renal function on serum nitrogen oxide concentrations. Clin Chem. 1996;42:440–444. [PubMed] [Google Scholar]
- Materi LM, Rasmusson DD, Semba K. Inhibition of synaptically evoked cortical acetylcholine release by adenosine: an in vivo microdialysis study in the rat. Neurosci. 2000;97:219–226. doi: 10.1016/s0306-4522(00)00075-0. [DOI] [PubMed] [Google Scholar]
- McCarley RW. Neurobiology of REM and NREM sleep. Sleep Med. 2007;8:302–330. doi: 10.1016/j.sleep.2007.03.005. [DOI] [PubMed] [Google Scholar]
- McCormick DA, Wang Z, Huguenard J. Neurotransmitter control of neocortical neuronal activity and excitability. Cereb Cortex. 1993;3:387–398. doi: 10.1093/cercor/3.5.387. [DOI] [PubMed] [Google Scholar]
- McCoy JG, Tartar JL, Bebis AC, Ward CP, McKenna JT, Baxter MG, McGaughy J, McCarley RW, Strecker RE. Experimental sleep fragmentation impairs attentional set-shifting in rats. Sleep. 2007;30:52–60. doi: 10.1093/sleep/30.1.52. [DOI] [PubMed] [Google Scholar]
- McKenna JT, Tartar JL, Ward CP, Thakkar MM, Cordeira JW, McCarley RW, Strecker RE. Sleep fragmentation elevates behavioral, electrographic and neurochemical measures of sleepiness. Neurosci. 2007;146:1462–1473. doi: 10.1016/j.neuroscience.2007.03.009. [DOI] [PMC free article] [PubMed] [Google Scholar]
- McKinney M, Jacksonville MC. Brain cholinergic vulnerability: relevance to behavior and disease. Biochem Pharmacol. 2005;70:1115–1124. doi: 10.1016/j.bcp.2005.05.019. [DOI] [PubMed] [Google Scholar]
- Medeiros R, Prediger RD, Passos GF, et al. Connecting TNF-alpha signaling pathways to iNOS expression in a mouse model of Alzheimer’s disease: relevance for the behavioral and synaptic deficits induced by amyloid beta protein. J Neurosci. 2007;27:5394–5404. doi: 10.1523/JNEUROSCI.5047-06.2007. [DOI] [PMC free article] [PubMed] [Google Scholar]
- Monti JM, Hantos H, Ponzoni A, Monti D, Banchero P. Role of nitric oxide in sleep regulation: effects of L-NAME, an inhibitor of nitric oxide synthase, on sleep in rats. Behav Brain Res. 1999;100:197–205. doi: 10.1016/s0166-4328(98)00131-4. [DOI] [PubMed] [Google Scholar]
- Monti JM, Jantos H. Microinjection of the nitric oxide synthase inhibitor L-NAME into the lateral basal forebrain alters the sleep/wake cycle of the rat. Prog. Neuropsychopharmacol Biol Psychiatry. 2004;28:239–247. doi: 10.1016/j.pnpbp.2003.10.001. [DOI] [PubMed] [Google Scholar]
- Murillo-Rodriguez E, Blanco-Centurion C, Gerashchenko D, Salin-Pascual RJ, Shiromani PJ. The diurnal rhythm of adenosine levels in the basal forebrain of young and old rats. Neurosci. 2004;123:361–370. doi: 10.1016/j.neuroscience.2003.09.015. [DOI] [PubMed] [Google Scholar]
- Muzur A, Pace-Schott EF, Hobson JA. The prefrontal cortex in sleep. Trends Cogn Sci. 2002;6:475–481. doi: 10.1016/s1364-6613(02)01992-7. [DOI] [PubMed] [Google Scholar]
- Nofzinger EA, Buysse DJ, Miewald JM, et al. Human regional cerebral glucose metabolism during non-rapid eye movement sleep in relation to waking. Brain. 2002;125:1105–1115. doi: 10.1093/brain/awf103. [DOI] [PubMed] [Google Scholar]
- Paxinos G, Watson C. The rat brain in stereotaxic coordinates. Academic Press; San Diego: 1998. [DOI] [PubMed] [Google Scholar]
- Porkka-Heiskanen T, Strecker RE, Thakkar M, Bjorkum AA, Greene RW, McCarley RW. Adenosine: a mediator of the sleep-inducing effects of prolonged wakefulness. Science. 1997;276:1265–1268. doi: 10.1126/science.276.5316.1265. [DOI] [PMC free article] [PubMed] [Google Scholar]
- Porkka-Heiskanen T, Strecker RE, McCarley RW. Brain site-specificity of extracellular adenosine concentration changes during sleep deprivation and spontaneous sleep: an in vivo microdialysis study. Neurosci. 2000;99:507–517. doi: 10.1016/s0306-4522(00)00220-7. [DOI] [PubMed] [Google Scholar]
- Rainnie DG, Grunze HC, McCarley RW, Greene RW. Adenosine inhibition of mesopontine cholinergic neurons: implications for EEG arousal. Science. 1994;263:689–692. doi: 10.1126/science.8303279. [DOI] [PMC free article] [PubMed] [Google Scholar]
- Ramesh V, Thatte HS, McCarley RW, Basheer R. Adenosine and sleep deprivation promote NF-kappaB nuclear translocation in cholinergic basal forebrain. J Neurochem. 2007;100:1351–1363. doi: 10.1111/j.1471-4159.2006.04314.x. [DOI] [PubMed] [Google Scholar]
- Rosenberg PA, Li Y, Le M, Zhang Y. Nitric oxide-stimulated increase in extracellular adenosine accumulation in rat forebrain neurons in culture is associated with ATP hydrolysis and inhibition of adenosine kinase activity. J Neurosci. 2000;20:6294–6301. doi: 10.1523/JNEUROSCI.20-16-06294.2000. [DOI] [PMC free article] [PubMed] [Google Scholar]
- Rye DB, Wainer BH, Mesulam MM, Mufson EJ, Saper CB. Cortical projections arising from the basal forebrain: a study of cholinergic and noncholinergic components employing combined retrograde tracing and immunohistochemical localization of choline acetyltransferase. Neurosci. 1984;13:627–643. doi: 10.1016/0306-4522(84)90083-6. [DOI] [PubMed] [Google Scholar]
- Rytkonen KM, Wigren HK, Kostin A, Porkka-Heiskanen T, Kalinchuk AV. Nitric oxide mediated recovery sleep is attenuated with aging. Neurobiol Aging. 2008 doi: 10.1016/j.neurobiolaging.2008.10.006. In press. [DOI] [PubMed] [Google Scholar]
- Saper CB. Organization of cerebral cortical afferent systems in the rat. II. Magnocellular basal nucleus. J Comp Neurol. 1984;222:313–342. doi: 10.1002/cne.902220302. [DOI] [PubMed] [Google Scholar]
- Sarter M, Bruno JP, Givens B. Attentional functions of cortical cholinergic inputs: what does it mean for learning and memory? Neurobiol Learn Mem. 2003;80:245–256. doi: 10.1016/s1074-7427(03)00070-4. [DOI] [PubMed] [Google Scholar]
- Steriade M, McCarley RW. Brain control of wakefulness and sleep. Kluwer Academic Press; New York: 2005. [Google Scholar]
- Thakkar MM, Delgiacco RA, Strecker RE, McCarley RW. Adenosinergic inhibition of basal forebrain wakefulness-active neurons: a simultaneous unit recording and microdialysis study in freely behaving cats. Neurosci. 2003;122:1107–1113. doi: 10.1016/j.neuroscience.2003.08.006. [DOI] [PubMed] [Google Scholar]
- Tobler I, Borbely A. Sleep EEG in the rat as a function of prior waking. Electroencephal Clin Neurophysiol. 1986;64:74–76. doi: 10.1016/0013-4694(86)90044-1. [DOI] [PubMed] [Google Scholar]
- Tobler I, Borbely AA. The effect of 3-h and 6-h sleep deprivation on sleep and EEG spectra of the rat. Behav Brain Res. 1990;36:73–78. doi: 10.1016/0166-4328(90)90161-7. [DOI] [PubMed] [Google Scholar]
- Udayabanu M, Kumaran D, Nair RU, Srinivas P, Bhagat N, Aneja R, Katyal A. Nitric oxide associated with iNOS expression inhibits acetylcholinesterase activity and induces memory impairment during acute hypobaric hypoxia. Brain Res. 2008;1230:138–149. doi: 10.1016/j.brainres.2008.06.081. [DOI] [PubMed] [Google Scholar]
- Van Dort CJ, Baghdoyan HA, Lydic R. Adenosine A(1) and A(2A) receptors in mouse prefrontal cortex modulate acetylcholine release and behavioral arousal. J Neurosci. 2009;29:871–881. doi: 10.1523/JNEUROSCI.4111-08.2009. [DOI] [PMC free article] [PubMed] [Google Scholar]
- Williams JA, Vincent SR, Reiner PB. Nitric oxide production in rat thalamus changes with behavioral state, local depolarization, and brainstem stimulation. J Neurosci. 1997;17:420–427. doi: 10.1523/JNEUROSCI.17-01-00420.1997. [DOI] [PMC free article] [PubMed] [Google Scholar]
- Woolf NJ, Hernit MC, Butcher LL. Cholinergic and non-cholinergic projections from the rat basal forebrain revealed by combined choline acetyltransferase and Phaseolus vulgaris leucoagglutinin immunohistochemistry. Neurosci Lett. 1986;66:281–26. doi: 10.1016/0304-3940(86)90032-7. [DOI] [PubMed] [Google Scholar]
Associated Data
This section collects any data citations, data availability statements, or supplementary materials included in this article.