

Abstract
Summary: MADGene is a software environment comprising a web-based database and a java application. This platform aims at unifying gene identifiers (ids) and performing gene set analysis. MADGene allows the user to perform inter-conversion of clone and gene ids over a large range of nomenclatures relative to 17 species. We propose a set of 23 functions to facilitate the analysis of gene sets and we give two microarray applications to show how MADGene can be used to conduct meta-analyses.
Availability: The MADGene resources are freely available online from http://www.madtools.org, a website dedicated to the analysis and annotation of DNA microarray data.
Contact: gerard.ramstein@univ-nantes.fr
Supplementary information: Supplementary data are available at Bioinformatics online.
1 INTRODUCTION
The analysis of heterogeneous data is a time-consuming and tedious task. Many tools exist for mapping gene ids across several references and species (see 14 references in Supplementary Material 1). Although these resources offer many interesting options, our platform has the advantage of integrating three essential features: the capacity to annotate heterogeneous id lists, a large coverage of species and an easy-to-use application for investigating multiple gene lists, which includes relational operators and multiple statistical tests.
2 METHODS
Our software environment comprises two distinct tools: (i) MADGene, a database for mapping gene ids and (ii) eMADGene, a java application for gene set management.
The MADGene database allows the user to convert id lists in order to unify heterogeneous gene sets. The MADGene database creates bridges across 13 different identifier types: Unigene, GenBank, RefSeq, clone ids, official gene symbols, aliases, EntrezGene, probe identifiers (Affymetrix, Agilent, Illumina), UNIPROT, Ensembl (genes and transcripts). This information has been collected from the following databases: Unigene, UNIPROT, Homologene, EntrezGene, Gene Expression Omnibus (GEO), Ensembl. The 17 following species are considered: Anopheles gambiae, Arabidopsis thaliana, Bos taurus, Caenorhabditis elegans, Canis familiaris, Drosophila melanogaster, Danio rerio, Gallus gallus, Homo sapiens, Magnaporthe grisea, Mus musculus, Neurospora crassa, Oryza sativa, Pan troglodytes, Plasmodium falciparum, Rattus norvegicus, Saccharomyces cerevisiae. The current version of MADGene database contains ∼128 million entries. Compared to other translation tools, MADGene proposes inter-species conversion as well as a broader coverage of input ids, as shown in Figure 1 (see discussion in Supplementary Material 1). Moreover, there is no need with MADGene to specify the type of input id: a list of heterogeneous ids is automatically processed by the tool.
Fig. 1.
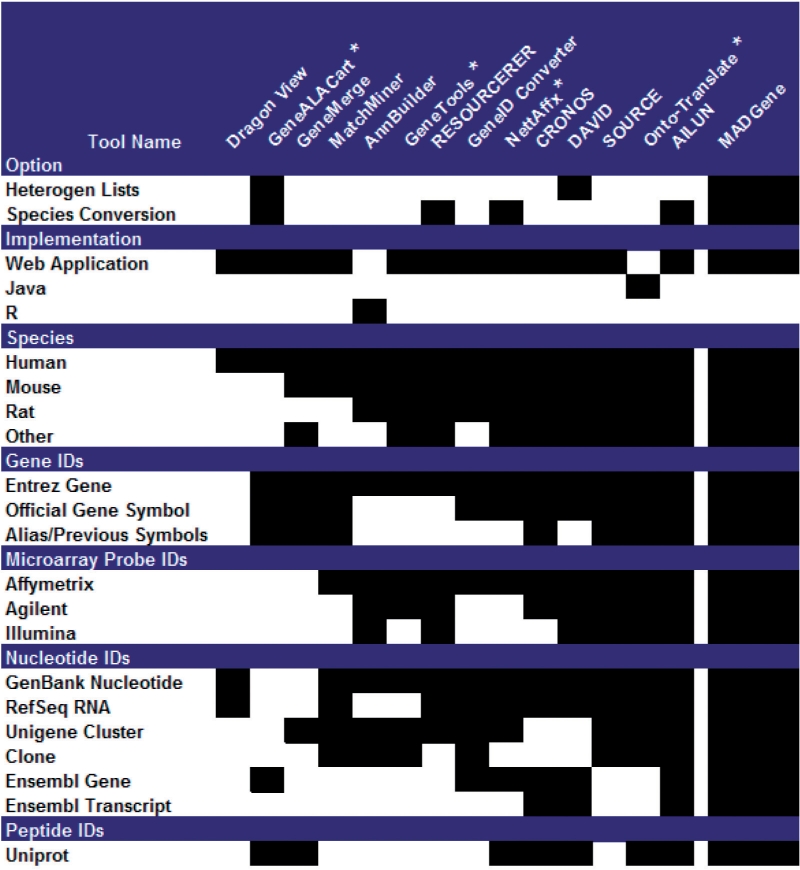
Comparison of MADGene with other gene id translation tools. Black cells indicate that the option is taken into account by the conversion tool. See also the more detailed figure in Supplementary Material 1. Asterisk indicates ‘free but requires registration’.
A query form permits to convert an id (or a list of ids) from one or several references into its equivalent defined in a set of target references. MADGene is thus a means to overcome the heterogeneity of technological platforms and to facilitate inter-studies and inter-species meta-analysis.
The nomenclature of ids largely differs depending on the tools and resource databases. To assess the reliability of MADGene, we compared the conversion performed between any id types over a large sample of ids with the results provided by other conversion tools. Our test based on a majority vote procedure showed that our tool yields satisfactory performances: we obtained a median precision of 0.95 and a median recall of 0.94 (see Supplementary Material 2 for a discussion and Supplementary File 1 for the raw results).
eMADGene is a freely available complementary tool aiming at processing and comparing gene lists. This kind of data is very frequent as an output of a microarray data algorithm (Baron et al., 2007). The most common results are: a set of genes measured on a DNA chip, a cluster extracted from a hierarchical clustering or a list of differential genes issued from a statistical test. eMADGene provides a set of 23 functions for reading or writing gene lists (using different delimiter-separated value formats), for performing relational operations on gene sets (intersection, union, difference), for transforming the data (concatenation, selection, etc.) and for discovering remarkable patterns using statistical tests.
eMADGene differs from statistical methods such as gene set enrichment analysis (GSEA) (Subramanian et al., 2005). Its purpose is to provide a set of basic instructions rather than a unique and complex algorithm. eMADGene is simpler than a dedicated method, however it is more flexible since the user can define its own sequence of instructions.
This tool is a downloadable java application providing a graphical user interface: the user can easily specify a complex sequence of operations without any programming skills. The source code is also available for developers under general public license (GPL). MADGene database can be accessed through a web browser or directly from the eMADGene application.
3 RESULTS
A wide range of analyses can be conducted from gene lists. For concision sake, we only focused on a particular example of use: gene lists taken from public microarray samples. We give two applications to indicate the pertinence and reliability of our tool. The first one compares samples issued from several human datasets related to Duchenne Muscular Dystrophy (DMD). The second application identifies matching regions between two hierarchical clusterings related to two species (human DMD and mouse mdx). All the computations were performed with eMADGene. All the figures were drawn using R graphical functions.
3.1 Comparison of samples over multiple studies
This example concerns a meta-analysis of public studies related to DMD. We collected 193 samples from four GEO series involving seven different platforms (see legend in Figure 2A). All the studies comprise normal human muscular (NHM) tissues and dystrophic tissues (DMD). We compared every pair of samples of the dataset using a statistical test. First, the genes are ranked according to their expression value in each sample. Then the number of genes that are under the median rank in both samples is considered. The test returns a P-value representing the probability to find such a high number of common genes (see Supplementary Material 3 for more details).Figure 2A shows the corresponding square matrix of P-values, grouped by classes (NHM versus DMD). One observes a strong difference between both classes, which means that the dystrophy globally affects the muscle transcriptome. This differentiation is all the more remarkable that it is comparable whether samples belong to intra- or inter-studies, although no inter-study normalization has been performed.
Fig. 2.

Two applications performed with eMADGene. (A) Meta-analysis of DMD. The square matrix represents P-values associated to a pair of samples. The legend on the top right indicates the GEO studies from which the samples were issued. (B) Extraction of matching regions. The first column is a hierarchical clustering of the human study, the fourth column corresponds to the mouse study. The two central columns indicate the mapping between the extracted regions.
To assess the reliability of our tool, we also provide in Supplementary Material 3 a study on tumour classification showing that this method yields competitive results with state-of-the-art methods.
3.2 Cluster matching between two clusterings
A function of eMADGene permits to discover regions enriched in common genes from two ordered lists. We applied this function to identify similar regions from two hierarchical clusterings performed on two independent studies. The first dataset (GSE1004, GPL91) is a study of human muscular tissues composed of NHM and DMD samples. The second dataset (GSE7187, GPL339) is a study of mouse muscular tissues (normal, Fiona and mdx tissues).Figure 2B shows the matching regions. The coloured regions correspond to gene sets co-expressed in both studies. The most remarkable match (indicated by a couple of arrows; P-value = 10−33) was related to a signature of up-regulated genes both in DMD (first study) and mdx (second study) muscles. The concepts and algorithm used for the extraction of the regions are fully described in Supplementary Material 4.
Funding: This work was supported in part by the Regional research funding (BIL project) and the French Muscular Dystrophy Association (AFM).
Conflict of Interest: none declared.
Supplementary Material
REFERENCES
- Baron D, et al. DNA microarrays. Ingénierie et Recherche Biomedicale. 2007;28:210–215. [Google Scholar]
- Subramanian A, et al. Gene set enrichment analysis: a knowledge-based approach for interpreting genome-wide expression profiles. Proc. Natl Acad. Sci. USA. 2005;102:15545–15550. doi: 10.1073/pnas.0506580102. [DOI] [PMC free article] [PubMed] [Google Scholar]
Associated Data
This section collects any data citations, data availability statements, or supplementary materials included in this article.