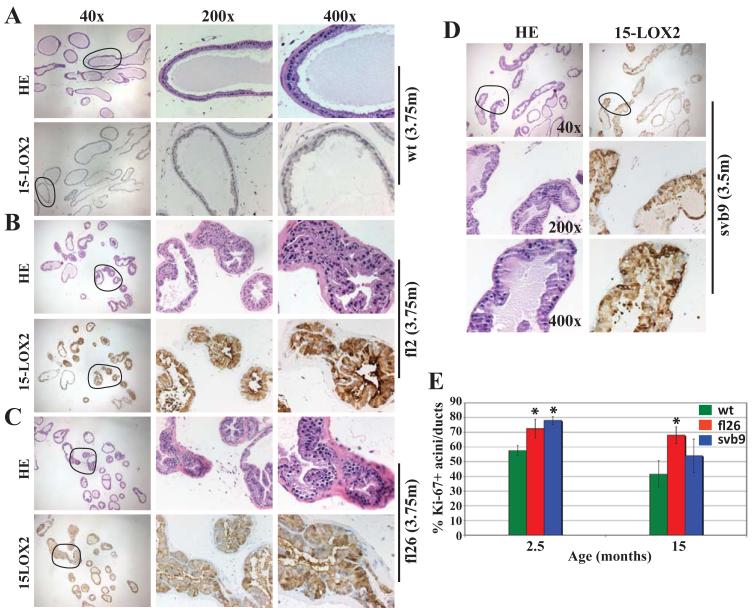
Figure 3. Transgenic VPs demonstrate epithelial hyperplasia.
(A) H&E and 15-LOX2 staining of wt VPs.
(B-D) The VPs of fl2 (B, highest expresser) and fl26 (C, high expresser) display prominent epithelial hyperplasia that correlated with transgene expression levels. The VPs of svb9 (D) also show epithelial hyperplasia. The ages in months (m) and the original magnifications of microphotographs are indicated. Circled areas in the 40x images are enlarged in the corresponding 200x and 400x images.
(E) Ki-67+ acini/ducts as % of the total acini and ducts counted. Whole-mount VP sections stained for Ki-67 were used to quantify the acini and ducts that contained Ki-67+ cells [total numbers of acini/ducts counted: n = 168 for wt (15m), 202 for fl26 (15m), 215 for svb9 (15m), 196 for wt (2.5m), 189 for fl26 (2.5m), 195 for svb9 (2.5m)]. Data were collected from serial whole-mount sections of 3 VPs (* p<0.05).

