

Abstract
Serotonin is synthesized from its precursor, tryptophan, by brainstem raphé neurons and their synaptic terminals in limbic regions. The omission of tryptophan from an Acute Tryptophan Depletion (ATD) diet transiently diminishes serotonin synthesis, alters raphé activity, and mimics symptoms of depression. Raphé functional magnetic resonance imaging (fMRI) poses challenges using signal-averaging analyses. Time-series properties of fMRI blood oxygenation level dependent (BOLD) signals may hold promise, so we analyzed raphé signals for changes with the ATD diet. Eleven remitted (previously depressed) patients were awake with eyes-closed during seven-minute resting scans with 0.5 s−1 sampling. BOLD signal time-series data were frequency-filtered using wavelet transforms, yielding three octave-width frequency bands from 0.25 to 0.03 s−1 and an unbounded band below 0.03 s−1. Spectral power, reflecting signal information, increased in pontine raphé at high frequencies (0.25 to 0.125 s−1) during ATD (compared to control, balanced, diet, P<0.004) but was unchanged at other frequencies. Functional connectivity, the correlation between time-series data from pairs of regions, weakened between pontine raphé and anterior thalamus at low frequencies during ATD (P<0.05). This preliminarily supports using fMRI time-series features to assess pontine raphé function. Whether, and how, high frequency activity oscillations interfere with low frequency signaling requires further study.
Keywords: Serotonin, Oscillometry
1. Introduction
The serotonin system is involved in depression, sleep, and cognition (Maes and Meltzer 1995; Blier 2001; Meyer 2007). Serotonin neurons are found in brainstem raphé nuclei. Our understanding of serotonin pathophysiology in depression and related conditions would benefit from a replicable, non-invasive raphé imaging method with rapid temporal resolution. Imaging serotonin function in the brainstem raphé nuclei with functional magnetic resonance imaging (fMRI) is challenging because of noise and artifacts. Such obstacles to fMRI measurements may be more manageable using time-series data analyses to measure raphé oscillatory properties.
Over a wide range of frequencies from milliseconds to annual cycles, neural networks oscillate in reliable patterns that modulate inputs, synaptic plasticity, and the consolidation of information (Buzsáki and Draguhn, 2004). Intrinsic oscillatory features are seen in “resting” fMRI signals – collected while the brain is not engaged in discrete tasks (Biswal et al., 1997, Marx et al., 2004; Fukunaga et al., 2006; McAvoy et al., 2008; Bianciardi et al., 2009; Garrett et al., 2010). Serotonin neuron firing rates and raphé activity intensities fluctuate spontaneously during sleep and other ultradian phases (Aghajanian et al., 1970; Mosko and Jacobs, 1976; Carlsson et al., 1980; Vandermaelen and Aghajanian, 1983; Lydic et al., 1984; Marazziti et al., 1990; Roy et al., 1991; Jacobs and Fornal, 1991; Jacobs and Azmitia, 1992; Lowry, 2002; Zeitzer et al., 2002; Salomon et al., 2005; Salomon et al., 2006). Oscillations in raphé activity are known to critically influence target regional activities, viz., preclinical evidence of intrahippocampal synchronizations (Sheu, 1974; Hobson et al., 1974; Vertes, 1981), and phasic licking and grooming behaviors linked to raphé neuron activity (reviewed by Jacobs and Fornal, 1995). In humans, serotonergic effects on the binocular switch rate (Carter et al., 2005) also suggest that oscillations in raphé activity influence distant regions. Time series analyses of fluctuations in raphé function may provide reliable information regarding serotonin neuron activity, especially from a within-subjects design measuring acute changes in serotonin function.
Acute Tryptophan Depletion (ATD) is known to rapidly alter states of serotonin function. Abrupt reductions in central serotonin availability occur following amino acid diets that omit tryptophan (TRP), the serotonin precursor. ATD leads to a marked, stable and global reduction in brain serotonin synthesis, with a central TRP nadir reaching 2% of baseline after about five hours that lasts for one to two hours (Salomon, et al., 2003), and produces clinically measurable changes in mood (Young et al., 1985). About half of all subjects tested, among remitted patients taking serotonin reuptake inhibitors for a previous depressive episode, show a brief relapse of depressive symptoms during ATD (Delgado et al., 1990; Delgado et al., 1991; Neumeister et al., 2004; reviews by Salomon et al., 1993; Moore et al., 2000; van der Does et al., 2001; Bell et al., 2005). Factors explaining ATD response, including the degree of depletion, remain unsatisfactory (Booij et al., 2002; Salomon et al., 2003; Moreno et al., 2010).
We hypothesized that low serotonin availability elicited by ATD would alter oscillatory activities in pontine raphé, would affect oscillations in other regions modulated by serotonin and related to mood regulation, and would also alter time-series correlations among these regions. Regions in which changes in metabolism or blood flow are associated with depression or mood relapse during ATD include the raphé, anterior cingulate, habenula, anterior thalamus, orbitofrontal cortex, and caudate nuclei (Bremner et al., 1997; Morris et al., 1999; Baxter et al., 1985; Mayberg et al., 1999; Mayberg 2009). We assessed functional changes in these regions using resting fMRI time-series data. Scans were acquired after ATD diets and control diets (balanced, including tryptophan) in patients treated with serotonin reuptake inhibitor (SRI) antidepressants and remitted from depression. Spectral power and raphé functional connectivity for each region in four frequency bands was measured for each diet condition.
2. Methods
2.1. Overview
Participants from the University community were in remission from prior episodes of depression while taking only SRI medications. Acute tryptophan-depleting (ATD) and control (inclusive of tryptophan) diets were given in random, double blind sequences one week apart. fMRI resting scans followed, six hours after the diet. Pontine raphé regional spectral power was hypothesized a priori to change during ATD. Changes in functional connectivity were also hypothesized between pontine raphé and the anterior cingulate (left or right) or anterior thalamus (also left or right). Functional connectivity involving caudate head and habenula regions, and spectral power for the set of eight target regions were added as post-hoc analyses. Results from the first two measures prompted post-hoc correlations of raphé spectral power and functional connectivity for the raphé and thalamic regions across subjects.
2.2. Participants (see online supplement for participant characteristics)
An institution-wide email solicited SRI-remitted, previously depressed adults. Inclusion required age 18 to 50, 17-item Hamilton rating scale for depression (Hamilton, 1960, HRSD) score below 8 points, and signed consent as approved by the Vanderbilt University Medical Center Institutional Review Board. A clinical diagnostic interview (RMS) and structured diagnostic interview (Mini International Neuropsychiatric Interview, MINI; Sheehan et al., 1998) confirmed a retrospective depression diagnosis and current remitted status. Participants were excluded for current or prior suicidality, or abnormalities on medical history, safety labs (blood cell counts and electrolytes, hepatic profile, urinalysis with toxicology) or physical examination. To minimize risk to patients, assure normal metabolic responses to the diet tests, and minimize artifacts for fMRI, patients were also excluded for histories of migraine, hepatitis, endocrinopathy, pregnancy, metal implants or current (6 months) substance abuse or lifelong history of dependence.
SRI-type medications (fluoxetine (1 patient), sertraline (3), paroxetine (1), citalopram (1) or escitalopram (5), see TABLE in the online supplement for patient demographics and individual medications) were continued throughout the study without other medications, extending the pre-study treatment and remission that had lasted at least 2 months. Prior to each diet test, participants fasted after midnight (except water and daily medication), and arrived at 8 am to acclimate to the General Clinical Research Center (GCRC) where they completed mood ratings, blood sampling, and intravenous line placement prior to diet administration. Fasting continued except for the test diets, and small amounts of water and non-caffeinated carbonated beverages. Intravenous 5% dextrose was given at 125 ml/hr. Participants were instructed to report changes in mood in either direction, understanding that the diets might or might not transiently improve or worsen mood. A normal diet was given at the conclusion of the scans and ratings. Participation and completion of all study procedures was compensated by a payment of $250, which was prorated for incomplete studies.
2.3. Tryptophan Depletion diet testing
Control or active (tryptophan-free) amino acid mixtures were administered at 9:30 a.m. in a random, double-blind crossover sequence on testing days one week apart. Diets were prepared by the Vanderbilt Investigational Drug Service using pharmaceutical grade amino acids from commercial suppliers. Active ATD amino acid (100 gm, ‘full-strength’) mixtures contained 15 amino acids in the balance found in human milk, but without tryptophan (l-alanine 5.5 gm, glycine 3.2 gm, l-histidine 3.2 gm, l-isoleucine 8 gm, l–leucine, 13.5 gm, l-lysine 11 gm, l-phenylalanine 5.7 gm, l-proline 12.2 gm, l-serine 6.9 gm, l-threonine 6.9 gm, l-valine 8.9 gm, l-tyrosine 6.9 gm). Control diets were identical, but included l -tryptophan 2.3 gm. Diets were administered as powder suspended in chocolate-flavored water. The foul-smelling amino acids (l-arginine 4.9 gm, l-cysteine 2.7 gm, and l-methionine 3 gm) were given in about ten gelatin capsules, as described previously (Delgado et al., 1990), fifteen minutes prior to the drink. Nutritionally balanced snacks (cheese, tuna, or turkey sandwich; chips; fruit) were given after the conclusion of the scans and ratings. Supplemental TRP was not given with supper, consistent with the earliest ATD studies of depressed patients (Delgado et al., 1990; Delgado et al., 1994).
Reading of magazines or books and stretching or ambulating for brief periods within the room were encouraged during the 6 hours between diet ingestion and fMRI scan. Serum TRP levels were determined at morning baseline and immediately prior to scanning. Morning and afternoon (post-scan) mood ratings used all items from the HRSD-17, with carry-forward of sleep and appetite items through the day, and were repeated at day-after monitoring visits at noon.
2.4. MRI scans, region selection and analysis
A 3T Philips Integra scanner with a SENSE coil provided blood oxygenation level-determined (BOLD, Ogawa et al., 1990) and 3D anatomical data for co-registered region selection. Brief scout (32 s), 3D anatomical (6.5 min), T1-weighted anatomical (112 s), and two 7-minute functional T2* scans were acquired; totaling about 30 minutes. Resting, standard T2*-weighted BOLD functional data were acquired with eyes closed while remaining awake (repeat time (TR) 2000 ms, echo time (TE) 25 ms, flip angle 79 degrees, 30 slices, 3.75 × 3.75 mm in-plane resolution). Slices were 4.5 mm thick with 0.5 mm gap. 200 volumes, obtained at 80 × 80, and were interpolated to 128 × 128 without additional spatial smoothing. Scans were acquired in the transverse plane defined by anterior and posterior commissures and corrected to that plane during pre-processing if necessary. Functional data were temporally shifted to adjust for slice-to-slice differences in acquisition time using sinc interpolation. The file acquisition protocol discarded the first four volumes to minimize T1 incursion effects on the T2* data sequence. Motion artifacts in the functional scans were assessed with trilinear sinc interpolation, but were used only for exclusion. Grossly visible artifact on visual inspection was cause for exclusion, as were movements greater than 1 mm translation or 1 degree rotation in any direction. Residual motion parameters were not included as covariates or other adjustments in analyses. No high pass filter was used. The ultralow (<0.03 s−1) output was detrended to remove drift artifact, which effectively functioned as a high pass filter with a cutoff of 0.0026 s−1. The other wavelet-filtered outputs are essentially detrended by the transform.
Coregistration with 3D anatomical scans allowed manual selection of regions-of-interest and used defined anatomical landmarks (see below) within single transverse slices (BrainVoyager QX [BV], Brain Innovation, Maastricht, The Netherlands). To avoid altering amplitudes of individual voxel signals that could occur during transformation or extrapolation to achieve standardized space, manual region selection was used. Voxel-wise tables of time-series data for each selected region were imported into MATLAB (Mathworks, Natick, MA) for custom-programmed high resolution wavelet filtering, automated intra-regional index voxel identification, regional determination of a dominant coherent signal, and spectral power and functional connectivity calculations.
Wavelet transform filtering was used because it isolates energies within narrow frequency bands without abrupt cutoffs and with minimal filter distortion error. Wavelet methods have previously been used for fMRI in denoising (thresholding) methods (Fadili and Bullmore, 2002; Fadili and Bullmore, 2004) and in mixed Fourier-wavelet procedures (Wink et al., 2008). We chose Daubechies 2 (orthogonal, 4 moments, 2 vanishing moments) wavelets (Daubechies, 1992) to preserve independence. Iterative wavelet transforms to level 3 concentrated signal power in frequency bands from approximately 0.25 (Nyquist for TR of 2 s) to 0.125 s−1 (high), from 0.125 to 0.06 s−1 (medium), from 0.06 to 0.03 s−1 (low), and below 0.03 s−1 (ultralow).
Spectral power, representing energy or information, was approximated as the sum of squares of each of the four output wavelet coefficient sets after removal of linear drift, analogous to expressions of EEG power but using BOLD intensity in place of voltage, and a band of frequencies in place of a single frequency on the spectrum. For these within-subjects comparisons, BOLD intensities were not normalized or standardized. Therefore, the spectral power is given here as a unitless measurement. Differences between control and active study conditions were tested using Wilcoxon Signed Ranks tests using a maximum alpha of 0.05 for determining statistical significance. A more rigorous, corrected alpha of 0.01 was applied to P values from independent tests of the four frequency bands between diet conditions for the raphé spectral power, since it was our primary hypothesis.
Functional connectivity was calculated as the correlation between time-series data from the raphé and other regions because raphé activity alters function in projection targets throughout the neuraxis (Dahlstrom and Fuxe, 1965; Aghajanian et al., 1970; Moore et al., 1978). Individual regional signals were calculated as described for spectral power. Bootstrapped 95% confidence intervals (corrected for sample bias) were generated around each of the observed functional connectivity coefficients to provide best estimates of the range of generalizable coefficients. Statistical significance of differences between functional connectivity correlations was then determined via the use of those confidence intervals (i.e., p < 0.05 for 95% confidence intervals). For this reason, exact null probability values are not presented for conclusions reached using confidence intervals. Within the context of confidence intervals, this means that bidirectional separation was required for an interpretation of statistical significance. That is, correlation values for a region-pair-condition had to be outside the CI for the other condition, and this had to be true in both directions, to consider the control-active difference in functional connectivity statistically significant.
Multiple comparisons were minimized in the a priori study design by limiting hypotheses and spare selections of regions-of-interest. Two-tailed tests of differences were used throughout. As stated above, tests of statistically significant differences for spectral power in the raphé were corrected for the four frequency bandwidths tested, with alpha of 0.0125. Tests of statistically significant differences in spectral power for between ATD diet and control diet comparisons within regions other than raphé, and also for between-regions differences in functional connectivity for all pairings, used an uncorrected alpha of 0.05 in this pilot study.
2.5. Anatomical region definitions
The pontomesencephalic pontine raphé region (approximating dorsal portions) was defined on the first transverse slice where both cerebral peduncles were well-defined immediately superior to the pons, one transverse anatomical slice (1 mm) superior to the isthmus and immediately anterior to the fourth ventricle (Figure 1, also Online Supplementary Figure 3.a.). This slice was parallel and between 16 to 30 mm inferior to the transverse plane defined by the anterior and posterior commissures. Due to the lack of clear anatomical boundaries for this region from the surrounding regions, the dorsal raphé nucleus was defined as having a width of one third the total width of the midbrain at that level and a height of 3 (mm) pixels. The inferior border was defined 2 mm anterior to the fourth ventricle (see Baker et al., 1990).
Figure 1.
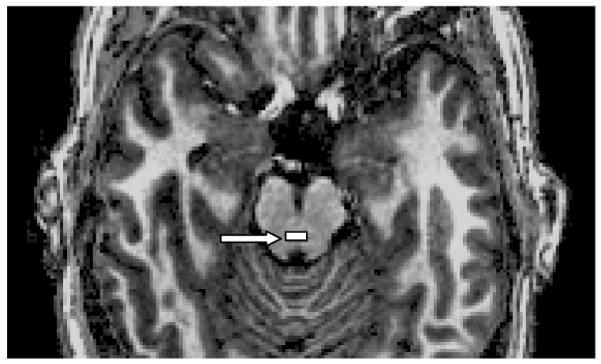
Manually drawn pontine raphé region (shaded rectangle, white arrow), defined in plane 1 mm rostral to the isthmus. (see also color version in online supplement).
The anterior cingulate regions were all pregenual, since they were defined in the transverse slice where the lateral ventricles and the corpus callosum both showed greatest anterior extent. The right and left anterior cingulate cortices were defined separately within one slice, carefully avoiding any paracingulate tissues as visualized entering the frontal lobe in the sagittal view. (Supplementary Figure 3.b., online).
The anterior thalamus region was localized in a mid-sagittal view and defined in the transverse slice in which the thalamus was largest in anterior to posterior dimension. The anterior half of the thalamus within that slice was sampled (about 50 voxels), with the posterior boundary defined by a horizontal line from the most posterior-medial to anterior-lateral thalamic point within that slice. A comparison of thalami defined by two different research assistants is shown from the same scan, showing strong similarity between regions selected. (Supplementary Figures 3.c, 3.d, online).
The caudate head region was selected in the same plane as the cingulate region, defined again by the most anterior aspect of the lateral ventricle. The postero-lateral extent was easily identifiable visually by the tissue density boundary, and defined by a chord drawn rostral to the anterior limb. The remaining border was taken as the caudate-lateral ventricular surface. (Supplementary Figure 3.b., online).
The habenula regions were drawn in transverse slices defined as 3 mm above the superior aspect of the posterior commissure, which also usually showed the maximal extent of the origin of the pineal stalk. The center anatomical voxel of a 3 mm by 3 mm region was defined 1 mm medial and 1 mm anterior to the postero-lateral corner of the thalamic body. (Supplementary Figure 3.e., online).
3. Results
3.1. Participants and behavioral outcome
Intranet institutional email advertising and phone screening provided a uniform group of high-functioning, employed and socially active participants (n = 11), 21 to 49 years of age (35.9 ± 10.4; means throughout ± SD), and balanced by gender (6 females, 55%, see TABLE in the online supplement for patient demographics). Retrospective estimates of prior episode (pretreatment) symptom severity ranged from mild to moderate. None had histories of suicidal plans or behavior; all had recurrent illness. Screening (study intake) HRSD-17 scores averaged 2.67 ± 2.42 (n=11). Two subjects of the 13 entered were excluded from analysis, one for non-compliance with SRI maintenance (less than 50% compliance during the study period), and the other because he did not complete the second diet test.
No participant relapsed (increase in HRSD by 10 points or more) during depletion. Mood was unchanged during control testing (HRSD baseline: 2.67 ± 3.26, end: 2.92 ± 2.84, noon next day: 1.58 ± 2.35) and ATD testing (baseline: 2.50 ± 2.84, end: 3.42 ± 2.39, noon next day: 3.17 ± 5.59). Following previously published criteria (Delgado et al., 1994) for additional sub-analyses of mood changes, worsening of mood (increase by at least five but less than 10 points) was noted in two of eleven participants with ATD between morning and afternoon ratings. Three other participants showed a worsening of mood at noon on the follow-up day compared to morning test baseline scores. Control tests were not associated with changes of 5 or more points at any time point. All subjects tolerated study procedures well. There was no effect of sequence for the control vs. active conditions for mood ratings or for any other measure.
3.2. TRP blood levels
Technical problems limited availability of a complete set of TRP levels. Only serum levels (approximating free) TRP were determined. Among the five complete sets, mean pre-diet morning levels were 65.12 ± 17.0 ng/dL (pre-control tests: 70.53 ± 20.9 ng/dL, pre-ATD tests: 80.26 ± 18.5 ng/dL). Mean 4 p.m. control test levels were 91.95 ± 18.6 ng/dL, and 4 p.m. ATD test levels were 20.48 ± 4.6 ng/dL. The inclusion of all available data (with the incomplete sets) in these averages had negligible effects on the above means. The mean of all available 4 p.m. levels, including incomplete sets, was 19.01 ± 4.6 ng/dL (n = 9).
3.3. Spectral power changes with ATD (Table 1, Figure 2, Online Supplementary Figure 1)
Table 1. Spectral power in 4 frequency bands.
Spectral power (×103) from wavelet-filtered average signals using anatomically determined left (L) and right (R) regions drawn with coregistered T1 and T2* BOLD images acquired at 3Tesla
| mean ± SD | UltraLow (>32 sec) | Low (16 to 32 sec) | Medium (8 to 16 sec) | High (4 to 8 sec) | |||||||||||||
|---|---|---|---|---|---|---|---|---|---|---|---|---|---|---|---|---|---|
| ATD | Control | P* | ES | ATD | Control | P* | ES | ATD | Control | P* | ES | ATD | Control | P* | ES | ||
|
Anterior
Cingulate |
R | 92.5 ± 46.5 |
74.9 ± 33.0 |
0.21 | 0.38 | 3.0 ± 1.7 |
2.3 ± 1.5 | 0.25 | 0.42 |
2.3 ± 1.2 |
1.6 ± 0.7 |
0.04 | 0.63 |
2.5 ± 1.1 |
1.7 ± 0.9 |
0.008 | 0.77 |
| L | 106.1 ± 58.4 |
84.5 ± 39.7 |
0.21 | 0.37 | 3.8 ± 3.0 |
2.4 ± 1.6 | 0.29 | 0.47 | 2.7 ± 2.3 |
1.7 ± 0.8 |
0.42 | 0.47 | 2.7 ± 2.3 |
2.1 ± 1.0 |
0.86 | 0.31 | |
|
Anterior
Thalamus |
R | 184.2 ± 43.8 |
170.9 ± 73.3 |
0.48 | 0.18 |
5.7 ± 2.6 |
4.1 ± 2.0 | 0.03 | 0.58 |
4.9 ± 2.8 |
3.1 ± 1.8 |
0.04 | 0.67 | 4.5 ± 3.1 |
4.9 ± 4.3 |
0.59 | 0.15 |
| L | 186.0 ± 69.6 |
163.8 ± 68.9 |
0.42 | 0.31 | 5.2 ± 3.0 |
3.8 ± 1.5 | 0.11 | 0.46 | 4.8 ± 2.7 |
2.8 ± 1.5 |
0.11 | 0.78 | 4.9 ± 3.6 |
3.3 ± 1.3 |
0.18 | 0.45 | |
| Habenula | R | 254.9 ± 89.6 |
232.3 ±148.7 |
0.38 | 0.15 | 9.5 ± 6.7 |
7.6 ± 4.1 | 0.25 | 0.27 |
10.9 ± 6.8 |
7.0 ± 5.9 |
0.02 | 0.59 | 16.8 ± 10.9 |
8.7 ± 7.1 |
0.09 | 0.74 |
| L | 263.9 ± 82.2 |
229.0 ±125.7 |
0.25 | 0.29 |
11.5 ± 3.7 |
7.3 ± 3.7 | 0.03 | 1.15 | 14.4 ± 7.8 |
7.9 ± 3.4 |
0.06 | 0.83 | 21.3 ± 18.0 |
11.3 ± 5.0 |
0.08 | 0.55 | |
|
Caudate
Head |
R | 142.2 ± 53.2 |
118.2 ± 70.6 |
0.08 | 0.34 | 4.4 ± 2.1 |
3.3 ± 1.6 | 0.08 | 0.50 | 3.5 ± 2.3 |
2.8 ± 1.7 |
0.25 | 0.34 | 4.1 ± 3.8 |
3.8 ± 3.4 |
0.66 | 0.08 |
| L | 139.0 ± 55.7 |
124.3 ± 73.8 |
0.48 | 0.20 | 5.4 ± 6.2 |
3.3 ± 2.2 | 0.33 | 0.34 | 4.7 ± 4.7 |
2.5 ± 1.0 |
0.18 | 0.47 | 4.3 ± 5.0 |
2.8 ± 1.5 |
0.59 | 0.30 | |
|
Pontine
Raphé |
212.2 ± 64.5 |
198.0 ± 99.8 |
0.53 | 0.14 | 9.0 ± 5.8 |
6.2 ± 3.1 | 0.13 | 0.49 | 12.1 ± 5.9 |
9.0 ± 10.4 |
0.21 | 0.53 |
19.8** ±15.0 |
7.9 ± 5.5 |
0.004 | 0.79 | |
Bold font indicates comparisons significant by Wilcoxon Signed Rank (p<0.05, not corrected for multiple comparisons.)
Significant after correction for multiple comparisons, with ‘two-tailed’ alpha=0.0125 (a priori hypothesized analysis of spectral power in pontine raphé in four frequency bands).
ATD: acute tryptophan depletion diet; ES: effect size; mean ± standard deviation of n=11 SRI-remitted patients, within-subjects comparisons.
Figure 2. Raphé Spectral Power.

Pontine raphé enhancement of normalized spectral power during ATD at ultralow (ULow; < 0.033 s−1; *P<0.05), low (0.063 - 0.033 s−1), medium (Med; 0.125 -0.063 s−1), and high (0.25 - 0.125 s−1; **P < 0.004). n = 11, mean ± standard deviation. Dark bars: control diet; white bars: ATD.
For the pontine region inclusive of raphé, a statistically significant, 1.5-fold increase in spectral power in the high frequency band (0.25 to 0.125 s−1) was observed in the ATD condition (ATD: 19.8 ± 15.0, control: 7.9 ± 5.5, P =s 0.004, effect size 0.79).
No statistically significant differences between ATD and control conditions were seen for spectral power at ultralow frequencies (<0.03 s−1) in any of the other eight (non-raphé) regions (P > 0.05). At low frequency (0.06 to 0.03 s−1), there was a statistically significant increase with ATD relative to the control diet for spectral power in the right anterior thalamus (ATD: 5.7 ± 2.6; control: 4.1 ± 2.0, P=0.03); and in the left habenula (ATD: 11.5 ± 3.7; control: 7.3 ± 3.7, P=0.03). Spectral power at medium frequencies (0.125 to 0.06 s−1) was increased in the ATD condition in the right anterior cingulate (ATD: 2.3 ± 1.2; control: 1.6 ± 0.7), the right anterior thalamus (ATD: 4.9 ± 2.8; control: 3.1 ± 1.8, P=0.04), and the right habenula (ATD: 10.9 ± 6.8; control: 7.0 ± 5.9, P=0.02). The ATD effect at medium frequencies for the left habenula spectral power change was not statistically significant (ATD: 14.4 ± 7.8; control: 7.9 ± 3.4, P=0.06). Other than the change in high frequency (0.25 to 0.125 s−1) raphé spectral power described above, the only other statistically significant difference with ATD was in the right anterior cingulate (ATD: 2.5 ± 1.1; control: 1.7 ± 0.9, P=0.008).
To summarize, there was a significant increase in high frequency spectral power in the ATD condition in the region inclusive of pontine raphé and the right anterior cingulate. Other observed changes included increased spectral power at: Low frequency for right anterior thalamus and left habenula; and Medium frequency for right anterior cingulate, right anterior thalamus, and right habenula. Every region uniformly showed spectral power increases with ATD compared to control diets.
3.4. Functional connectivity of pontine raphé (Table 2, Figure 3)
Table 2. Pontine raphé functional connectivity (low frequency).
Correlations of pontine raphé time-series data with four other regions. Changes from control with acute tryptophan depletion
| Pontine Raphé with: | Mean r N=11 |
95% CI | ||
|---|---|---|---|---|
| Lower Limit | Upper Limit | |||
| Anterior Cingulate | ||||
| Left | Control | 0.61 | 0.48 | 0.72 |
|
| ||||
| ATD | 0.57 | 0.51 | 0.63 | |
| Right | Control | 0.63 | 0.52 | 0.72 |
|
| ||||
| ATD | 0.53 | 0.48 | 0.58 | |
| Anterior Thalamus | ||||
| Left * | Control | 0.78 | 0.68 | 0.83 |
|
| ||||
| ATD | 0.58 | 0.49 | 0.68 | |
| Right * | Control | 0.79 | 0.69 | 0.85 |
|
| ||||
| ATD | 0.57 | 0.48 | 0.66 | |
| Caudate Head | ||||
| Left * | Control | 0.69 | 0.61 | 0.76 |
|
| ||||
| ATD | 0.56 | 0.47 | 0.63 | |
| Right | Control | 0.63 | 0.56 | 0.71 |
|
| ||||
| ATD | 0.57 | 0.51 | 0.64 | |
| Habenula | ||||
| Left * | Control | 0.64 | 0.54 | 0.72 |
|
| ||||
| ATD | 0.54 | 0.44 | 0.64 | |
| Right * | Control | 0.72 | 0.67 | 0.78 |
|
| ||||
| ATD | 0.53 | 0.44 | 0.62 | |
Bold font for p<0.05; means outside confidence intervals bidirectionally.
Figure 3.

ATD effects on functional connectivity (r) between pontine raphé and four rostral regions; flame scale for r correlation values. AC= anterior cingulate; CH=caudate head; AT=anterior thalamus; Hb=habenula.
During control (balanced) diet testing, the mean functional connectivity of pontine raphé with target regions was strongest at low frequencies (0.06 to 0.03 s−1), ranging from r= 0.61 to r= 0.79 for the four regions. At ultralow frequencies (r = 0.37 to 0.50), at medium frequencies (r = 0.21 to 0.41), and at high frequencies (r= 0.01 to 0.15), control diets showed weaker connectivity.
Correlations at ultra-low frequencies (< 0.03 s−1) during the ATD conditions were significantly weaker than those during control diet testing bilaterally for raphé – anterior cingulate pairs; and for raphé – habenula pairs (all four pairs p< 0.05 by 95% CI). The greatest decrease in apparent connectivity with ATD compared to control was seen in low-frequency correlations for pontine raphé – anterior thalamic pairs bilaterally (right thalamus: control r=0.79, ATD r=0.57; left thalamus: control r=0.78, ATD r=0.58; both p<.05). Diminished low-frequency connectivity within the ATD condition was also seen between the pontine raphé and the habenula bilaterally (right habenula: control r=0.72, ATD r=0.53; left habenula: control r=0.64, ATD r=0.54; both p<0.05, 95% CI), and the left caudate head (control r=0.69, ATD r=0.56; both p<0.05).
At medium (0.125 to 0.06 s−1) frequencies, lowered functional connectivity within the ATD condition compared to the control condition differed only for the raphé – right anterior cingulate pair (p<0.05). There were no other significant differences between ATD and control condition in pontine raphé functional connectivity measures at medium frequencies, and none of the pairs showed significant differences at high frequencies.
3.5. Effects of ATD on functional connectivity for pairs other than raphé
Cortico-cortical functional connectivity coefficients between left and right anterior cingulate regions were strong, and no statistically significant differences in those coefficients were seen between the ATD and control conditions in any of the four frequency bands (ultralow and low frequencies: ATD: respective mean r = 0.87 and 0.90; control: respective mean r = 0.875 and 0.879; medium and high frequencies: ATD: respective mean r = 0.79 and 0.63; control: respectively mean r = 0.72 and 0.61, P > 0.05).
Contrary to the observations from raphé connectivity coefficients, statistically significant robust ipsilateral increases in functional connectivity between the striatal and thalamic regions were demonstrated in the ATD condition compared to the control diet (at ultralow frequencies (< 0.03 s−1) left anterior thalamic connectivity with left caudate head: ATD: r =0.66, control: r =0.56 (p<0.05); right anterior thalamic connectivity with right caudate head: ATD: r = 0.70, control: r =0.41 (p<0.05). No statistically significant differences between the ATD and control diet conditions for contralateral striatal and thalamic region functional connectivity pairs were demonstrated. Their coefficients were sufficiently strong to suggest that the lack of a strong difference between diet conditions was not due to a floor effect (left caudate with right thalamus: ATD r = 0.62, control r = 0.53; right caudate with left thalamus: ATD r = 0.66, control r = 0.51).
3.6 Relationship between spectral power and functional connectivity
Mean high frequency spectral power rose while mean low frequency thalamo-raphé functional connectivity declined, suggesting a possible inverse relationship between the two variables across subjects. At low frequency, the left and right thalamo-raphé functional connectivities with the raphé were highly correlated across subjects (control diet condition: r = 0.96, ATD condition r = 0.98). The raphé high frequency spectral power during the ATD diet correlated inversely across subjects with left thalamo-raphé connectivity (r = −0.67, see Supplementary Figure 3 in the online supplement), suggesting a strong association between the spectral power and functional connectivity changes across individuals.
3.7 Summary
High frequency spectral power in the region inclusive of pontine raphé increased significantly during ATD, and coincided with an observation of diminished low frequency functional connectivity between the pontine raphé region and the anterior thalamus. Across subjects, high frequency raphé spectral power was inversely correlated with low frequency functional connectivity for the left and right thalamic regions with the raphé.
4. Discussion
Using time series metrics, resting fMRI scans detected statistically significant changes in serotonin function in a pontine raphé region during dietary acute tryptophan depletion (ATD). Compared to control (balanced) diet, high-frequency spectral power from raphé signals increased significantly during ATD, while low-frequency functional connectivity for the raphé – anterior thalamus region pair decreased significantly. High-frequency spectral power in the raphé correlated inversely with low-frequency connectivity between the raphé and anterior thalamus in the ATD data set.
The increase in spectral power is consistent with findings from other modalities. Increased electroencephalographic delta power, at higher frequency (0.75 to 3.75 s−1) than that measured here, has been reported with ATD (reviewed by Fusar-Poli et al., 2006). High-frequency fluctuations observed here are close to serotonin neuronal discharge rates (about 2 s−1) observed in preclinical electrophysiology recordings (Jacobs and Fornal, 1995), suggesting that the increased spectral power may be based at least partially on intrinsic neuronally-related events.
The raphé spectral power findings can be fitted to a tentative model in which raphé serotonin availability is diminished during ATD. ATD diminishes serotonin availability, which could diminish auto-inhibitory feedback to serotonin neurons, or could diminish inhibition of activity in GABA and glutamate interneurons (Ciranna, 2006). Alternatively, intracellular homeostatic pathways restoring serotonin availability could result in an increase in cell activity. Any of these might explain increased local blood flow observed in the raphé during ATD (Morris et al., 1999). ATD did not alter occipital GABA in a magnetic resonance spectroscopy study (Selvaraj et al., 2006). Specificity of the increased activity as high frequency oscillations is not clearly explained by this model.
The diminished functional connectivity findings for the raphé with ATD are expected, since diminished serotonin availability during ATD would be expected to weaken raphé influences on target regions. That spectral power and functional connectivity are inversely correlated may imply that low frequency connectivity of a region is compromised when high frequency fluctuations in the BOLD activation signal are present in the region. Increased high-frequency spectral power was also observed in the right anterior cingulate with ATD, compared to the control diet.
4.1. Signal vs. noise in time series analyses
The neuroimaging of brainstem regions is fraught with vulnerability to physiologic artifacts, impeding block- or event-related visualizations of brainstem activity (Napadow et al., 2009). However, it has been possible to demonstrate changes in low frequency fMRI fluctuations in brainstem region activity during physiologically relevant, steady-state (non-pulsatile) behaviors such as meditation or acupuncture (Lazar et al., 2000; Napadow et al., 2005; Napadow et al., 2006; Napadow et al., 2009). The placement of acupuncture needles or the training of individuals to meditate in order to produce a contrast presents methodological challenges and limits widespread applicability. The method reported here, using time series analyses to improve noise and artifact management and with ATD providing a pharmacologic contrast, manages artifacts well, and could be easily and widely implemented. A reliable resting state fMRI measure of raphé function that manages noise well would be valuable for understanding depression pathophysiology, explaining antidepressant action mechanisms, and selecting treatments for refractory cases.
Spectral power and functional connectivity signals could result from intrinsic raphé tissue activity or artifacts. Near-infrared spectroscopy (NIRS) suggests that sources of signal oscillations include vascular autoregulation and intrinsic neuronal activity (Obrig et al., 2000). Artifacts may include movement, scanner noise and also respiration and cardiac effects specific to the brainstem. Scanner noise and head-movement artifacts can be dismissed as a source of the present findings since ATD is unlikely to affect either in a random sequence, within-subject comparison with control diet scans, and since movement during scans was cause for data exclusion.
Outside influences are unlikely to explain the increased high frequency spectral power because functional connectivity of the raphé to other regions diminished with ATD. Also, the connectivity is strongest at low frequencies (< 0.08 s-1; Biswal et al., 1997), which is unlikely to drive only high frequency activity.
The BOLD contrast indirectly assays regional neurophysiology by responding to changes in capillary blood flow and magnetic fields when oxy-hemoglobin is reduced. Cardiovascular and other physiologic artifacts could affect raphé BOLD time-series data and must be considered because they could also be affected by ATD. ATD increases raphé blood flow with 15O-positron emission tomography (PET, Morris et al., 1999), possibly due to diminished efficacy of the serotonergic plexus that controls vascular capillary beds (for review, Cohen et al., 1996). However, evidence suggests that our measurements of time-series fluctuations in raphé BOLD during ATD are likely to reflect serotonergic effects on the variability of firing rates of serotonin neurons. First, effects of ATD on vascular regulation by serotonin would be expected to affect the entire brain (Fusar-Poli et al., 2006), while our data suggest increased spectral power in only five (raphé, right anterior cingulate, right anterior thalamus, and both habenulae) of the nine regions studied. ATD did not significantly affect spectral power in the left cingulate, left thalamic, or bilateral caudate regions. Also, time-series fluctuations of BOLD signals should not be as susceptible as averaging analyses to the effects of changes in serotonin regulation of capillary blood flow. Changes in vascular tone could affect BOLD time-series amplitudes, but would not be expected to affect the frequency of the signal. Since time-series features do not quantify mean regional activity or blood flow, they may indeed reflect fluctuating properties of intrinsic regional neuronal activity.
Slight brainstem movements and pulsatile blood flow in local vasculature, driven by cardiac output (about 1 s−1), could affect BOLD signals at or in multiples of the heart rate. Booij and colleagues (2006) reported that ATD raises heart rate by 15% from baseline in subjects with prior suicidal ideation, but only 4% in the non-suicidal group. While the hemodynamic effects of heart rate (1.2 to 1.4 s−1 in the previously suicidal population) could slightly affect BOLD spectral power in brainstem regions, even the observed 15% increase in heart rate is unlikely to explain the greater than doubling of spectral power observed at the much slower frequencies of .25 to .125 s−1 measured here, although aliasing may contribute. Furthermore, detection of neuronal oscillations with our time-series measures should not be greatly influenced by heart rate or respiration, since cortical and subcortical regions oscillate slower than peripherally-driven cardiac (1 s−1) or respiratory (0.3 s−1) rhythms, as shown by paired simultaneous recordings using fMRI and NIRS, or fMRI and electroencephalography (EEG) (Moosman et al., 2003; Ritter et al., 2008). Simultaneously recorded EEG and NIRS signals show a strong correlation between neuronal activity and local blood flow (Roche-Labarbe et al., 2007) suggesting local neuronal activity origins of blood flow oscillations. Simultaneous BOLD fMRI and NIRS recordings also reveal consistent low frequency signals (Strangman et al., 2002; Steinbrink et al., 2006). Cardiac-gating techniques for brainstem studies can be helpful (Napadow et al., 2009), but remain difficult to implement compared to resting scans with fixed sampling intervals.
Other physiological processes that may influence brainstem BOLD signals include cardiac and respiratory rate regulation. These processes could produce artifact frequencies close to those accessible in conventional fMRI time-series data (about 0.03 to 0.25 s−1), almost overlapping with frequencies of ATD changes. Booij et al. (2006) reported that HRV diminished by about 26% with ATD in their previously suicidal population. Brainstem heart-controlling nuclei showed fMRI signal changes more closely related to HRV than to the pulse rate itself (Napadow et al., 2005). Changes in heart rate and arterial blood pressure account for less than half of the variance in brainstem NIRS, implying that most metabolic variability is locally regulated (Katura et al., 2006).
Respiratory movements (about 0.3 s−1) also affect brainstem fMRI. Local noise from respiratory artifacts should be separable from fMRI signal (Frank et al., 2001) although this remains more controversial for the brainstem. Variability in BOLD time-series data may be influenced by respiratory controls in the brainstem (Biswal, 1997; Obrig et al., 2000; Windischberger et al., 2002; Shmueli et al., 2007), but these are not known to be systematically altered in association with ATD.
Taken together, these observations suggest that measures of neural network oscillations are influenced more by intrinsic regional activity than by extrinsic activity, artifact or noise.
4.2 Study Limitations
Study limitations include small sample size, retrospective diagnoses, relatively weak changes in blood TRP levels, and mild mood responses to the ATD. Therefore, we emphasize the need for replication before carrying the findings forward. Timing of the scans may have missed the TRP nadir, or the increase in pontine raphé spectral power might reflect an ascent in TRP availability in the moments following the nadir, but these seem unlikely based on prior data from plasma and cerebrospinal fluid (CSF) sampling studies during ATD (Salomon et al., 2003). The relatively severe ATD state itself might be non-physiologic, perhaps provoking unnaturally reactive activities, and conceivably might not be relevant to mood regulation in depression. Changes related to low serotonin function in untreated depression will need additional study.
Participant diagnoses were deemed reliable, but with limited assurance of index illness severity. The mild mood responses to ATD are also of concern, may be related to a relatively modest lowering of TRP levels (Salomon et al., 2003; Moreno et al., 2010). The relatively weak depletion may have been related to allowing normal pre-study diets instead of the pre-study tryptophan-restricted diets given in earlier studies (Delgado et al., 1990; Delgado et al., 1994). Nonetheless, the mild mood responses do not negate the assertion that regional function was affected by the ATD diet. Without altering mood in healthy subjects, ATD affected cerebral regional activation following emotional stimuli (Cools et al., 2005; Williams et al., 2007; van der Veen et al., 2007; Fusar-Poli et al., 2007). Again without mood changes in healthy subjects, ATD altered cognition and rostral regional activity (Burgund et al., 2003; Talbot et al., 2006; Evers et al., 2005; Evers et al., 2006a; Evers et al., 2006b). To our knowledge, only one prior report has described ATD fMRI in SRI-treated, previously depressed patients. Altered cortical responses to cognitive stimuli were observed without significant mood changes (Roiser et al., 2009). Therefore, the absence of mood changes does not diminish the validity of the scan measurements.
Region identification remains a substantial concern. Manually drawn pontine raphé regions certainly include non-serotonin neurons. However, changes observed here and elsewhere with ATD, the PET evidence (Morris et al., 1999), and mRNA labeling post-suicide (Bach-Mitzrachi et al., 2006; Bach-Mitzrachi et al., 2008) offer considerable evidence supporting an association between low serotonin availability and pontine raphé serotonin function, and supporting an assertion that ATD-associated changes in serotonin function did alter spectral activity in the defined anatomical region. Therefore, the effects of ATD in this study are consistent with an assertion that the anatomically selected pontine raphé regions contain serotonin neurons, and that the findings are related to the change in serotonin function.
Findings regarding the habenula region may need to be considered even more tentative due to the very small size of this nucleus, and to the presence of distinct cell clusters forming sub-nuclei that were too small for our voxel size to detect or differentiate. However, the anatomical marker (the habenular stalk) is quite readily identifiable, and the within-subjects comparisons allowed selection of identical voxels for each scan pair.
The large expanse of the anterior thalamic region poses another caution, as it is inclusive of multiple discrete nuclei. The single slice traversing the greatest extent of the structure may not provide either the most important nuclei, or the most representative sampling of nuclei. This strategy was accepted as a first approximation in this study since our focus was primarily on raphé markers. Further, each region was limited by the use of manually drawn, anatomically defined regions within one plane of view.
4.3 Conclusions
We found an increase in high frequency spectral power in the raphé BOLD signal during ATD. Also, we observed that functional connectivity at lower frequencies between the pontine raphé and other rostral regions, especially the anterior thalamus, was quite specifically decreased with ATD. The two effects were inversely correlated. Intrinsic increases in metabolic cell cycling during ATD could produce high-frequency regional activity fluctuations. It appears, then, that high frequency activity may interfere with network connectivity at lower frequencies. Brainstem monoaminergic outputs may influence cerebral activity with low-frequency synchronizing guidance, disruptions of which by higher frequency noise may be associated with psychopathology. Further study is needed to confirm such a relationship between these two time-series findings. Prior to clinical application of this analytic method with or without ATD, comparisons of treated depressed patients with healthy controls and untreated depressed patients will be needed. Associations between time-series measures of raphé activity, mood state, and antidepressant activity will also require further study.
Supplementary Material
Acknowledgements
The authors are grateful for technical assistance from Dennis Schmidt, Rachel N. Anderson, Andrew S. Berger, and Jessica Y. McLellan. Many others, including Ronald R Price, Victoria L. Morgan, and Curtis A. Wulshensky, contributed invaluable assistance on earlier work with this paradigm. The work was supported by NARSAD, and by the Vanderbilt CTSA grant 1 UL1 RR024975 from the National Center for Research Resources, National Institutes of Health. The excellent work of the Investigational Drug Service Pharmacy at Vanderbilt University Medical Center is greatly appreciated, and we gratefully acknowledge support from the Vanderbilt University Institute of Imaging Science.
Footnotes
Publisher's Disclaimer: This is a PDF file of an unedited manuscript that has been accepted for publication. As a service to our customers we are providing this early version of the manuscript. The manuscript will undergo copyediting, typesetting, and review of the resulting proof before it is published in its final citable form. Please note that during the production process errors may be discovered which could affect the content, and all legal disclaimers that apply to the journal pertain.
Financial disclosures (for each author)
Each author has specifically denied conflicts of interest relevant to this work.
References
- Aghajanian GK, Graham AW, Sheard MH. Serotonin-containing neurons in brain: Depression of firing by monoamine oxidase inhibitors. Science. 1970;169(950):1100–1102. doi: 10.1126/science.169.3950.1100. [DOI] [PubMed] [Google Scholar]
- Bach-Mizrachi H, Underwood MD, Kassir SA, Bakalian MJ, Sibille E, Tamir H, Mann JJ, Arango V. Neuronal tryptophan hydroxylase mRNA expression in the human dorsal and median raphé nuclei: Major depression and suicide. Neuropsychopharmacology. 2006;31:814–824. doi: 10.1038/sj.npp.1300897. [DOI] [PubMed] [Google Scholar]
- Bach-Mizrachi H, Underwood MD, Tin A, Ellis SP, Mann JJ, Arango V. Elevated expression of tryptophan hydroxylase-2 mRNA at the neuronal level in the dorsal and median raphe nuclei of depressed suicides. Molecular Psychiatry. 2008;13:507–513. doi: 10.1038/sj.mp.4002143. [DOI] [PMC free article] [PubMed] [Google Scholar]
- Baker KG, Halliday GM, Törk I. Cytoarchitecture of the human dorsal raphé nucleus. Journal of Comparative Neurology. 1990;301:147–161. doi: 10.1002/cne.903010202. [DOI] [PubMed] [Google Scholar]
- Baxter LR, Jr., Phelps ME, Mazziotta JC, Schwartz JM, Gerner RH, Selin CE, Sumida RM. Cerebral metabolic rates for glucose in mood disorders: Studies with positron emission tomography and fluorodeoxyglucose F 18. Archives of General Psychiatry. 1985;42:441–447. doi: 10.1001/archpsyc.1985.01790280019002. [DOI] [PubMed] [Google Scholar]
- Bell CJ, Hood SD, Nutt DJ. Acute tryptophan depletion: Part II. clinical effects and implications. Australia and New Zealand Journal of Psychiatry. 2005;39:565–574. doi: 10.1080/j.1440-1614.2005.01628.x. [DOI] [PubMed] [Google Scholar]
- Bianciardi M, Fukunaga M, van Gelderen P, Horovitz SG, de Zwart JA, Duyn JH. Modulation of spontaneous fMRI activity in human visual cortex by behavioral state. NeuroImage. 2009;45:160–168. doi: 10.1016/j.neuroimage.2008.10.034. [DOI] [PMC free article] [PubMed] [Google Scholar]
- Biswal BB, Van Kylen J, Hyde JS. Simultaneous assessment of flow and BOLD signals in resting-state functional connectivity maps. NMR in Biomedicine. 1997;10:165–170. doi: 10.1002/(sici)1099-1492(199706/08)10:4/5<165::aid-nbm454>3.0.co;2-7. [DOI] [PubMed] [Google Scholar]
- Blier P. Pharmacology of rapid-onset antidepressant treatment strategies. Journal of Clinical Psychiatry. 2001;62(Supplement 15):12–17. [PubMed] [Google Scholar]
- Booij L, Swenne CA, Brosschot JF, Haffmans PM, Thayer JF, Van der Does AJ. Tryptophan depletion affects heart rate variability and impulsivity in remitted depressed patients with a history of suicidal ideation. Biological Psychiatry. 2006;60:507–514. doi: 10.1016/j.biopsych.2006.02.010. [DOI] [PubMed] [Google Scholar]
- Booij L, Van der Does W, Benkelfat C, Bremner JD, Cowen PJ, Fava M, Gillin C, Leyton M, Moore P, Smith KA, Van der Kloot WA. Predictors of mood response to acute tryptophan depletion: A reanalysis. Neuropsychopharmacology. 2002;27:852–861. doi: 10.1016/S0893-133X(02)00361-5. [DOI] [PubMed] [Google Scholar]
- Bremner JD, Innis RB, Salomon RM, Staib LH, Ng CK, Miller HL, Bronen RA, Krystal JH, Duncan J, Rich D, Price LH, Malison R, Dey H, Soufer R, Charney DS. Positron emission tomography measurement of cerebral metabolic correlates of tryptophan depletion-induced depressive relapse. Archives of General Psychiatry. 1997;54:364–374. doi: 10.1001/archpsyc.1997.01830160092012. [DOI] [PubMed] [Google Scholar]
- Burgund ED, Marsolek CJ, Luciana M. Serotonin levels influence patterns of repetition priming. Neuropsychology. 2003;17:161–170. [PubMed] [Google Scholar]
- Buzsáki G, Draguhn A. Neuronal oscillations in cortical networks. Science. 2004;304(5679):1926–1929. doi: 10.1126/science.1099745. [DOI] [PubMed] [Google Scholar]
- Carlsson A, Svennerholm H, Winblad B. Seasonal and circadian monoamine variations examined post-mortem. Acta Psychiatrica Scandinavica. 1980;(Supplement 280):75–85. [PubMed] [Google Scholar]
- Carter OL, Pettigrew JD, Hasler F, Wallis GM, Liu GB, Hell D, Vollenweider FX. Modulating the rate and rhythmicity of perceptual rivalry alternations with the mixed 5-HT2A and 5-HT1A agonist psilocybin. Neuropsychopharmacology. 2005;30:1154–1162. doi: 10.1038/sj.npp.1300621. [DOI] [PubMed] [Google Scholar]
- Ciranna L. Serotonin as a modulator of glutamate- and GABA-mediated neurotransmission: implications in physiological functions and in pathology. Current Neuropharmacology. 2006;4:101–114. doi: 10.2174/157015906776359540. [DOI] [PMC free article] [PubMed] [Google Scholar]
- Cohen Z, Bonvento G, Lacombe P, Hamel E. Serotonin in the regulation of brain microcirculation. Progress in Neurobiology. 1996;50:335–362. doi: 10.1016/s0301-0082(96)00033-0. [DOI] [PubMed] [Google Scholar]
- Cools R, Calder AJ, Lawrence AD, Clark L, Bullmore E, Robbins TW. Individual differences in threat sensitivity predict serotonergic modulation of amygdala response to fearful faces. Psychopharmacology (Berlin) 2005;180:670–679. doi: 10.1007/s00213-005-2215-5. [DOI] [PubMed] [Google Scholar]
- Dahlstrom A, Fuxe K. Evidence for the existence of monoamine-containing neurons in the central nervous system: I. Demonstration of monoamines in the cell bodies of brain stem neurons. Acta Physiologica Scandinavica. 1964;62(Supplement 232):1–55. [PubMed] [Google Scholar]
- Daubechies I. Ten Lectures on Wavelets; SIAM, Philadelphia. 1992. [Google Scholar]
- Delgado PL, Charney DS, Price LH, Aghajanian GK, Landis H, Heninger GR. Serotonin function and the mechanism of antidepressant action. Archives of General Psychiatry. 1990;47:411–418. doi: 10.1001/archpsyc.1990.01810170011002. [DOI] [PubMed] [Google Scholar]
- Delgado PL, Price LH, Miller HL, Salomon RM, Aghajanian GK, Heninger GR, Charney DS. Serotonin and the neurobiology of depression: Effects of tryptophan depletion in drug-free depressed patients. Archives of General Psychiatry. 1994;51:865–874. doi: 10.1001/archpsyc.1994.03950110025005. [DOI] [PubMed] [Google Scholar]
- Delgado PL, Price LH, Miller HL, Salomon RM, Licinio J, Krystal JH, Heninger GR, Charney DS. Rapid serotonin depletion as a provocative challenge test for patients with major depression: Relevance to antidepressant action and the neurobiology of depression. Psychopharmacology Bulletin. 1991;27:321–330. [PubMed] [Google Scholar]
- Evers EA, Cools R, Clark L, van der Veen FM, Jolles J, Sahakian BJ, Robbins TW. Serotonergic modulation of prefrontal cortex during negative feedback in probabilistic reversal learning. Neuropsychopharmacology. 2005;30:1138–1147. doi: 10.1038/sj.npp.1300663. [DOI] [PubMed] [Google Scholar]
- Evers EA, van der Veen FM, Jolles J, Deutz NE, Schmitt JA. Acute tryptophan depletion improves performance and modulates the BOLD response during a Stroop task in healthy females. Neuroimage. 2006a;32:248–255. doi: 10.1016/j.neuroimage.2006.03.026. [DOI] [PubMed] [Google Scholar]
- Evers EA, van der Veen FM, van Deursen JA, Schmitt JA, Deutz NE, Jolles J. The effect of acute tryptophan depletion on the BOLD response during performance monitoring and response inhibition in healthy male volunteers. Psychopharmacology (Berlin) 2006b;187:200–208. doi: 10.1007/s00213-006-0411-6. [DOI] [PubMed] [Google Scholar]
- Fadili MJ, Bullmore ET. Wavelet-generalized least squares: A new BLU estimator of linear regression models with 1/f errors. NeuroImage. 2002;15:217–232. doi: 10.1006/nimg.2001.0955. [DOI] [PubMed] [Google Scholar]
- Fadili MJ, Bullmore ET. A comparative evaluation of wavelet-based methods for hypothesis testing of brain activation maps. NeuroImage. 2004;23:1112–1128. doi: 10.1016/j.neuroimage.2004.07.034. [DOI] [PubMed] [Google Scholar]
- Frank LR, Buxton RB, Wong EC. Estimation of respiration-induced noise fluctuations from undersampled multislice fMRI data. Magnetic Resonance Medicine. 2001;45:635–644. doi: 10.1002/mrm.1086. [DOI] [PubMed] [Google Scholar]
- Fukunaga M, Horovitz SG, van Gelderen P, de Zwart JA, Jansma JM, Ikonomidou VN, Chu R, Deckers RHR, Leopold DA, Duyn JH. Large-amplitude, spatially correlated fluctuations in BOLD fMRI signals during extended rest and early sleep stages. Magnetic Resonance Imaging. 2006;24:979–992. doi: 10.1016/j.mri.2006.04.018. [DOI] [PubMed] [Google Scholar]
- Fusar-Poli P, Allen P, Lee F, Surguladze S, Tunstall N, Fu CH, Brammer MJ, Cleare AJ, McGuire PK. Modulation of neural response to happy and sad faces by acute tryptophan depletion. Psychopharmacology (Berlin) 2007;193:31–44. doi: 10.1007/s00213-007-0757-4. [DOI] [PubMed] [Google Scholar]
- Fusar-Poli P, Allen P, McGuire P, Placentino A, Cortesi M, Perez J. Neuroimaging and electrophysiological studies of the effects of acute tryptophan depletion: A systematic review of the literature. Psychopharmacology (Berlin) 2006;188:131–143. doi: 10.1007/s00213-006-0493-1. [DOI] [PubMed] [Google Scholar]
- Garrett DD, Kovacevic N, McIntosh AR, Grady CL. Blood oxygen level-dependent signal variability is more than just noise. Journal of Neuroscience. 2010;30:4914–4921. doi: 10.1523/JNEUROSCI.5166-09.2010. [DOI] [PMC free article] [PubMed] [Google Scholar]
- Hamilton M. A rating scale for depression. Journal of Neurology, Neurosurgery and Psychiatry. 1960;23:56–62. doi: 10.1136/jnnp.23.1.56. [DOI] [PMC free article] [PubMed] [Google Scholar]
- Hobson JA, McCarley RW, Freedman R, Pivik RT. Time course of discharge rate changes by cat pontine brain stem neurons during sleep cycle. Journal of Neurophysiology. 1974;37:1297–1309. doi: 10.1152/jn.1974.37.6.1297. [DOI] [PubMed] [Google Scholar]
- Jacobs BL, Azmitia EC. Structure and function of the brain serotonergic system. Physiology Reviews. 1992;72:165–229. doi: 10.1152/physrev.1992.72.1.165. [DOI] [PubMed] [Google Scholar]
- Jacobs BL, Fornal CA. Activity of brain serotonergic neurons in the behaving animal. Pharmacology Reviews. 1991;43:563–578. [PubMed] [Google Scholar]
- Jacobs BL, Fornal CA. Serotonin and behavior: A general hypothesis. In: Bloom FE, Kupfer DJ, editors. Psychopharmacology: The Fourth Generation of Progress. Raven Press; New York: 1995. pp. 461–469. [Google Scholar]
- Katura T, Tanaka N, Obata A, Sato H, Maki A. Quantitative evaluation of interrelations between spontaneous low-frequency oscillations in cerebral hemodynamics and systemic cardiovascular dynamics. NeuroImage. 2006;31:1592–1600. doi: 10.1016/j.neuroimage.2006.02.010. [DOI] [PubMed] [Google Scholar]
- Lazar SW, Bush G, Gollub RL, Fricchione GL, Khalsa G, Benson H. Functional brain mapping of the relaxation response and meditation. NeuroReport. 2000;11:1581–1585. [PubMed] [Google Scholar]
- Logothetis NK. The neural basis of the blood-oxygen-level-dependent functional magnetic resonance imaging signal. Philosophical Transactions of the Royal Society of London B, Biological Sciences. 2002;357(1424):1003–1037. doi: 10.1098/rstb.2002.1114. [DOI] [PMC free article] [PubMed] [Google Scholar]
- Lowry CA. Functional subsets of serotonergic neurones: Implications for control of the hypothalamic-pituitary-adrenal axis. Journal of Neuroendocrinology. 2002;14:911–923. doi: 10.1046/j.1365-2826.2002.00861.x. [DOI] [PubMed] [Google Scholar]
- Lydic R, McCarley RW, Hobson JA. Forced activity alters sleep cycle periodicity and dorsal raphe discharge rhythm. American Journal of Physiology. 1984;247(1):R135–145. doi: 10.1152/ajpregu.1984.247.1.R135. Part 2. [DOI] [PubMed] [Google Scholar]
- Maes M, Meltzer HY. The serotonin hypothesis of major depression. In: Bloom FE, Kupfer DJ, editors. Psychopharmacology: The Fourth Generation of Progress. Raven Press; New York: 1995. pp. 933–944. [Google Scholar]
- Marazziti D, Falcone MF, Castrogiovanni P, Cassano GB. Seasonal serotonin uptake changes in healthy subjects. Molecular and Chemical Neuropathology. 1990;13:145–154. doi: 10.1007/BF03159915. [DOI] [PubMed] [Google Scholar]
- Marx E, Deutschländer A, Stephan T, Dieterich M, Wiesmann M, Brandt T. Eyes open and eyes closed as rest conditions: Impact on brain activation patterns. NeuroImage. 2004;21:1818–1824. doi: 10.1016/j.neuroimage.2003.12.026. [DOI] [PubMed] [Google Scholar]
- Mayberg HS. Targeted electrode-based modulation of neural circuits for depression. Journal of Clinical Investigation. 2009;119:717–725. doi: 10.1172/JCI38454. [DOI] [PMC free article] [PubMed] [Google Scholar]
- Mayberg HS, Liotti M, Brannan SK, McGinnis S, Mahurin RK, Jerabek PA, Silva JA, Tekell JL, Martin CC, Lancaster JL, Fox PT. Reciprocal limbic-cortical function and negative mood: Converging PET findings in depression and normal sadness. American Journal of Psychiatry. 1999;156:675–682. doi: 10.1176/ajp.156.5.675. [DOI] [PubMed] [Google Scholar]
- McAvoy M, Larson-Prior L, Nolan TS, Vaishnavi SN, Raichle ME, d’Avossa G. Resting states affect spontaneous BOLD oscillations in sensory and paralimbic cortex. Journal of Neurophysiology. 2008;100:922–931. doi: 10.1152/jn.90426.2008. [DOI] [PMC free article] [PubMed] [Google Scholar]
- Meyer JH. Imaging the serotonin transporter during major depressive disorder and antidepressant treatment. Journal of Psychiatry and Neuroscience. 2007;32:86–102. [PMC free article] [PubMed] [Google Scholar]
- Moore P, Landolt HP, Seifritz E, Clark C, Bhatti T, Kelsoe J, Rapaport M, Gillin JC. Clinical and physiological consequences of rapid tryptophan depletion. Neuropsychopharmacology. 2000;23:601–622. doi: 10.1016/S0893-133X(00)00161-5. [DOI] [PubMed] [Google Scholar]
- Moore RY, Halaris AE, Jones BE. Serotonin neurons of the midbrain raphe: Ascending projections. The Journal of Comparative Neurology. 1978;180:417–438. doi: 10.1002/cne.901800302. [DOI] [PubMed] [Google Scholar]
- Moosman M, Ritter P, Krastel I, Brink A, Thees S, Blankenburg F, Taskin B, Obrig H, Villringer A. Correlates of alpha rhythm in functional magnetic resonance imaging and near infrared spectroscopy. NeuroImage. 2003;20:145–158. doi: 10.1016/s1053-8119(03)00344-6. [DOI] [PubMed] [Google Scholar]
- Moreno FA, Parkinson D, Palmer C, Castro WL, Misiaszek J, El Khoury A, Mathé AA, Wright R, Delgado PL. CSF neurochemicals during tryptophan depletion in individuals with remitted depression and healthy controls. European Neuropsychopharmacology. 2010;20:18–24. doi: 10.1016/j.euroneuro.2009.10.003. [DOI] [PMC free article] [PubMed] [Google Scholar]
- Morris JS, Smith KA, Cowen PJ, Friston KJ, Dolan RJ. Covariation of activity in habenula and dorsal raphé nuclei following tryptophan depletion. NeuroImage. 1999;10:163–172. doi: 10.1006/nimg.1999.0455. [DOI] [PubMed] [Google Scholar]
- Mosko SS, Jacobs BL. Recording of dorsal raphé unit activity in vitro. Neuroscience Letters. 1976;2:195–200. doi: 10.1016/0304-3940(76)90014-8. [DOI] [PubMed] [Google Scholar]
- Napadow V, Dhond R, Kennedy D, Hui KK, Makris N. Automated brainstem co-registration (ABC) for MRI. NeuroImage. 2006;32:1113–1119. doi: 10.1016/j.neuroimage.2006.05.050. [DOI] [PubMed] [Google Scholar]
- Napadow V, Dhond R, Park K, Kim J, Makris N, Kwong KK, Harris RE, Purdon PL, Kettner N, Hui KKS. Time-variant fMRI activity in the brainstem and higher structures in response to acupuncture. NeuroImage. 2009;47:289–301. doi: 10.1016/j.neuroimage.2009.03.060. [DOI] [PMC free article] [PubMed] [Google Scholar]
- Napadow V, Dhond RP, Purdon P, Kettner N, Makris N, Kwong KK, Hui KK. Correlating acupuncture FMRI in the human brainstem with heart rate variability; Conference Proceedings of the IEEE Engineering Medicine Biology Society; 2005; pp. 4496–4499. [DOI] [PubMed] [Google Scholar]
- Neumeister A, Nugent AC, Waldeck T, Geraci M, Schwarz M, Bonne O, Bain EE, Luckenbaugh DA, Herscovitch P, Charney DS, Drevets WC. Neural and behavioral responses to tryptophan depletion in unmedicated patients with remitted major depressive disorder and controls. Archives of General Psychiatry. 2004;61:765–773. doi: 10.1001/archpsyc.61.8.765. [DOI] [PubMed] [Google Scholar]
- Obrig H, Neufang M, Wenzel R, Kohl M, Steinbrink J, Einhäupl K, Villringer A. Spontaneous low frequency oscillations of cerebral hemodynamics and metabolism in human adults. NeuroImage. 2000;12:623–639. doi: 10.1006/nimg.2000.0657. [DOI] [PubMed] [Google Scholar]
- Ogawa S, Lee TM, Kay AR, Tank DW. Brain magnetic resonance imaging with contrast dependent on blood oxygenation. Proceedings of the National Academy of Science, U. S. A. 1990;87:9868–9872. doi: 10.1073/pnas.87.24.9868. [DOI] [PMC free article] [PubMed] [Google Scholar]
- Ritter P, Freyer F, Curio G, Villringer A. High-frequency (600 Hz) population spikes in human EEG delineate thalamic and cortical fMRI activation sites. NeuroImage. 2008;42:483–490. doi: 10.1016/j.neuroimage.2008.05.026. [DOI] [PubMed] [Google Scholar]
- Roche-Labarbe N, Wallois F, Ponchel E, Kongolo G, Grebe R. Coupled oxygenation oscillation measured by NIRS and intermittent cerebral activation on EEG in premature infants. NeuroImage. 2007;36:718–727. doi: 10.1016/j.neuroimage.2007.04.002. [DOI] [PubMed] [Google Scholar]
- Roiser JP, Levy J, Fromm SJ, Nugent AC, Talagala SL, Hasler G, Henn FA, Sahakian BJ, Drevets WC. The effects of tryptophan depletion on neural responses to emotional words in remitted depression. Biological Psychiatry. 2009;66:441–450. doi: 10.1016/j.biopsych.2009.05.002. [DOI] [PMC free article] [PubMed] [Google Scholar]
- Roy A, Adinoff B, DeJong J, Linnoila M. Cerebrospinal fluid variables among alcoholics lack seasonal variation. Acta Psychiatrica Scandinavica. 1991;84:579–82. doi: 10.1111/j.1600-0447.1991.tb03199.x. [DOI] [PubMed] [Google Scholar]
- Salomon RM, Johnson BW, Schmidt DE. Central neurochemical ultradian variability in depression. Disease Markers. 2006;22:65–72. doi: 10.1155/2006/240980. [DOI] [PMC free article] [PubMed] [Google Scholar]
- Salomon RM, Kennedy JS, Johnson BW, Schmidt DE, Kwentus J, Gwirtsman HE, Ebert MH. Association of a critical CSF tryptophan threshold level with depressive relapse. Neuropsychopharmacology. 2003;28:956–960. doi: 10.1038/sj.npp.1300098. [DOI] [PubMed] [Google Scholar]
- Salomon RM, Kennedy JS, Johnson BW, Urbano Blackford J, Schmidt DE, Kwentus J, Gwirtsman HE, Gouda JF, Shiavi RG. Treatment enhances ultradian rhythms of CSF monoamine metabolites in patients with major depressive episodes. Neuropsychopharmacology. 2005;30:2082–2091. doi: 10.1038/sj.npp.1300746. [DOI] [PubMed] [Google Scholar]
- Salomon RM, Miller HL, Delgado PL, Charney D. The use of tryptophan depletion to evaluate central serotonin function in depression and other neuropsychiatric disorders. International Clinical Psychopharmacology. 1993;8(Supplement 2):41–46. doi: 10.1097/00004850-199311002-00006. [DOI] [PubMed] [Google Scholar]
- Selvaraj S, Wylezinska M, Evans J, Jezzard P, Matthews PM, Cowen PJ. Tryptophan depletion does not lower brain GABA levels in healthy volunteers. Psychopharmacology (Berlin) 2006;187:131–132. doi: 10.1007/s00213-006-0407-2. [DOI] [PubMed] [Google Scholar]
- Sheehan DV, Lecrubier Y, Sheehan KH, Amorim P, Janavs J, Weiller E, Hergueta T, Baker R, Dunbar GC. The Mini-International Neuropsychiatric Interview (M.I.N.I.): The development and validation of a structured diagnostic psychiatric interview for DSM-IV and ICD-10. Journal of Clinical Psychiatry. 1998;59(Supplement 20):22–33. [PubMed] [Google Scholar]
- Sheu YS, Nelson JP, Bloom FE. Discharge patterns of cat raphé neurons during sleep and waking. Brain Research. 1974;73:263–276. doi: 10.1016/0006-8993(74)91048-8. [DOI] [PubMed] [Google Scholar]
- Shmueli K, van Gelderen P, de Zwart JA, Horovitz SG, Fukunaga M, Jansma JM, Duyn JH. Low-frequency fluctuations in the cardiac rate as a source of variance in the resting-state fMRI BOLD signal. NeuroImage. 2007;38:306–320. doi: 10.1016/j.neuroimage.2007.07.037. [DOI] [PMC free article] [PubMed] [Google Scholar]
- Steinbrink J, Villringer A, Kempf F, Haux D, Boden S, Obrig H. Illuminating the BOLD signal: Combined fMRI-fNIRS studies. Magnetic Resonance Imaging. 2006;24:495–505. doi: 10.1016/j.mri.2005.12.034. [DOI] [PubMed] [Google Scholar]
- Strangman G, Culver JP, Thompson JH, Boas DA. A quantitative comparison of simultaneous BOLD fMRI and NIRS recordings during functional brain activation. NeuroImage. 2002;17:719–731. [PubMed] [Google Scholar]
- Talbot PS, Watson DR, Barrett SL, Cooper SJ. Rapid tryptophan depletion improves decision-making cognition in healthy humans without affecting reversal learning or set shifting. Neuropsychopharmacology. 2006;31:1519–1525. doi: 10.1038/sj.npp.1300980. [DOI] [PubMed] [Google Scholar]
- van der Does AJW. The effects of tryptophan depletion on mood and psychiatric symptoms. Journal of Affective Disorders. 2001;64:107–119. doi: 10.1016/s0165-0327(00)00209-3. [DOI] [PubMed] [Google Scholar]
- Vandermaelen CP, Aghajanian GK. Electrophysiological and pharmacological characterization of serotonergic dorsal raphé neurons recorded extracellularly and intracellularly in rat brain slices. Brain Research. 1983;289:109–119. doi: 10.1016/0006-8993(83)90011-2. [DOI] [PubMed] [Google Scholar]
- van der Veen FM, Evers EA, Deutz NE, Schmitt JA. Effects of acute tryptophan depletion on mood and facial emotion perception related brain activation and performance in healthy women with and without a family history of depression. Neuropsychopharmacology. 2007;32:216–224. doi: 10.1038/sj.npp.1301212. [DOI] [PubMed] [Google Scholar]
- Vertes RP. An analysis of ascending brain stem systems involved in hippocampal synchronization and desynchronization. Journal of Neurophysiology. 1981;46:1140–1159. doi: 10.1152/jn.1981.46.5.1140. [DOI] [PubMed] [Google Scholar]
- Williams JH, Perrett DI, Waiter GD, Pechey S. Differential effects of tryptophan depletion on emotion processing according to face direction. Social, Cognitive and Affective Neuroscience. 2007;2:264–273. doi: 10.1093/scan/nsm021. [DOI] [PMC free article] [PubMed] [Google Scholar]
- Windischberger C, Langenberger H, Sycha T, Tschernko EM, Fuchsjäger-Mayerl G, Schmetterer L, Moser E. On the origin of respiratory artifacts in BOLD-EPI of the human brain. Magnetic Resonance Imaging. 2002;20:575–582. doi: 10.1016/s0730-725x(02)00563-5. [DOI] [PubMed] [Google Scholar]
- Wink AM, Hoogduin H, Roerdink JB. Data-driven haemodynamic response function extraction using Fourier-wavelet regularised deconvolution. BMC Med Imaging. 2008;8:7. doi: 10.1186/1471-2342-8-7. [DOI] [PMC free article] [PubMed] [Google Scholar]
- Young SN, Smith SE, Pihl RO, Ervin FR. Tryptophan depletion causes a rapid lowering of mood in normal males. Psychopharmacology (Berlin) 1985;87:173–177. doi: 10.1007/BF00431803. [DOI] [PubMed] [Google Scholar]
- Zeitzer JM, Maidment NT, Behnke EJ, Ackerson LC, Fried I, Engel J, Jr., Wilson CL. Ultradian sleep-cycle variation of serotonin in the human lateral ventricle. Neurology. 2002;50:1272–1274. doi: 10.1212/wnl.59.8.1272. [DOI] [PubMed] [Google Scholar]
Associated Data
This section collects any data citations, data availability statements, or supplementary materials included in this article.