Abstract
Purpose
To demonstrate the utility of Emergency Department syndromic surveillance in the setting of a novel and unexpected H1N1 influenza outbreak.
Basic procedures
Data collection from emergency department electronic medical records was used to track initial Chief Complaint (CC) and discharge ICD-9 codes related to Influenza Like Illness (ILI). An alert threshold was generated using cumulative sum sequential analysis technique. The data was retrospectively analyzed to identify alerts that correlated with Novel Influenza H1N1 illness.
Main Findings
Our system alerted for ILI earlier than both the official national CDC press release for novel H1N1 and the first laboratory confirmed case in our county.
Principal conclusions
Emergency Department syndromic surveillance can be used to detect novel and unexpected ILI before laboratory confirmation and serve as an adjunct to traditional laboratory guided public health alerts. Early identification of increased ILI activity may allow emergency department health care providers the ability to perform more efficient and effective targeted laboratory testing and deploy isolation measures more quickly.
Keywords: H1N1 Virus, Swine-Origin Influenza A H1N1 Virus, Syndromic Surveillance, Emergency Medicine, Public Health Surveillance
Introduction
Syndromic surveillance is an adjunct to traditional public health surveillance that allows epidemiologists and infectious disease practitioners to identify acute disease outbreaks by monitoring groupings of health care data such as ICD-9 or chief complaints. Examples of such groupings include Influenza-Like-Illness (ILI), Respiratory and Gastrointestinal syndromes(1; 2). Syndromic surveillance also relies on many pre-diagnostic data sources such as as over-the-counter pharmaceutical sales, school or work absenteeism, calls to health care hot-lines and visits to health care providers to identify potential disease outbreaks (3-5). Historically, Emergency Department (ED) health care data has been shown to be useful for public health disease surveillance (2; 6; 7) Emergency Department surveillance systems can not only provide early warning to public health officials but provide advanced warning of unusual trends in illness to ED personnel allowing more timely, proactive steps in patient isolation and situational awareness.
Emergency Departments are often the front lines of health care for many who become seriously ill, are unable to be acutely seen by a primary care provider or are uninsured. Thus, Emergency Departments see a wide range of acute illness and will undoubtedly be involved in the evaluation and treatment of those who are acutely ill during a local disease outbreak, epidemic or pandemic. In addition to caring for a variety of disease, emergency physicians are under increasing pressure to limit laboratory testing to provide more cost effective medicine.
Activity for the early 2008-2009 influenza season was typical with a rise in activity noted in early January. Activity peaked from the 6th through the 8th week of 2009 with the predominant types being seasonal A (H1N1) and Influenza B. During the 15th week of influenza season the accounts of influenza continued to trend downward and it appeared that the influenza season would soon be over.
On April 23rd, 2009, during the 16th week of influenza season, a CDC press release informed the public of an unusual outbreak of ILI that was identified in Mexico. Two additional cases were identified in the southwestern United States. This causative agent was later identified as a novel H1N1 virus (8-11). The emergence and rapid spread of this novel virus would later prompt the World Health Organization to declare a new Influenza Pandemic.
Influenza pandemics have occurred three times in the past century; in 1918-19, 1957-58, and 1968-69. Historically these pandemics have been preceded by a mild form of the virus in the spring with the more virulent virus disseminating in fall. This early phase of the current H1N1 pandemic may be a precursor to more serious and widespread activity of the influenza virus later this year.
The purpose of this article is to describe the performance of Emergency Department syndromic surveillance for ILI during the novel H1N1 Influenza outbreak. Emergency Department syndromic surveillance may serve as a more timely notification system alerting public health and medical professionals to novel and unexpected disease patterns. Thus, such systems may allow Emergency Department personnel to be more proactive in patient isolation and implement more efficient and appropriate testing.
Methods
This study was performed in an urban academic emergency department with an annual volume of approximately 40,000 patients. Documentation at our facility is done through EPIC ASAP (Epic Systems Corporation Madison WI). Patient data including chief complaint and diagnosis are entered at the time of initial presentation and discharge, respectively. All diagnosis are automatically linked through the electronic medical record (EMR) to ICD-9 codes resulting in real time availability of such codes for syndromic surveillance. A standardized list of both chief complaints and diagnostic codes are embedded in the EMR.
A limited data set including patient encounter date, time, age, chief complaint and ICD-9 discharge diagnosis are automatically and securely transferred to our surveillance server via the Secure File Transfer Protocol by 10 a.m. every morning. Unique HIPAA patient identifiers such as medical record number or date of birth are not included in the data set. Surveillance data is transferred in Comma Separated Value (CSV) file format and reflects the previous 24 hours of Emergency Department patient encounters. The file is automatically imported into a MySQL open source database.
Data was retrospectively gathered from September 1, 2008 through May 27th, 2009. The database was queried to count daily chief complaint and discharge diagnosis related to ILI. The definitions used for this study are listed in Table 1 and 2. ICD-9 codes were based on and modified from CDC syndrome definitions for ILI. Chief complaints were chosen from a standardized list embedded in the EMR to best reflect ILI. The sum of the Chief Complaints or ICD-9 codes were reported for each day. For example, 4 complaints of cough, 3 fever and 3 muscle aches within a 24 hour time frame would result in an ILI syndrome count of 10 for that day. The same was performed for the ICD-9 data stream. This information was exported back into CSV file format.
Table 1.
Any one of the listed diagnostic codes would generate a syndrome count for the patient encounter
| Influenza-Like-Illness ICD-9 Syndrome Definition | |
|---|---|
| 487.00 | INFLUENZA WITH PNEUMONIA |
| 487.10 | INFLUENZA W/OTH RESP MA |
| 487.80 | INFLUENZA W/OTHER MANIFEST |
| 79.99 | VIRAL INFECTIONS UNSPECIFIED |
| 79.89 | VIRAL INFECTION OTHER S |
| 780.60 | FEVER |
| 490.00 | BRONCHITIS NOS |
| 486.00 | PNEUMONIA NOS |
| 465.80 | URI OTHER MUL SITES |
| 465.90 | URI ACUTE NOS |
| 466.00 | BRONCHITIS ACUTE |
| 786.20 | COUGH |
| 460.00 | NASOPHARYNGITIS ACUTE |
| 485.00 | BRONCHOPNEUMONIA ORGANISM |
| 461.90 | ACUTE SINUSITIS UNSPECIFIED |
| 466.19 | BRONCHITIS ACUTE DT OTHER ORGANISM |
Table 2.
Any one of the listed complaints would generate a syndrome count for the patient encounter
| Influenza-Like-Illness Chief Complaint Syndrome Definition |
|---|
| Fever |
| Cough |
| Headache |
| Fatigue/Malaise |
| Muscle Pain |
| URI Symptoms |
| Viral Illness |
| Body Aches |
| Sore Throat |
| Chills |
A modified sequential analysis technique CUSUM (cumulative sum) was used to calculate an alert threshold for the date of interest (12). This alert threshold was compared to the date of interest’s actual counts. If the date of interest’s counts equaled or exceed the alert threshold an alert was generated.
In order to determine the alert value, the previous 7 consecutive day’s average syndrome counts, displaced by 3 days, was used to calculate the threshold. For example, if the date of interest was October 15th than the average of the daily counts from October 6th through 12th were used in the calculation. The 7 day data range was displaced by 3 days in order to decrease the dilutional effect of any gradual consecutive rise in counts near the day of interest. Common thresholds of 2.5 – 3 times the standard deviations above the mean are used for heightened and routine syndromic surveillance. Values closer to 3 reduce false positive alerts but also decrease sensitivity of the surveillance system. Our alert threshold was defined as 2.5 Standard Deviations above the calculated mean. (Figure 1)
Figure 1.

Example of calculation of Alert Threshold using a modified CuSUM technique.
A computer program was written in the PHP programming language (www.php.net) to read daily syndrome counts from the CSV file, calculate the alert threshold and flag if the daily count met or exceeded the threshold. Graphs representing daily syndrome counts and alert dates were generated using the R statistical package version 2.8.0 (R Foundation for Statistical Computing).
Results
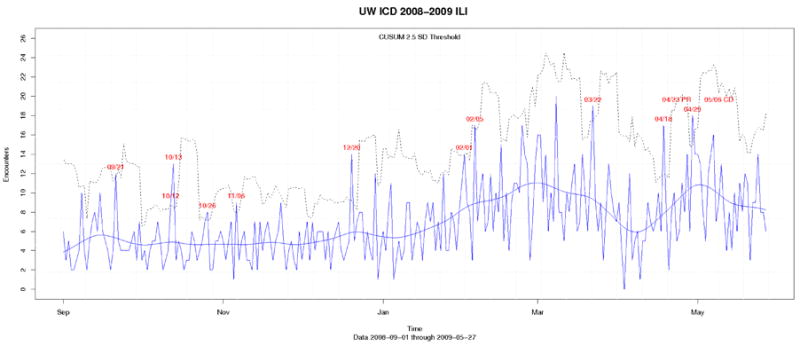
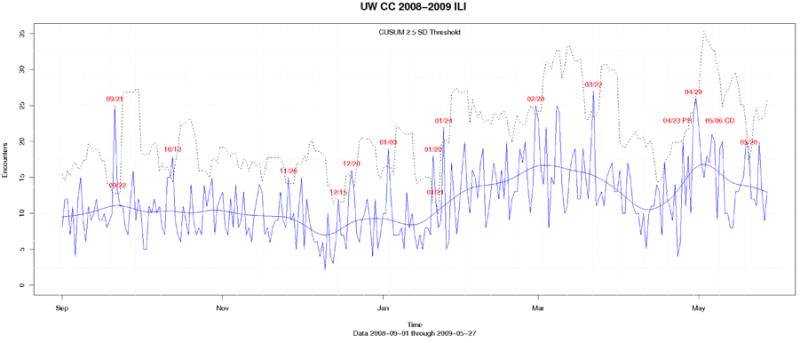
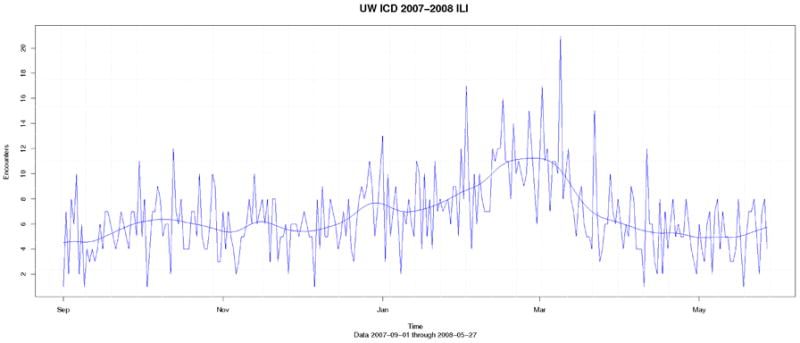
Alerts for ILI occurred on April 18th (Daily Count 17 / Alert Threshold 12) and 29th (Daily Count 18 / Alert Threshold 15) using the ICD-9 data stream. These alerts were associated with a overall increase in ICD-9 ILI associated diagnosis over the previous 2 weeks. The April 18th alert occurred 5 days prior to the first official CDC press release on April 23rd 2009 (PR) and 18 days prior to the first confirmed case of novel H1N1 in our county on May 6th 2009 (CD). (Figure 2). An alert for ILI using the Chief Complaint data stream (Daily Count 24 / Alert Threshold 24) coincided with the April 29th ICD-9 signal and occurred 7 days prior to the first laboratory confirmed case if H1N1 in our county (Figure 3). Data from the 2007-2008 seasonal influenza season is included as an example of disease activity in a typical flu season (Figure 4).
Figure 2. ICD-9 Data Stream for 2008-2009 Influenza Season.

This figure shows the daily counts, the CUSUM line (______) and the CUSUM + 2.5 standard deviation alerting threshold line (….) . Exceeded alert threshold dates are depicted in red. First alert for H1N1 season occurred on April 18th, the second alert occurred on April 29th. The CDC press release for H1N1 cases in the United States occurred on April 23rd (PR), and the first laboratory confirmed case occurred on May 6th. (CD)”
Figure 3. Chief Complaint Data Stream for 2008-2009 Influenza Season.

This figure shows the daily counts of ILI chief complaint, the CUSUM line (______) and the CUSUM + 2.5 standard deviation alerting threshold line (….) . Exceeded alert threshold dates are depicted in red. The only alert for H1N1 season occurred on April 29th. The CDC press release for H1N1 cases in the United States occurred on April 23rd (PR), and the first laboratory confirmed case occurred on May 6th (CD).
Figure 4.

ILI activity for typical influenza season 2007-2008
Discussion
Syndromic surveillance using Chief Complaint and ICD-9 discharge diagnosis indicated a rise in ILI activity one to two weeks earlier than laboratory confirmation of cases of novel H1N1 in our county. This has important implications for emergency department operation and public health in the detection of unexpected disease outbreaks.
Traditional surveillance methods rely heavily on laboratory testing and physician reporting of disease activity. Emergency physicians often rely on clinical acumen in order to minimize testing and expense. In fact, the CDC recommends that testing be prioritized for those with severe respiratory illness and those at highest risk of complications from influenza (13). This may lead to delayed and under-reporting of new disease activity of an unexpected outbreak. Advanced warning generated by syndromic surveillance systems for ILI may allow health care providers and public health officials to perform more efficient and early laboratory testing for respiratory illness.
Several hospital systems have advanced integrated syndromic surveillance that use real time emergency department or telephone triage chief complaints to alert public health officials to potential disease outbreaks. There has been retrospective demonstration of the early warning benefit of using emergency department discharge diagnoses compared to traditional laboratory testing surveillance for influenza (14). With the implementation of statistical methods for space-time cluster detection, such as cumulative sum (CUSUM) analysis, practitioners and public health officials can prospectively analyze emergency department data generated in real-time (15). To our knowledge this manuscript is the first to describe how a syndromic surveillance system can work in an unexpected influenza outbreak.
The CUSUM method was effective in identifying statistically significant spikes in ILI activity; however, the alarms were considered to be true positives only when associated with an increasing trend. There were several false positives throughout the year that were not correlated with a confirmed influenza outbreak. Thus, human analysis of the data associated with an alert is necessary to determine the likelihood of a true outbreak.
While the CUSUM method was effective in identifying aberrant spikes in ILI activity, attention to graphical trends is also central to effective monitoring for disease. A large increase in ILI activity was identified on 04/18/2009 within the ICD-9 data stream. Fortunately, this abrupt increase in counts occurred during the early increase in slope of the graph. This was not the case within the chief complaint data stream where an abrupt rise in activity occurred near the apex of activity. Early identification of aberrant ILI activity could also have been detected by daily visual inspection of the graphs noting a gradual but significant rise in counts.
Increased Emergency Department visits for respiratory illness may be attributed to the widespread press coverage of the novel H1N1 virus. However, our system demonstrated an upward trend and also alerted 5 days prior to the CDC press release. Thus, this makes a false positive trend of worried well unlikely.
We postulate that the addition of syndromic surveillance to traditional surveillance methods can enhance disease outbreak detection. Advanced warning generated by such systems for ILI may allow health care providers to perform more efficient and early laboratory testing for disease confirmation or identification of new strains of respiratory pathogens.
Early detection may also increase vigilance within the emergency department by prompting health care providers to place patients in respiratory isolation and increase use of personal protective equipment. This may decrease transmission of both common respiratory viruses and potentially more serious pathogens both among patients and health care workers. Appropriate safeguards may decrease provider illness and decrease the likelihood of staff shortages during an outbreak. If such systems are linked to public health, early identification of a rise in ILI activity may prompt more aggressive and appropriate investigation of disease outbreaks.
Acknowledgments
Supported from a pilot project grant University of Wisconsin Department of Medicine
References
- 1.Cooper DL, Verlander NQ, Smith GE, Charlett A, Gerard E, Willocks L, O’Brien S. Can syndromic surveillance data detect local outbreaks of communicable disease? A model using a historical cryptosporidiosis outbreak. Epidemiol Infect. 2006 Feb;134(1):13–20. doi: 10.1017/S0950268805004802. [DOI] [PMC free article] [PubMed] [Google Scholar]
- 2.Lemay R, Mawudeku A, Shi Y, Ruben M, Achonu C. Syndromic surveillance for influenzalike illness. Biosecur Bioterror. 2008 Jun;6(2):161–70. doi: 10.1089/bsp.2007.0056. [DOI] [PubMed] [Google Scholar]
- 3.Marx MA, Rodriguez CV, Greenko J, Das D, Heffernan R, Karpati AM, Mostashari F, Balter S, Layton M, Weiss D. Diarrheal illness detected through syndromic surveillance after a massive power outage: New York City, August 2003. Am J Public Health. 2006 Mar;96(3):547–553. doi: 10.2105/AJPH.2004.061358. [DOI] [PMC free article] [PubMed] [Google Scholar]
- 4.Das D, Metzger K, Heffernan R, Balter S, Weiss D, Mostashari F. Monitoring over-the-counter medication sales for early detection of disease outbreaks--New York City. MMWR Morb Mortal Wkly Rep. 2005 Aug 26;54(Suppl):41–46. [PubMed] [Google Scholar]
- 5.Besculides M, Heffernan R, Mostashari F, Weiss D. Evaluation of school absenteeism data for early outbreak detection, New York City. BMC Public Health. 2005:5105. doi: 10.1186/1471-2458-5-105. [DOI] [PMC free article] [PubMed] [Google Scholar]
- 6.Fleischauer AT, Silk BJ, Schumacher M, Komatsu K, Santana S, Vaz V, Wolfe M, Hutwagner L, Cono J, Berkelman R, Treadwell T. The validity of chief complaint and discharge diagnosis in emergency department-based syndromic surveillance. Acad Emerg Med. 2004 Dec;11(12):1262–7. doi: 10.1197/j.aem.2004.07.013. [DOI] [PubMed] [Google Scholar]
- 7.Townes JM, Kohn MA, Southwick KL, Bangs CA, Zechnich AD, Magnuson JA, Jui J. Investigation of an electronic emergency department information system as a data source for respiratory syndrome surveillance. J Public Health Manag Pract. 10(4):299–307. doi: 10.1097/00124784-200407000-00006. [DOI] [PubMed] [Google Scholar]
- 8.Baden LR, Drazen JM, Kritek PA, Curfman GD, Morrissey S, Campion EW. H1N1 influenza A disease--information for health professionals. N Engl J Med. 2009 Jun 18;360(25):2666–2667. doi: 10.1056/NEJMe0903992. [DOI] [PubMed] [Google Scholar]
- 9.Dawood FS, Jain S, Finelli L, Shaw MW, Lindstrom S, Garten RJ, Gubareva LV, Xu X, Bridges CB, Uyeki TM. Emergence of a novel swine-origin influenza A (H1N1) virus in humans. N Engl J Med. 2009 Jun 18;360(25):2605–2615. doi: 10.1056/NEJMoa0903810. [DOI] [PubMed] [Google Scholar]
- 10.Miller MA, Viboud C, Balinska M, Simonsen L. The signature features of influenza pandemics--implications for policy. N Engl J Med. 2009 Jun 18;360(25):2595–2598. doi: 10.1056/NEJMp0903906. [DOI] [PubMed] [Google Scholar]
- 11.Update: novel influenza A (H1N1) virus infections - worldwide, May 6, 2009. MMWR Morb Mortal Wkly Rep. 2009 May 8;58(17):453–458. [PubMed] [Google Scholar]
- 12.Hutwagner LC, Thompson WW, Seeman GM, Treadwell T. A simulation model for assessing aberration detection methods used in public health surveillance for systems with limited baselines. Stat Med. 2005 Feb 28;24(4):543–550. doi: 10.1002/sim.2034. [DOI] [PubMed] [Google Scholar]
- 13.CDC H1N1 Flu. Interim Guidance for Clinicians on Identifying and Caring for Patients with Swine-origin Influenza A (H1N1) Virus Infection [Internet] [cited 2009 Jul 24 ] Available from: http://www.cdc.gov/h1n1flu/identifyingpatients.htm.
- 14.Zheng W, Aitken R, Muscatello DJ, Churches T. Potential for early warning of viral influenza activity in the community by monitoring clinical diagnoses of influenza in hospital emergency departments. BMC Public Health. 2007:7250. doi: 10.1186/1471-2458-7-250. [DOI] [PMC free article] [PubMed] [Google Scholar]
- 15.Sonesson C. A CUSUM framework for detection of space-time disease clusters using scan statistics. Stat Med. 2007 Nov 20;26(26):4770–4789. doi: 10.1002/sim.2898. [DOI] [PubMed] [Google Scholar]


