

Abstract
Regulation of the actin cytoskeleton is critical for neurite formation. Tropomodulins (Tmods) regulate polymerization at actin filament pointed ends. Previous experiments using a mouse model deficient for the neuron specific isoform Tmod2 suggested a role for Tmods in neuronal function by impacting processes underlying learning and memory. However, the role of Tmods in neuronal function on the cellular level remains unknown. Immunofluorescence localization of the neuronal isoforms Tmod1 and Tmod2 in cultured rat primary hippocampal neurons revealed that Tmod1 is enriched along the proximal part of F-actin bundles in lamellipodia of spreading cells and in growth cones of extending neurites, while Tmod2 appears largely cytoplasmic. Functional analysis of these Tmod isoforms in a mouse neuroblastoma N2a cell line showed that knockdown of Tmod2 resulted in a significant increase in number of neurite-forming cells and in neurite length. While N2a cells compensated for Tmod2 knockdown by increasing Tmod1 levels, over-expression of exogenous Tmod1 had no effect on neurite outgrowth. Moreover, knockdown of Tmod1 increased the number of neurites formed per cell, without effect on number of neurite-forming cells or neurite length. Taken together, these results indicate that Tmod1 and Tmod2 have mechanistically distinct inhibitory roles in neurite formation, likely mediated via different effects on F-actin dynamics and via differential localizations during early neuritogenesis.
Keywords: Tropomodulin, F-actin, neurite outgrowth, N2a mouse neuroblastoma cells, cultured hippocampal neurons
Introduction
Neuritogenesis, when neurons differentiate and establish their first processes, depends on a complex reorganization of the cytoskeleton to initiate and extend the newly forming neurites (reviewed in (da Silva and Dotti, 2002; Dehmelt and Halpain, 2004; Dent and Gertler, 2003)). Actin cytoskeleton dynamics play a crucial role in both the initiation and elongation of neurite processes. With some notable exceptions (Strasser et al., 2004), a number of studies in the past decade have shown that mechanisms of actin dynamics regulation established for migration of non-neuronal cell types also apply to growth cone protrusion during neurite formation and extension (Dent and Gertler, 2003; Pak et al., 2008; Schaefer et al., 2002). Key features of actin dynamics in protrusion of lamellipodia and other cell processes are nucleation of new actin filaments together with barbed end assembly and filament elongation at the leading edge, followed by filament severing and disassembly from their pointed ends at the rear of the extending processes (Pantaloni et al., 2001; Pollard and Borisy, 2003). In extending processes of non-neuronal cells, the rates of actin barbed end elongation depend on the actin monomer supply, which is depleted by polymerization and must be constantly replenished by pointed end disassembly to enable continued extension of processes. Thus, cell process extension depends on pointed end depolymerization, which is the rate-limiting step in filament turnover and monomer re-supply (Pantaloni et al., 2001; Pollard and Borisy, 2003). The role of actin pointed end disassembly regulation in neurite initiation and growth cone extension is not well understood.
Tropomodulins (Tmods) are a conserved family of 40 kDa proteins that cap actin filament pointed ends, stabilizing filaments and inhibiting their disassembly and turnover (for a review, see (Fischer and Fowler, 2003)). Tmods also bind tropomyosins and their pointed end capping activity is enhanced greatly for tropomyosin-coated actin filaments (Weber et al., 1994). There are four Tmod isoforms in vertebrates, encoded by distinct genes, Tmods 1-41, of which Tmods 1-3 are expressed in neuronal tissue; however, both Tmod1 and Tmod3 are also expressed widely in non-neuronal cell types while Tmod2 is restricted to neurons (Cox et al., 2003; Cox and Zoghbi, 2000; Watakabe et al., 1996). Tmod1 regulates actin filament length and stability in stable cytoskeletal structures such as striated muscle sarcomeres (Fritz-Six et al., 2003; Gokhin et al., 2010; Gregorio et al., 1995; Littlefield et al., 2001), and this activity depends critically on the interaction of Tmod1 with tropomyosin at the thin filament pointed ends (Mudry et al., 2003). Tmod1 and Tmod3 also stabilize tropomyosin-actin filaments required for spectrin-actin network integrity in the membrane skeleton of epithelial cells (Weber et al., 2007), eye lens fiber cells (Nowak et al., 2009) and erythrocytes (Moyer et al., 2010). On the other hand, Tmod3 can also regulate actin assembly and turnover in highly dynamic actin filament networks such as present in the lamellipodia of motile endothelial cells, where it is a negative regulator of cell migration (Fischer et al., 2003). In this regard, the ability of Tmods 1, 2 and 3 to bind monomers and nucleate actin filament assembly may play a role (Yamashiro et al., 2010).
The Tmod2 gene in mice has been knocked out by insertion of a lacZ cassette in place of exon 1 (Cox et al., 2003). The homozygous null mice were found to exhibit strain-dependent hyperactivity, reduced sensorimotor gating and impaired learning and memory, as well as enhanced LTP on electrophysiological analysis. Interestingly, levels of Tmod1 protein were increased by 8-fold in the absence of Tmod2, suggesting possible compensation for loss of Tmod2 by Tmod1 expression. In contrast, Tmod3 protein levels were unchanged in the Tmod2 homozygous null mice. Thus, it is not clear to what extent the phenotype of the Tmod2 null mice is due to loss of Tmod2 function and/or to a gain of function by increased Tmod1 levels. Moreover, relatively little is known about the subcellular localization or function of Tmods in neurites, with the exception of one study in cultured rat cortical neurons showing diffuse immunofluorescence staining for Tmod2 in both the cell body and in neurites (Watakabe et al., 1996).
To investigate possible functions for Tmod2 and/or Tmod1 in early stages of neurite outgrowth, we examined Tmod localization in neurites of developing hippocampal neurons in culture, and Tmod function and isoform compensation using shRNA knockdown experiments in neuroblastoma (N2a) cells that were induced to differentiate using retinoic acid (Shea et al., 1985). In these cultured neuronal cells, Tmod1 and Tmod2 demonstrated distinct localizations and functional roles in neuritogenesis. In developing cultured hippocampal neurons, Tmod2 is predominantly localized in the cytoplasm, while Tmod1 is associated with actin filament bundles in lamellipodia and growth cones of extending neurites. N2a cells are widely used as a model system for analysis of basic mechanisms of neurite formation, similar to the processes observed in primary hippocampal neurons (Dehmelt et al., 2003; Quinta et al., 2010; Wu et al., 1998) In N2a cells, Tmod2 inhibits neurite extension while Tmod1 inhibits initiation of new neurites with little effect on elongation of neurites once formed. While Tmod1 levels were increased upon knockdown of Tmod2, similar to Tmod2 null mice (Cox et al., 2003), over-expression of exogenous Tmod1 had no effect on neurite outgrowth, demonstrating that effects of Tmod2 knockdown were not due to over-expression of Tmod1. To our knowledge, this is the first time that members of the Tmod family have been shown to play a role in neurite outgrowth during early events of neuronal morphogenesis, and that the neuron-specific Tmod2 likely plays a unique role in regulation of the actin cytoskeleton.
Results
Tmod2 is predominantly cytoplasmic while Tmod1 is associated with F-actin at early stages of neurite formation in cultured rat hippocampal neurons
To understand what roles Tmod2 and Tmod1 might play in neuritogenesis, we used primary cultures of embryonic rat hippocampal neurons to study subcellular localization of Tmods during early stages of neurite formation. Primary hippocampal neuron cultures prepared from rat embryos are a well-established system to investigate developmentally regulated subcellular localization and function of proteins in the neuronal cytoskeleton (da Silva and Dotti, 2002; Dehmelt and Halpain, 2004; Goslin, 1998). Six hours after plating most of the cells are well-spread and flattened out, forming extensive lamellipodial structures along their cell periphery (Figs. 1 and 2, A-D). After one day in culture, the cells form multiple neurites with some but not all of them revealing prominent growth cone structures (Figs. 1 and 2, E-H). Subsequently, neurites extend further over the course of the next four days (Figs. 1 and 2, I-L). By 7 days in culture, one of the neurites differentiates into an axon, as determined by staining for the axonal marker protein Tau (Fig. 3).
Fig. 1. Tmod2 is predominantly localized in the cytoplasm in developing rat hippocampal neurons.

Hippocampal cultures were fixed 6 hours (A-D), 1 day (E-H) or 4 days (I-L) after plating and stained for Tmod2 (A, E and I), F-actin (B, F and J), and β3-tubulin (C, G and K). High magnification insets are displayed as merges (D, H and L). Shown are representative cells from the respective time points. Magnification of insets 1.5× in A-C, 2× in E-G and 2× in I-K. Scale bars = 10μm except for D, H, and L where scale bars = 5μm.
Fig. 2. Tmod1 is associated with F-actin bundles in lamellipodia and growth cones of developing rat hippocampal neurons.

Hippocampal cultures were fixed 6 hours (A-D), 1 day (E-H) or 4 days (I-L) after plating and stained for Tmod1 (A, E and I), F-actin (B, F and J), and β3-tubulin (C, G and K). High magnification insets are displayed as merges (D, H and L). Shown are representative cells from the respective time points. Enrichment of Tmod1 along the proximal part of F-actin bundles in the lamellipodia and filopodia is observed at early times (D, H; arrowheads). Uniform distribution of Tmod1 along F-actin bundles is observed by 4 days after plating (L; arrow). Magnification of insets 2.5× in A-C, 4.3× in E-G and 3.4× in I-K. Scale bars = 10μm except for D, H, and L where scale bars = 5μm.
Fig. 3. Tmod2 and Tmod1 are localized to both somatodendritic and axonal compartments in neurons from 7 day-old rat hippocampal neuron cultures.

Hippocampal cultures were fixed 7 days after plating and stained for Tmod2 (A-F) or Tmod1 (G-L). Shown are representative endings of axons as determined by the presence of Tau-1 (A-C and G-I), and dendrites as determined by the lack of Tau-1 (D-F and J-L). Merged images show Tmod (red) and Tau-1 (green) merge (C,F,I and L). Scale bar = 10μm.
Neuronal growth cones are characterized by the presence of distinct, spatially segregated actin filament populations. Actin filament bundles (arcs) surround the center of the growth cone, while a network of dendritic actin filaments spreads throughout the lamellipodium. In addition, aligned actin filament bundles reach out into the filopodia, with the actin filament barbed ends at the tips and pointed ends near the base (Schaefer et al., 2002). The structure and dynamics of these different populations of actin filaments are regulated by a large number of actin binding proteins(Pak et al., 2008). Microtubules extend from the cell body along the neurites, reaching into the central portion of the growth cone(Schaefer et al., 2002).
To determine with which actin filament populations Tmods were associated, we first stained hippocampal neurons for the neuronal isoform, Tmod2, using an isoform specific affinity-purified antibody (Supplemental Figure 1), along with fluorescent phalloidin and an antibody directed against the neuron specific β3-tubulin (TUJ1) to visualize F-actin and microtubules, respectively (Fig. 1A-L). At 6 hours after plating, Tmod2 revealed a diffuse localization with most of the Tmod2 signal located in the cell body rather than in the lamellipodium of the spreading, neurite-less cells (Fig. 1A-D). After one day in culture, Tmod2 was distributed throughout the cells including the growth cones of short neurites, which formed during that time (Fig. 1E-H). This distribution is maintained during later stages of development, and in some neurites an enrichment of Tmod2 can be seen at the neurite tips as compared to the shafts (Fig. 1I-L, inset). In these neurite tips, some Tmod2 staining appears to co-localize with F-actin bundles, although the majority of the Tmod2 appears to be present in the cell body and enriched in the central domain of the growth cone, consistent with a predominantly cytoplasmic localization for Tmod2 during neurite outgrowth, as shown previously in cultured rat cortical neurons (Watakabe et al., 1996). Thus, these data suggest that a significant portion of Tmod2 is not associated with F-actin structures in growth cones before and during early neuritogenesis.
To determine whether Tmod1 differs in its subcellular distribution from that of Tmod2, primary hippocampal neurons at different stages of development were stained using an affinity purified antibody specific for Tmod1 (Fig. 2A-L) (Fritz-Six et al., 2003; Gokhin et al., 2010; Moyer et al., 2010; Nowak et al., 2009). After 6 hours in culture, staining for Tmod1 is observed in the cell body and in the lamellipodial regions where, unlike Tmod2, it co-localizes with the radial F-actin bundles around the periphery of the spreading, neurite-less cells (Fig. 2A-D). Tmod1 staining is enriched along the proximal regions of the F-actin bundles at the base of the lamellipodia (Fig. 2D, arrowhead). In neurons from 1 day-old cultures which have extended short neurites with prominent growth cones, Tmod1 is present throughout the cell body, the shafts of the neurites and the growth cones (Fig. 2E-H). In the growth cones, Tmod1 also co-localizes with F-actin bundles where it is enriched along the proximal regions of the F-actin bundles at the base of the growth cone lamellipodia (Fig. 2E, H, arrowhead). In neurons maintained for 4 days in culture, Tmod1 is present in the cell bodies and shafts of the neurites, and is now co-localized along the entire length of the F-actin bundles in the growth cones, extending to the tips of the filopodia (Fig. 2I-L, arrow). These data demonstrate that in contrast to Tmod2, Tmod1 is predominantly associated with F-actin bundles in lamellipodia and growth cones of developing hippocampal neurons. Further, Tmod1 appears to undergo a developmentally regulated redistribution along the F-actin bundles, from an early proximal to a more uniform localization at later stages of development.
To determine whether the Tmod2 and Tmod1 is selectively localized to axons vs dendrites at later developmental stages, we stained hippocampal neurons that had been cultured for 7 days. At this developmental stage, one of the neurites from each cell has differentiated to form an axon. Based on the axonal marker tau-1, both Tmod2 (Fig. 3A-C) and Tmod1 (Fig. 3G-I) are present in axonal shafts and growth cones. We observed a very similar pattern in tau-negative, dendritic processes (Fig. 3D-F) and (Fig. 3J-L), suggesting that Tmod2 and Tmod1 occupy similar structures in axons and dendrites. In contrast to the younger cultures, no obvious isoform specific localization patterns for Tmod2 and Tmod1 were observed in late cultures, suggesting that specific roles of Tmod2 vs Tmod1 may change during neuritogenesis in hippocampal neurons.
Expression of Tmods during differentiation of mouse neuroblastoma N2a cells
To examine the functions of Tmod2 and Tmod1 in neurite initiation and extension, we employed the experimentally more tractable N2a neuroblastoma cell line that can be induced to form neurite-like processes by addition of retinoic acid and serum deprivation (Dehmelt et al., 2003; Hasse et al., 2005). Western blot analysis showed that both Tmod2 and Tmod1 isoforms are expressed in both undifferentiated and in differentiated N2a cells, but that Tmod2 levels remain nearly constant while Tmod1 levels increase dramatically starting at 24 hours after retinoic-acid induction (Fig. 4A). Indeed, quantification of Tmod1 and Tmod2 protein levels in three independent experiments showed a 72% (±24) increase in Tmod1 and a 22% (±9) decrease in Tmod2 after 24 hours, when normalized to levels of the housekeeping protein, GAPDH (Fig. 4B). Thus, N2a cells appear to regulate the Tmod protein levels and relative proportions of the two isoforms during differentiation. An increase in Tmod1 message and protein levels during neuronal differentiation was observed in the rat cerebellum over postnatal days 15-20 (Sussman et al., 1994), and increases in Tmod1 message levels were also observed after NGF-induced differentiation of rat pheochromocytoma (PC12) cells (Lee et al., 2005).
Fig. 4. Tmod levels and localization in neuroblastoma (N2a) cells before and after retinoic acid-induced differentiation.

N2a cells were plated on Poly-L-Lysine coated culture dishes (A, B) or coverslips (C-L) and induced to differentiate by addition of retinoic acid (RA) for 3 hours after plating (A, G-L). Tmod protein expression in undifferentiated cells and at different stages of differentiation was detected by western blotting for Tmod1 and Tmod2 (A). Quantification of Tmod levels with respect to GAPDH after 2 days of differentiation as compared to non-differentiated cells (B). Undifferentiated (C-F) or differentiated (G-K) cells were fixed and stained for Tmod1 (C, G), Tmod2 (E, J) and F-actin (D, F, H, K). Tmod and F-actin stains of selected regions of differentiated N2a cells were merged and displayed (I and L). Scale Bar = 20 μm (C-H and J, K) or 10 μm (I and L).
Immunofluorescence staining of Tmod1 and Tmod2 in N2a cells also shows that both isoforms are present before and after induction of differentiation, where they are localized in the cell body and in the neurite-like processes (Fig. 4C-L). In the case of Tmod1, some staining is also present in the nucleus (Fig. 4C). Higher magnification images of the growth cones at the tips of neurites reveals that Tmod1 and Tmod2 appear to partially co-localize with some of the F-actin bundles (Fig. 4G-L, insets). Interestingly, the Tmod staining in growth cones is somewhat granular or punctate in appearance (Fig. 4G, J, insets), unlike the F-actin staining which is smooth and continuous along bundles or in lamellipodial networks (Fig. H, K, insets). The punctate staining for Tmods may reflect their associations with subpopulation(s) of F-actin in growth cones. Pre-extraction of N2a cells with Triton-X-100 to better evaluate the association of Tmods with F-actin was unsuccessful, as this treatment did not preserve the morphology of the N2a growth cones (data not shown). The differences in Tmod staining in neurites from N2a cells as compared to hippocampal neurons likely reflect the relatively poor differentiation state of N2a cells, For example, growth cones of N2a cells may be less polarized with respect to F-actin organization and alignment of pointed filament ends, as compared to hippocampal neurons.
Tmod1 levels increase upon reduction of Tmod2 in N2a cells
Tmod1 protein levels were reported to increase by 8-fold in brain tissue from Tmod2 homozygous null knockout mice (Cox et al., 2003). To determine whether N2a cells might replicate this isoform compensation phenomenon, we examined levels of Tmod isoforms in N2a cells in which we had selectively depleted endogenous Tmod2 or Tmod1 proteins using shRNA vectors. Knockdown of Tmod2 led to a ∼50% decrease in levels of Tmod2 protein as compared to the Tmod2 mismatch shRNA control (Fig. 5A). Strikingly, reduction of Tmod2 levels was associated with about a two-fold increase in levels of Tmod1 protein, similar to results obtained in vivo for Tmod2 heterozygous knockout mice which have half-normal levels of Tmod2 and a two-fold increase in Tmod1 (Cox et al., 2003). In contrast, while knockdown of Tmod1 led to about a four-fold decrease in levels of Tmod1 as compared to the mismatch shRNA control, reduction of Tmod1 was not associated with a change in Tmod2 (Fig. 5B). We typically observed transfection rates of 30-40%, suggesting that the immunoblot analyses could be an underestimate of the degree of knockdown in transfected cells. These experiments show that Tmod2-deficient N2a cells appear to replicate the Tmod1 isoform compensation observed in vivo in the mouse brain, and thus can provide a useful model to investigate functional consequences of Tmod2 knockdown on early neuritogenesis.
Fig. 5. Changes in Tmod protein levels after knockdown or over-expression of Tmod1 or Tmod2 in N2a cells.
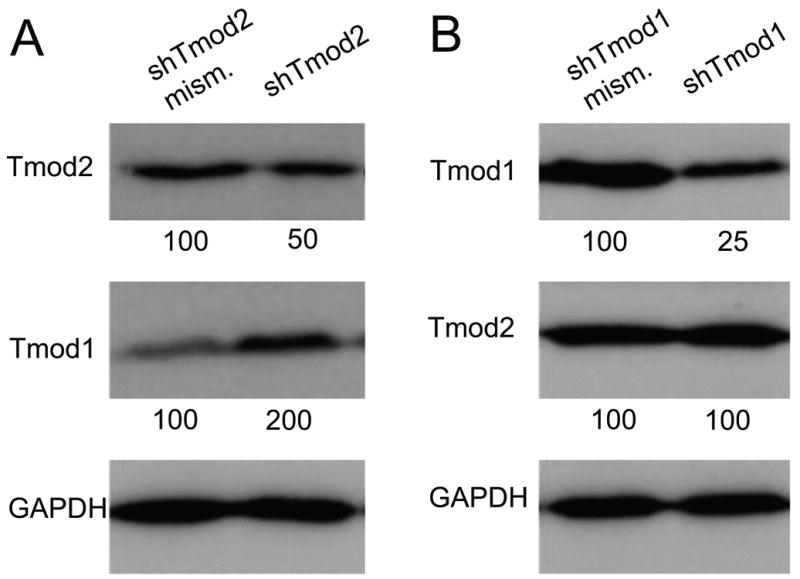
Western blots of N2a cells transfected with vectors expressing Tmod2-shRNA (A) or Tmod1-shRNA constructs (B), probed with antibodies as indicated. Mismatch shRNAs for each were used as controls for knockdown specificity. Tmod2 or Tmod1 levels were reduced at two days after transfection with the matching shRNAs to about 50% or 20%, respectively, of controls with shRNA mismatch vectors, with further decreases at day three after transfection (data not shown). Knockdown of endogenous Tmod2 leads to about a 2-fold increase in Tmod1 levels (A), while knockdown of endogenous Tmod1 has no effect on Tmod2 (B). Numbers under blots indicate relative Tmod levels, normalized to GAPDH, in this experiment.
Reduction of Tmod2 increases the number of neurite-forming cells and enhances neurite length
To analyze whether reduction of Tmod2 affected neuritogenesis in differentiating N2a cells, Tmod2 shRNA-treated or Tmod2 mismatch shRNA-treated cells were induced to differentiate for two days after transfection and cells expressing the shRNA vectors were identified by fluorescence, based on co-expression of GFP from the shRNA vectors. First, we observed that knockdown of Tmod2 significantly (p < 0.01) increased the percentage of cells with neurites by about two-fold, from 26.2±7.3% in control cells expressing Tmod2 mismatch shRNA to 46.1±7.6% (Fig. 6A). However, among cells that did extend neurites, the neurite number per cell was not affected (Fig 6B). Next, we analyzed the effect of decreased Tmod2 protein on neurite extension by measuring lengths of primary neurites. Mean primary neurite length was increased almost two-fold by Tmod2 knockdown, from 50.3 ± 1.6 μm to 79 ± 1.1 μm (p < 0.001) (Fig. 6C). Thus, Tmod2 appears to negatively regulate neurite formation in differentiating N2a cells, both by inhibiting the initiation and extension of neurites (Supplemental Figure 3).
Fig. 6. Knockdown of Tmod2 and Tmod1 impact distinct aspects of neurite initiation and extension.

N2a cells were plated on Poly-L-Lysine coated coverslips and transfected with vectors co-expressing GFP and Tmod2 shRNA (A-C), or GFP and Tmod1 shRNA (D-F). As control, vectors co-expressing GFP and a respective shRNA mismatch construct were used. Cells were induced to differentiate by serum reduction and the addition of 40 μM retinoic acid. Shown are the percent of GFP-positive cells bearing neurites (A, D), the number of neurites per cell (excluding cells not bearing neurites; B, E) and the mean length of primary neurites (C, F). The decrease in endogenous Tmod2 leads to about a 1.8-fold (p < 0.01) increase in numbers of neurite-bearing cells (A) and about a 1.6 fold (p < 0.05) increase in the mean length of neurites (C), without effect on numbers of neurites per cell (p < 0.4) (B). The decrease in endogenous Tmod1 levels leads to about a 1.3-fold (p < 0.05) increase in neurite numbers per cell (E) and a 10% decrease in the mean length of neurites (p < 0.04) (F), without effect on percentages of neurite-bearing cells (p < 1.0) (D). Results are means ± s.e.m. across experiments for three independent experiments. Asterisks indicate significant differences compared to control at (*) p < 0.05 or (**) p < 0.01 (t-Test, paired, two tailed).
Tmod2 does not inhibit neurite formation via increasing levels of Tmod1
Since Tmod1 levels are increased upon reduction of Tmod2 levels (Fig. 5C), it is not clear to what extent promotion of neurite formation and extension upon Tmod2 knockdown is due to loss of Tmod2 function and/or to increased levels of Tmod1, which might itself function to promote neurite formation in N2a cells. To discriminate between these interpretations, we first investigated whether endogenous Tmod1 functions to promote neurite formation in differentiating N2a cells. As mentioned above, shRNA targeting of Tmod1 in differentiating N2a cells led to a 4-fold reduction in levels of endogenous Tmod1 (Fig. 5B). In contrast to knock-down of Tmod2, knock-down of Tmod1 had no effect on the percentage of cells with neurites (Fig. 6D), but led to a significant (p < 0.05) increase in the number of neurites per cell, from 1.9 ± 0.1 neurites per cell (for control cells expressing Tmod1 mismatch shRNA) to 2.4 ± 0.1 neurites per cell (Fig. 6E) (Supplemental Figure 3). This is unlike knockdown of Tmod2, which had no effect on numbers of neurites per cell (Fig. 6B). These results indicate that endogenous Tmod1 appears to inhibit a different component of neurite initiation than Tmod2. Additionally, knockdown of Tmod1 led to a small but significant (p < 0.05) decrease in mean primary neurite length from 58.9 ± 1.2 μm to 55.0 ± 2.2 μm (Fig. 6F) (Supplemental Figure 3). This suggests that endogenous Tmod1 may also function to some degree in promoting neurite extension, opposite to endogenous Tmod2.
It was possible that enhanced levels of Tmod1 caused the observed changes in aspects of neurite formation inhibited by endogenous Tmod2, namely, numbers of cells with neurites and length of neurites. Therefore, we investigated the effects of increased levels of exogenous GFP-Tmod1 on neurite formation in differentiating N2a cells. Data from our previous studies indicate that the function and localization of Tmods are not affected by tagging with GFP (Fischer et al., 2003; Littlefield et al., 2001). Transfection of N2a cells with GFP-tagged Tmod1 resulted in approximately 10-fold higher levels of GFP-Tmod1 with respect to endogenous Tmod1, with no change in levels of endogenous Tmod1 (Supplemental Figure 2A). Neither the percentage of neurite-bearing cells, the numbers of neurites per cell, nor neurite lengths were affected by over-expression of GFP-Tmod1 (Supplemental Figure 2B-D) (Supplemental Figure 3). Therefore, increased Tmod1 does not phenocopy Tmod2 knockdown with respect to promotion of numbers of neurite-bearing cells or increase in neurite lengths. We conclude that reduction in levels of Tmod2 per se, rather than the increase in Tmod1 leads to promotion of neurite formation, and that Tmod2 does not function through changing Tmod1 levels.
Discussion
Despite numerous studies on the function of Tmod proteins expressed in non-neuronal cells, little is known about the localization and functions of Tmods in neuronal cells. We have shown here that Tmod2 is predominantly localized in the cytoplasm while Tmod1 is present along actin filament bundles in growth cones of neurites in developing cultured hippocampal neurons. The impacts of altered Tmod protein levels on neurite outgrowth in N2a cells demonstrate that each Tmod isoform selectively inhibits distinct parameters of neurite outgrowth. These results indicate a functional diversity for Tmod2 and Tmod1, and support recent evidence from other cells and tissue types that different Tmod isoforms are not functionally redundant in the same cellular environment (Gokhin et al., 2010; Moyer et al., 2010).
In cultured rat hippocampal neurons, shortly after plating, Tmod2 protein shows a diffuse cytoplasmic distribution, being largely excluded from the periphery of the lamellipodia. At later stages of development Tmod2 localization extends to the F-actin rich regions in the growth cones of neurites, but is most abundant in the central portion of the growth cones, again consistent with a predominantly cytoplasmic localization. In contrast, Tmod1 is associated with the proximal region of actin filament bundles in the lamellipodia of spreading neurons after 6 hours in culture and in the growth cones of 1 day-old neurons. Over time, Tmod1 localization changes from its proximal distribution to a distribution along the entire F-actin bundle in growth cones of neurites from 4 day-old neurons, likely to reflect changes in the locations of pointed ends in the actin filament bundles as neurites extend. What could account for these differences between Tmod1 and Tmod2? The actin-binding properties of mammalian Tmod1 and Tmod2 are similar with respect to their ability to bind actin monomers and nucleate actin filament assembly (Yamashiro et al., 2010), but their actin filament pointed end capping activities have not been compared directly. If Tmod2 were a weaker actin filament capper than Tmod1, this could potentially account for lack of Tmod2 localization to filament bundles in lamellipodia and growth cones. Alternatively, differences in Tmod1 and Tmod2 binding affinity for tropomyosin isoforms (Gokhin et al., 2010; Kostyukova, 2008a; Watakabe et al., 1996) could explain preferential recruitment of Tmod1 but not Tmod2 to F-actin bundles in extending neurites. Switching of tropomyosins associated with F-actin during neuritogenesis (Had et al., 1994) could lead to developmentally regulated recruitment of Tmod2 to F-actin present in motile neuronal structures, suggesting different functional roles for Tmod2 depending on the developmental stage of the neurons.
Tmod1 and Tmod2 isoform expression levels in N2A cultures mimics in vivo expression in the brain
Previous studies on Tmod isoform expression in the developing rat and mouse brain showed that Tmod2 expression levels increase from embryonic day 14 (E14) to E19 and are maintained into adulthood, whereas Tmod1 is predominantly detected in adult but not in embryonic brain tissue (Ito et al., 1995; Sussman et al., 1994; Watakabe et al., 1996). Here, we demonstrated that mouse N2a cells express both Tmod1 and Tmod2, and that Tmod2 protein levels remain nearly constant while Tmod1 levels increase during neuritogenesis induced by retinoic acid and serum deprivation (Fig. 5A). Thus, with respect to increases in Tmod1 expression, in vitro neuritogenesis of N2a cells appears to mimic some aspects of neuritogenesis during postnatal neuronal development.
Targeted deletion of the Tmod2 gene in mice has been shown to result in a compensatory two- or eight-fold increase in Tmod1 protein levels in Tmod2 heterozygous or homozygous null animals, respectively (Cox et al., 2003). Strikingly, shRNA-mediated knockdown of Tmod2 in differentiating N2a cells also led to over-expression of Tmod1. Similar to heterozygous Tmod2 knockout mice, levels of Tmod1 were about two-fold greater when Tmod2 protein levels were reduced by approximately half at two days post transfection with shRNA directed to Tmod2. This isoform compensation response complicates interpretation of the behavioral deficits and enhanced long-term potentiation observed in homozygous null Tmod2 knockout mice, as they could either be due to the absence of Tmod2 or due to increased levels of Tmod1 protein (Cox et al., 2003). The ability of N2a cells to mimic in vivo Tmod isoform compensation provided us with a simple model system to distinguish between these alternative mechanisms by comparing cellular phenotypes resulting from knockdown or over-expression of Tmod isoforms.
Our results demonstrate that over-expression of Tmod1 by transfection with GFP-Tmod1 does not result in the same effects on neurite outgrowth as are observed upon reduction in Tmod2 protein levels. In fact, Tmod1 over-expression did not measurably affect any of the analyzed parameters of neurite formation (numbers of neurite-bearing cells, neurites per cell and length of neurites). Thus, our data on morphological effects caused by loss of Tmod2 in N2a cells provides clues as to a potential mechanistic origin of the phenotypes observed by Cox and colleagues (Cox et al., 2003).
Tropomodulins as negative regulators of neurite formation
Quantitative analyses of neuritogenesis in differentiating N2a cells reveal that endogenous Tmod2 functions to inhibit neurite outgrowth, both by inhibiting the ability of cells to initiate neurites and by inhibiting neurite extension and growth. In particular, shRNA-mediated knockdown of Tmod2 led to a two-fold increase in numbers of neurite-bearing cells and in mean length of primary neurites. Neurite extension and growth cone migration exhibit some similarities to advancing lamellipodia in migrating cells (Dent and Gertler, 2003; Gungabissoon and Bamburg, 2003; Pak et al., 2008; Schaefer et al., 2002). Interestingly, Tmod3 is a negative regulator of cell migration in human microvascular endothelial cells (Fischer et al., 2003). The siRNA-mediated knockdown of endogenous Tmod3 protein led to increased rates of cell migration, increased free pointed ends, and an increase in lamellipodial F-actin levels. Reduction of Tmod3 levels could release actin monomers from a Tmod3:actin complex, leading to enhanced actin polymerization thereby promoting lamellipodial extension (Fischer et al., 2006). Since Tmod2 can also bind actin monomers (Fischer et al., 2006; Yamashiro et al., 2010), cytoplasmic Tmod2 may sequester actin monomers in a Tmod2:actin complex during neuritogenesis, thereby reducing the supply of monomers available for polymerization inhibiting neurite outgrowth. Although mammalian Tmod1 can also bind actin monomers (Yamashiro et al., 2010), tight binding of Tmod1 to F-actin pointed ends (possibly in association with tropomyosins) in lamellipodia and extending neurites would prevent Tmod1 from playing a role in regulating monomer levels in the neurite cytoplasm.
Both negative and positive regulation of the actin monomer supply may be a general mechanism to regulate the extent of neurite outgrowth. For example, the actin monomer sequestering protein, β-thymosin, has been shown to be a negative regulator of neurite outgrowth in primary cultured neurons (van Kesteren et al., 2006). Increased levels of dephosphorylated, activated cofilin/ADF, which enhance actin pointed end disassembly and actin turnover, increasing monomer supply (Kiuchi et al., 2007), promote neurite outgrowth and extension while phosphorylated, inactive cofilin/ADF has the reverse effect (Endo et al., 2007; Endo et al., 2003; Flynn et al., 2009; Meberg and Bamburg, 2000). Tmod2 appears to function similarly to β-thymosin, and antagonistically to cofilin/ADF with respect to neurite outgrowth. It is noteworthy that LIMK1 knockout mice in which levels of phosphorylated, inactive cofilin are greatly reduced, exhibit enhanced hippocampal long term potentiation (Meng et al., 2002), similar to enhanced long-term potentiation observed in the homozygous null Tmod2 knockout mice (Cox et al., 2003). Thus, the absence of Tmod2 appears to phenocopy activation of cofilin, again consistent with Tmod2 being functionally antagonistic to cofilin with respect to regulation of actin assembly and turnover in neuritogenesis.
Tmod1, which caps pointed ends and stabilizes F-actin, is also a negative regulator of neurite outgrowth in N2a cells but via a completely different mechanism from Tmod2. In contrast to Tmod2, knockdown of endogenous Tmod1 had no effect on the numbers of cells that formed neurites. This suggests that although Tmod1 levels increase during differentiation of N2a cells, Tmod1 is not required for differentiation and neuritogenesis of these cultures per se. However, reduction of Tmod1 did lead to a significant increase in the number of neurites that were formed per cell. This may result from an increased number of sites where the actin cytoskeleton beneath the plasma membrane has been weakened. Destabilization of the cortical actin cytoskeleton has been proposed to lead to an increase in sites where neurites could sprout (da Silva and Dotti, 2002; Dehmelt et al., 2003). Thus, the reduction in Tmod1 protein levels may lead to destabilization of pointed ends followed by F-actin disassembly in the membrane cytoskeleton. Indeed, Tmod1 was originally discovered as a component of the erythrocyte membrane skeleton, where it performs a similar F-actin stabilization function via pointed end capping (Moyer et al., 2010; Nowak et al., 2009) (reviewed in (Fischer and Fowler, 2003)). In addition, reduction of Tmod1 levels also led to a small but significant decrease in the length of primary neurites, suggesting that Tmod1 may also function to promote or stabilize neurite extension. This would likely be a consequence of the ability of Tmod1 to stabilize F-actin by capping pointed ends.
Tmod isoform-specific functions in neuronal cells
The isoform-specific inhibitory effects of Tmod1 and Tmod2 for different aspects of neurite initiation and extension may be related to shifts in the filamentous actin pool by Tmod regulation of actin nucleation, monomer sequestration or pointed end capping, as discussed above. However, recent data from our group show that both Tmod1 and 2 are able to bind actin monomers and nucleate actin filament assembly with similar efficacies (Yamashiro et al., 2010). This suggests that additional factors are likely involved in the isoform-specific functions of Tmods in the regulation of the actin cytoskeleton during neurite formation. A likely candidate would be the actin-associated protein tropomyosin. Tmods interact with tropomyosins in an isoform specific manner (Kostyukova, 2008a; Kostyukova, 2008b; Watakabe et al., 1996) (Gokhin et al., 2010). and a recent study on the functional role of tropomyosins in neuronal cells identified this family of proteins as a central regulator of neurite formation via regulating the filamentous actin pool in a tropomyosin isoform dependent manner (Fath et al., 2010; Schevzov et al., 2005; Schevzov et al., 2008). Future studies on the interactions between individual Tmod isoforms and other actin binding proteins in developing neurons will help reveal the molecular basis of actin cytoskeleton-driven neurite initiation and extension.
Experimental methods
Labeling reagents
The following primary antibodies were used: monoclonal anti-β3-tubulin (TUJ-1, R&D Systems, 1:250); monoclonal anti-Tau (Tau-1) and affinity-purified rabbit polyclonal anti-Tmod1 (Fowler et al., 1993) and Tmod2 (See Supplemental Figure 1). Antibodies to Tmods were prepared by immunization of rabbits with purified human erythrocyte Tmod1 (Fowler, 1990), or recombinant rat Tmod2 [purified as in (Watakabe et al., 1996)], and serum was preadsorbed to remove cross-reactivity to Tmod2 or Tmod1, respectively, followed by affinity purification on the appropriate Tmod-Sepharose column and elution with 0.2 M glycine, pH 2.3 (Fowler et al., 1993) (Supplemental Figure 1). Specificity for Tmod1 was demonstrated by immunofluoresence staining and western blotting of tissues from a Tmod1 knockout mouse (Fritz-Six et al., 2003; Gokhin et al., 2010; Nowak et al., 2009; Moyer et al., 2010), and for Tmod2 by using tissues from a Tmod2 knockout mouse, as shown in Supplemental Figure 1. Monoclonal anti-actin (C4) antibody was a gift of Dr. J. Lessard (University of Cincinnati, Cincinnati, OH). Monoclonal anti-GAPDH (Biogenesis) antibody was used as loading control for immunoblots. F-actin was visualized with far-red labeled phalloidin (Molecular Probes, 1:200). Secondary antibodies were anti-mouse Cy2, anti-rabbit Cy3, anti-mouse HRP, or anti-rabbit HRP (Sigma-Aldrich).
Cell culture
N2a cells (American Type Culture Collection, Manassas, VA) cultures were maintained in Dulbecco's modified eagle medium DMEM (Invitrogen) containing 10% fetal bovine serum (FBS), 1% GlutaMax/Pen/Strep (Invitrogen). Cells were plated onto glass coverslips that had been coated with 0.5 mg/ml poly-L-lysine overnight at 37 °C, or onto 3.5 cm culture dishes at a density of 1 × 10⁴ cells / cm2. Differentiation was induced by reducing serum concentration to 5% and adding retinoic acid (Sigma) to 40 μM. Primary hippocampal neurons from neonatal rat brains were prepared and cultured as described (Shiraishi et al., 2003).
DNA constructs and transient plasmid transfection
Tmod1 or Tmod2 were overexpressed using pEGFP-C3 vector (Clontech). For the knockdown of Tmod2 or Tmod1, shRNA hairpins were cloned into a vector expressing them under the control of H1 RNA polymerase III, as well as EGFP construct under the control of a CMV promoter for cell identification. The hairpin sequences were 5′-gaaatacaagaacatcgac-3′ and 5′-gaactagaagaggttaatc-3′ for Tmod2 and Tmod1 respectively. As controls for the knockdown of Tmods, mismatched targeting sequences for Tmod2 or Tmod1 were designed by changing two bases from a to g: 5′-gaaGtacaagaacGtcgac-3′ and 5′-gaGctagaagaggttaGtc-3′ for Tmod2 and Tmod1, respectively. For transfection of N2a cells, Fugene 6 (Roche Diagnostics) was used according to the manufacturer's instructions. Protein expression was analyzed by immunoblotting for Tmod1 or Tmod2 at two days post-transfection, as described previously (Fischer et al., 2003).
Antibody labeling and fluorescence microscopy
N2a cells and hippocampal neurons were fixed for 10 minutes at room temperature in 0.25% glutaraldehyde, 1mM MgCl2, 1mM EGTA, 80 mM PIPES, pH 6.8. Fixed neurons were treated with 10 mg/ml sodium borohydride in PBS for 10 min, permeabilized with 0.2% Nonidet-P40 in PBS and then incubated with primary antibodies diluted in PBS containing 3% BSA and 0.1% Tween-20 for 30 min, followed by incubation with fluorescent-conjugated secondary antibodies and fluorescent phalloidin. Confocal images were taken using a Bio-Rad Radiance 2100 laser scanning system (LSCM) on a Nikon TE2000-U microscope. Serial sections of samples were collected with a Z interval of 0.5 μm between optical sections and then merged for display. Images were processed using Metamorph and Photoshop software.
To analyze neurite formation in N2a cells, the cells were induced to differentiate with retinoic acid two days after transfection. After two days of differentiation, cells were fixed for morphometric analysis with a PBS buffer containing 4% paraformaldehyde and immunostained with TUJ1 antibodies to β3 tubulin. Permeabilization and staining conditions were as above. Images were acquired on a Nikon TE2000-U microscope using Metamorph software. Both the total number of neurite-bearing cells and the number of neurites per cell were counted directly on the computer screen at the microscope. Length measurements were carried out using the Metamorph software tracer function starting where the neurite emerges from the cell body and tracing its length out to the distal tip. For the analysis of numbers of neurites per cell, we excluded cells that did not form neurites. Significance was determined by using a paired two-tailed Student's t-Test.
Supplementary Material
(A) Western blot with rabbit antiserum (1:500) to rat Tmod2 showing specific labeling of Tmod2 in extracts of rat brain (lane 1) and mouse brain from wild-type (+/+, lane 2) and heterozygous (+/-, lane 3) Tmod2 knockout mice, but not in brain extracts from homozygous null (-/-, lane 3) Tmod2 knockout mice (Cox et al., 2003). Antiserum to Tmod2 reacts strongly with purified rat Tmod2 (lane 4) and weakly with purified human Tmod3 (lane 5). Extracts from adult rat or mouse brains were prepared by Dounce homogenization in PBS with protease inhibitors at 0°C followed by solubilization in SDS Laemmli sample buffer. 2 μg brain extracts or 20 ng purified proteins were electrophoresed on 12% acrylamide gels followed by western blotting. (B) Pre-adsorption of anti-Tmod2 serum on a Tmod3 column eliminates cross-reaction of antibodies to Tmod3. Antibodies to rat Tmod2 were prepared in rabbits and purified by first passing the serum over a human Tmod3 column followed by affinity purification over a rat Tmod2 column, and used at 1 μg/ml. 40 ng each of recombinant chicken Tmod1, rat Tmod2, human Tmod3 and chicken Tmod4 proteins were electrophoresed on 10% acrylamide gels followed by western blotting.
Western blots of N2a cells transfected with vectors expressing GFP-tagged Tmod1 and probed wit antibodies to Tmod1 or actin (A). For quantitative analysis of neurite formation, N2a cells were transfected with vectors over-expressing GFP-Tmod1 or GFP (B-D), and induced to differentiate. Shown are the percent of GFP-positive cells bearing neurites (B), the number of neurites per cell (excluding cells not bearing neurites) (C) and the mean length of primary neurites (D). Note that there is no significant change (t-Test, paired, two tailed) in either neurite initiation or extension in response to increased Tmod1 protein levels. Results are means ± s.e.m. across experiments for three independent experiments.
Summarized are changes in differentiating N2a cells resulting from perturbations in levels of Tmod1 or Tmod2 based on results of shRNA-mediated knockdown of Tmods or over-expression of GFP-Tmods. The schematic of a differentiating N2a cells with its neurite arbor below each experimental condition illustrates the observed changes in morphology.
Acknowledgments
We thank Julia Braga in the Halpain lab for assistance in preparing hippocampal neuron cultures and Jeannette Moyer and Kari Weber in the Fowler lab for assistance in purifying recombinant Tmods and antibodies, and in preparing Figure S1.
Footnotes
Tmod1 is also referred to as E-Tmod, Tmod2 as N-Tmod, Tmod3 as U-Tmod and Tmod4 as Sk-Tmod.
Ethics Statement: All procedures with animals were performed to avoid unnecessary discomfort, pain or injury to the animals, as detailed in the NIH Guide for the Care and Use of Laboratory Animals, and as approved in Protocols #ARC-56Apr4 and #ARC41Apr5, by the Institutional Animal Care and Use Committee at The Scripps Research Institute.
Publisher's Disclaimer: This is a PDF file of an unedited manuscript that has been accepted for publication. As a service to our customers we are providing this early version of the manuscript. The manuscript will undergo copyediting, typesetting, and review of the resulting proof before it is published in its final citable form. Please note that during the production process errors may be discovered which could affect the content, and all legal disclaimers that apply to the journal pertain.
References
- Cox PR, Fowler V, Xu B, Sweatt JD, Paylor R, Zoghbi HY. Mice lacking tropomodulin-2 show enhanced long-term potentiation, hyperactivity, and deficits in learning and memory. Molecular and Cellular Neuroscience. 2003;23:1–12. doi: 10.1016/s1044-7431(03)00025-3. [DOI] [PubMed] [Google Scholar]
- Cox PR, Zoghbi HY. Sequencing, expression analysis, and mapping of three unique human tropomodulin genes and their mouse orthologs. Genomics. 2000;63:97–107. doi: 10.1006/geno.1999.6061. [DOI] [PubMed] [Google Scholar]
- da Silva JS, Dotti CG. Breaking the neuronal sphere: regulation of the actin cytoskeleton in neuritogenesis. Nat Rev Neurosci. 2002;3:694–704. doi: 10.1038/nrn918. [DOI] [PubMed] [Google Scholar]
- Dehmelt L, Halpain S. Actin and microtubules in neurite initiation: are MAPs the missing link? J Neurobiol. 2004;58:18–33. doi: 10.1002/neu.10284. [DOI] [PubMed] [Google Scholar]
- Dehmelt L, Smart FM, Ozer RS, Halpain S. The role of microtubule-associated protein 2c in the reorganization of microtubules and lamellipodia during neurite initiation. J Neurosci. 2003;23:9479–90. doi: 10.1523/JNEUROSCI.23-29-09479.2003. [DOI] [PMC free article] [PubMed] [Google Scholar]
- Dent EW, Gertler FB. Cytoskeletal dynamics and transport in growth cone motility and axon guidance. Neuron. 2003;40:209–27. doi: 10.1016/s0896-6273(03)00633-0. [DOI] [PubMed] [Google Scholar]
- Endo M, Ohashi K, Mizuno K. LIM kinase and slingshot are critical for neurite extension. J Biol Chem. 2007;282:13692–702. doi: 10.1074/jbc.M610873200. [DOI] [PubMed] [Google Scholar]
- Endo M, Ohashi K, Sasaki Y, Goshima Y, Niwa R, Uemura T, Mizuno K. Control of growth cone motility and morphology by LIM kinase and Slingshot via phosphorylation and dephosphorylation of cofilin. J Neurosci. 2003;23:2527–37. doi: 10.1523/JNEUROSCI.23-07-02527.2003. [DOI] [PMC free article] [PubMed] [Google Scholar]
- Fath T, Agnes Chan YK, Vrhovski B, Clarke H, Curthoys N, Hook J, Lemckert F, Schevzov G, Tam P, Watson CM, et al. New aspects of tropomyosin-regulated neuritogenesis revealed by the deletion of Tm5NM1 and 2. Eur J Cell Biol. 2010;89:489–98. doi: 10.1016/j.ejcb.2009.11.028. [DOI] [PubMed] [Google Scholar]
- Fischer RS, Fowler VM. Tropomodulins: life at the slow end. Trends in Cell Biology. 2003;13:593–601. doi: 10.1016/j.tcb.2003.09.007. [DOI] [PubMed] [Google Scholar]
- Fischer RS, Fritz-Six KL, Fowler VM. Pointed-end capping by tropomodulin3 negatively regulates endothelial cell motility. Journal of Cell Biology. 2003;161:371–80. doi: 10.1083/jcb.200209057. [DOI] [PMC free article] [PubMed] [Google Scholar]
- Fischer RS, Yarmola EG, Weber KL, Speicher KD, Speicher DW, Bubb MR, Fowler VM. Tropomodulin 3 binds to actin monomers. J Biol Chem. 2006;281:36454–65. doi: 10.1074/jbc.M606315200. [DOI] [PubMed] [Google Scholar]
- Flynn KC, Pak CW, Shaw AE, Bradke F, Bamburg JR. Growth cone-like waves transport actin and promote axonogenesis and neurite branching. Dev Neurobiol. 2009;69:761–79. doi: 10.1002/dneu.20734. [DOI] [PMC free article] [PubMed] [Google Scholar]
- Fritz-Six KL, Cox PR, Fischer RS, Xu B, Gregorio CC, Zoghbi HY, Fowler VM. Aberrant myofibril assembly in tropomodulin1 null mice leads to aborted heart development and embryonic lethality. Journal of Cell Biology. 2003;163:1033–44. doi: 10.1083/jcb.200308164. [DOI] [PMC free article] [PubMed] [Google Scholar]
- Gokhin DS, Lewis RA, McKeown CR, Nowak RB, Kim NE, Littlefield RS, Lieber RL, Fowler VM. Tropomodulin isoforms regulate thin filament pointed-end capping and skeletal muscle physiology. J Cell Biol. 2010;189:95–109. doi: 10.1083/jcb.201001125. [DOI] [PMC free article] [PubMed] [Google Scholar]
- Goslin K, Asumussen H, Banker G. Rat Hippocampal neurons in low-density culture. In: Gary Banker KG, editor. Culturing Nerve Cells. MIT Press; 1998. pp. 339–370. [Google Scholar]
- Gregorio CC, Weber A, Bondad M, Pennise CR, Fowler VM. Requirement of pointed-end capping by tropomodulin to maintain actin filament length in embryonic chick cardiac myocytes. Nature. 1995;377:83–6. doi: 10.1038/377083a0. [DOI] [PubMed] [Google Scholar]
- Gungabissoon RA, Bamburg JR. Regulation of growth cone actin dynamics by ADF/cofilin. J Histochem Cytochem. 2003;51:411–20. doi: 10.1177/002215540305100402. [DOI] [PubMed] [Google Scholar]
- Had L, Faivre-Sarrailh C, Legrand C, Mery J, Brugidou J, Rabie A. Tropomyosin isoforms in rat neurons: the different developmental profiles and distributions of TM-4 and TMBr-3 are consistent with different functions. Journal of Cell Science. 1994;107:2961–73. doi: 10.1242/jcs.107.10.2961. [DOI] [PubMed] [Google Scholar]
- Hasse A, Rosentreter A, Spoerl Z, Stumpf M, Noegel AA, Clemen CS. Coronin 3 and its role in murine brain morphogenesis. Eur J Neurosci. 2005;21:1155–68. doi: 10.1111/j.1460-9568.2005.03917.x. [DOI] [PubMed] [Google Scholar]
- Ito M, Swanson B, Sussman MA, Kedes L, Lyons G. Cloning of tropomodulin cDNA and localization of gene transcripts during mouse embryogenesis. Dev Biol. 1995;167:317–28. doi: 10.1006/dbio.1995.1026. [DOI] [PubMed] [Google Scholar]
- Kiuchi T, Ohashi K, Kurita S, Mizuno K. Cofilin promotes stimulus-induced lamellipodium formation by generating an abundant supply of actin monomers. J Cell Biol. 2007;177:465–76. doi: 10.1083/jcb.200610005. [DOI] [PMC free article] [PubMed] [Google Scholar]
- Kostyukova AS. Capping complex formation at the slow-growing end of the actin filament. Biochemistry (Mosc) 2008a;73:1467–72. doi: 10.1134/s0006297908130075. [DOI] [PubMed] [Google Scholar]
- Kostyukova AS. Tropomodulins and tropomodulin/tropomyosin interactions. Cell Mol Life Sci. 2008b;65:563–9. doi: 10.1007/s00018-007-7347-9. [DOI] [PMC free article] [PubMed] [Google Scholar]
- Lee KH, Ryu CJ, Hong HJ, Kim J, Lee EH. CDNA microarray analysis of nerve growth factor-regulated gene expression profile in rat PC12 cells. Neurochem Res. 2005;30:533–40. doi: 10.1007/s11064-005-2688-y. [DOI] [PubMed] [Google Scholar]
- Littlefield R, Almenar-Queralt A, Fowler VM. Actin dynamics at pointed ends regulates thin filament length in striated muscle. Nat Cell Biol. 2001;3:544–51. doi: 10.1038/35078517. [DOI] [PubMed] [Google Scholar]
- Meberg PJ, Bamburg JR. Increase in neurite outgrowth mediated by overexpression of actin depolymerizing factor. J Neurosci. 2000;20:2459–69. doi: 10.1523/JNEUROSCI.20-07-02459.2000. [DOI] [PMC free article] [PubMed] [Google Scholar]
- Meng Y, Zhang Y, Tregoubov V, Janus C, Cruz L, Jackson M, Lu WY, MacDonald JF, Wang JY, Falls DL, et al. Abnormal spine morphology and enhanced LTP in LIMK-1 knockout mice. Neuron. 2002;35:121–33. doi: 10.1016/s0896-6273(02)00758-4. [DOI] [PubMed] [Google Scholar]
- Moyer JD, Nowak RB, Kim NE, Larkin SK, Peters LL, Hartwig J, Kuypers FA, Fowler VM. Tropomodulin1-null have a mild spherocytic elliptocytosis with appearance of Tropomodulin3 in red blood cells and disruption of the membrane skeleton. Blood. 2010 doi: 10.1182/blood-2010-02-268458. in press. [DOI] [PMC free article] [PubMed] [Google Scholar]
- Mudry RE, Perry CN, Richards M, Fowler VM, Gregorio CC. The interaction of tropomodulin with tropomyosin stabilizes thin filaments in cardiac myocytes. J Cell Biol. 2003;162:1057–68. doi: 10.1083/jcb.200305031. [DOI] [PMC free article] [PubMed] [Google Scholar]
- Nowak RB, Fischer RS, Zoltoski RK, Kuszak JR, Fowler VM. Tropomodulin1 is required for membrane skeleton organization and hexagonal geometry of fiber cells in the mouse lens. J Cell Biol. 2009;186:915–28. doi: 10.1083/jcb.200905065. [DOI] [PMC free article] [PubMed] [Google Scholar]
- Pak CW, Flynn KC, Bamburg JR. Actin-Binding Proteins Take the Reins in Growth Cones. Nature Reviews. 2008;9:136–147. doi: 10.1038/nrn2236. [DOI] [PubMed] [Google Scholar]
- Pantaloni D, Le Clainche C, Carlier MF. Mechanism of actin-based motility. Science. 2001;292:1502–6. doi: 10.1126/science.1059975. [DOI] [PubMed] [Google Scholar]
- Pollard TD, Borisy GG. Cellular Motility Driven by Assembly and Disassembly of Actin Filaments. Cell. 2003;112:453–465. doi: 10.1016/s0092-8674(03)00120-x. [DOI] [PubMed] [Google Scholar]
- Quinta HR, Maschi D, Gomez-Sanchez C, Piwien-Pilipuk G, Galigniana MD. Subcellular Rearrangement of Hsp90-binding Immunophilins Accompanies Neuronal Differentiation and Neurite Outgrowth. J Neurochem. 2010 doi: 10.1111/j.1471-4159.2010.06970.x. [DOI] [PMC free article] [PubMed] [Google Scholar]
- Schaefer AW, Kabir N, Forscher P. Filopodia and actin arcs guide the assembly and transport of two populations of microtubules with unique dynamic parameters in neuronal growth cones. J Cell Biol. 2002;158:139–52. doi: 10.1083/jcb.200203038. [DOI] [PMC free article] [PubMed] [Google Scholar]
- Schevzov G, Bryce NS, Almonte-Baldonado R, Joya J, Lin JJ, Hardeman E, Weinberger R, Gunning P. Specific features of neuronal size and shape are regulated by tropomyosin isoforms. Molecular Biology of the Cell. 2005;16:3425–37. doi: 10.1091/mbc.E04-10-0951. [DOI] [PMC free article] [PubMed] [Google Scholar]
- Schevzov G, Fath T, Vrhovski B, Vlahovich N, Rajan S, Hook J, Joya JE, Lemckert F, Puttur F, Lin JJ, et al. Divergent regulation of the sarcomere and the cytoskeleton. Journal of Biological Chemistry. 2008;283:275–83. doi: 10.1074/jbc.M704392200. [DOI] [PubMed] [Google Scholar]
- Shea TB, Fischer I, Sapirstein VS. Effect of retinoic acid on growth and morphological differentiation of mouse NB2a neuroblastoma cells in culture. Brain Res. 1985;353:307–14. doi: 10.1016/0165-3806(85)90220-2. [DOI] [PubMed] [Google Scholar]
- Shiraishi Y, Mizutani A, Mikoshiba K, Furuichi T. Coincidence in dendritic clustering and synaptic targeting of homer proteins and NMDA receptor complex proteins NR2B and PSD95 during development of cultured hippocampal neurons. Mol Cell Neurosci. 2003;22:188–201. doi: 10.1016/s1044-7431(03)00037-x. [DOI] [PubMed] [Google Scholar]
- Strasser GA, Rahim NA, VanderWaal KE, Gertler FB, Lanier LM. Arp2/3 is a negative regulator of growth cone translocation. Neuron. 2004;43:81–94. doi: 10.1016/j.neuron.2004.05.015. [DOI] [PubMed] [Google Scholar]
- Sussman MA, Sakhi S, Tocco G, Najm I, Baudry M, Kedes L, Schreiber SS. Neural tropomodulin: developmental expression and effect of seizure activity. Brain Res Dev Brain Res. 1994;80:45–53. doi: 10.1016/0165-3806(94)90088-4. [DOI] [PubMed] [Google Scholar]
- van Kesteren RE, Carter C, Dissel HM, van Minnen J, Gouwenberg Y, Syed NI, Spencer GE, Smit AB. Local synthesis of actin-binding protein beta-thymosin regulates neurite outgrowth. J Neurosci. 2006;26:152–7. doi: 10.1523/JNEUROSCI.4164-05.2006. [DOI] [PMC free article] [PubMed] [Google Scholar]
- Watakabe A, Kobayashi R, Helfman DM. N-tropomodulin: a novel isoform of tropomodulin identified as the major binding protein to brain tropomyosin. Journal of Cell Science. 1996;109(Pt 9):2299–310. doi: 10.1242/jcs.109.9.2299. [DOI] [PubMed] [Google Scholar]
- Weber A, Pennise CR, Babcock GG, Fowler VM. Tropomodulin caps the pointed ends of actin filaments. Journal of Cell Biology. 1994;127:1627–35. doi: 10.1083/jcb.127.6.1627. [DOI] [PMC free article] [PubMed] [Google Scholar]
- Weber KL, Fischer RS, Fowler VM. Tmod3 regulates polarized epithelial cell morphology. J Cell Sci. 2007;120:3625–32. doi: 10.1242/jcs.011445. [DOI] [PubMed] [Google Scholar]
- Wu G, Fang Y, Lu ZH, Ledeen RW. Induction of axon-like and dendrite-like processes in neuroblastoma cells. J Neurocytol. 1998;27:1–14. doi: 10.1023/a:1006910001869. [DOI] [PubMed] [Google Scholar]
- Yamashiro S, Speicher KD, Speicher DK, Fowler VM. Mammalian Tropomodulins Nucleate Actin Polymerization via their Actin Monomer-Binding and Filament Pointed End-Capping Activities. Journal of Biological Chemistry. 2010 doi: 10.1074/jbc.M110.144873. in press. [DOI] [PMC free article] [PubMed] [Google Scholar]
Associated Data
This section collects any data citations, data availability statements, or supplementary materials included in this article.
Supplementary Materials
(A) Western blot with rabbit antiserum (1:500) to rat Tmod2 showing specific labeling of Tmod2 in extracts of rat brain (lane 1) and mouse brain from wild-type (+/+, lane 2) and heterozygous (+/-, lane 3) Tmod2 knockout mice, but not in brain extracts from homozygous null (-/-, lane 3) Tmod2 knockout mice (Cox et al., 2003). Antiserum to Tmod2 reacts strongly with purified rat Tmod2 (lane 4) and weakly with purified human Tmod3 (lane 5). Extracts from adult rat or mouse brains were prepared by Dounce homogenization in PBS with protease inhibitors at 0°C followed by solubilization in SDS Laemmli sample buffer. 2 μg brain extracts or 20 ng purified proteins were electrophoresed on 12% acrylamide gels followed by western blotting. (B) Pre-adsorption of anti-Tmod2 serum on a Tmod3 column eliminates cross-reaction of antibodies to Tmod3. Antibodies to rat Tmod2 were prepared in rabbits and purified by first passing the serum over a human Tmod3 column followed by affinity purification over a rat Tmod2 column, and used at 1 μg/ml. 40 ng each of recombinant chicken Tmod1, rat Tmod2, human Tmod3 and chicken Tmod4 proteins were electrophoresed on 10% acrylamide gels followed by western blotting.
Western blots of N2a cells transfected with vectors expressing GFP-tagged Tmod1 and probed wit antibodies to Tmod1 or actin (A). For quantitative analysis of neurite formation, N2a cells were transfected with vectors over-expressing GFP-Tmod1 or GFP (B-D), and induced to differentiate. Shown are the percent of GFP-positive cells bearing neurites (B), the number of neurites per cell (excluding cells not bearing neurites) (C) and the mean length of primary neurites (D). Note that there is no significant change (t-Test, paired, two tailed) in either neurite initiation or extension in response to increased Tmod1 protein levels. Results are means ± s.e.m. across experiments for three independent experiments.
Summarized are changes in differentiating N2a cells resulting from perturbations in levels of Tmod1 or Tmod2 based on results of shRNA-mediated knockdown of Tmods or over-expression of GFP-Tmods. The schematic of a differentiating N2a cells with its neurite arbor below each experimental condition illustrates the observed changes in morphology.