

Abstract
Leptin acts via the long form of the leptin receptor (LepRb) on specialized sets of neurons in the brain to modulate diverse functions in concert with energy stores. Previous studies have revealed the distribution of LepRb-expressing neurons in the brain but not the regions to which LepRb neurons project to mediate downstream leptin actions. We utilized LepRb-cre in combination with cre-inducible enhanced green fluorescent protein (EGFP) and farnesylated EGFP (EGFPf) mouse reporter strains to visualize LepRb neurons and their projections, respectively, throughout the brain. The areas containing LepRb soma and projections were relatively circumscribed, as many brain regions contained no detectable EGFP or EGFPf. The highest concentrations of LepRb neurons and LepRb-projections were found in the hypothalamus, where the ventral premamillary (PMv), dorsomedial (DMH) and arcuate (ARC) nuclei contained the greatest number of cell bodies, in addition to substantial EGFPf-reactivity. Furthermore, both LepRb soma and projections were present in a few midbrain and brainstem nuclei. Several brain regions including the hypothalamic paraventricular nucleus (PVH), the anteroventral periventricular nucleus (AVPe), and the central nucleus of the amygdala (CeA) contained few LepRb neurons but substantial EGFPf, suggesting that these regions represent targets of LepRb neurons that lie elsewhere in the brain. In some nuclei that contained both soma and projections, the distribution of soma and projections differed, suggesting that these areas transmit leptin-encoded information in a neuroanatomically directional manner.
Keywords: leptin, cre recombinase, enhanced green fluorescent protein, axon
1. Introduction
Leptin is a primarily adipose-derived hormone that modulates diverse behaviors and physiologic functions in line with energy balance (Ahima et al., 1999; Bouret and Simerly, 2007; Friedman and Halaas, 1998; Myers et al., 2009; Williams et al., 2009). Mice null for leptin (Lepob/ob) display severe hyperphagia and obesity, along with diabetes, decreased sympathetic tone, impaired thyroid function, infertility, and cold intolerance (Chua et al., 1996; Elmquist et al., 1999; Friedman and Halaas, 1998; Vaisse et al., 1996). Exogenous leptin reverses these defects and restores energy balance in Lepob/ob animals, as well as diminishing appetite and supporting energy expenditure in food restricted animals and humans (Ahima et al., 1996; Rosenbaum et al., 2002). Additionally, leptin promotes anti-depressant and anxiolytic effects and modulates the mesolimbic dopamine system in rodents (Fulton et al., 2006; Hommel et al., 2006; Leinninger et al., 2009; Lu, 2007; Lu et al., 2006). Thus, leptin signals the repletion (or, by its absence, the depletion) of adipose energy stores to modulate diverse behaviors and energy expenditure in concert with energy status. Since both intracerebroventricular (icv) and intraperitoneal (ip) administration of leptin decrease appetite and increase energy expenditure in rodents (Campfield et al., 1995), the major effects of leptin appear to be mediated via the CNS. Indeed, disruption of the leptin receptor (LepR) in the CNS promotes hyperphagia and decreased energy expenditure (Balthasar et al., 2004; Bates et al., 2004; Bingham et al., 2008; Cohen et al., 2001; Dhillon et al., 2006).
Although alternative splicing leads to the production of multiple LepR variants, only the so-called “long” LepR form (LepRb) contains a fully signaling-competent intracellular domain; Leprdb/db mice specifically null for the LepRb isoform largely recapitulate the phenotype of Lepob/ob animals, suggesting that LepRb mediates the majority of physiologic leptin action (Chua et al., 1996; de Luca et al., 2005; Robertson et al., 2008). Furthermore, transgenic expression of LepRb in the brains of mice null for all LepR isoforms restores most leptin action (Chua et al., 2004). Thus, LepRb-expressing neurons in the brain represent the major cellular mediators of leptin action.
The expression of LepRb within the brain has been mapped by a variety of means, including functional and genetic assays and in situ hybridization, and these studies have revealed large numbers of LepRb neurons within discrete hypothalamic nuclei, as well as in circumscribed regions of the midbrain, brainstem, and a few other brain regions (Elmquist et al., 1998; Leshan et al., 2006; Scott et al., 2009). While the functional analysis of the many populations of LepRb neurons remains incomplete, a variety of data suggest important roles for several sets of hypothalamic LepRb neurons in the response to leptin. Deletion of LepRb specifically in subsets of LepRb-expressing ARC neurons promotes weight gain and hyperleptinemia (Balthasar et al., 2004; van de et al., 2008). Similarly, mice lacking LepRb specifically in SF1-expressing neurons in the VMH display increased susceptibility to obesity (Dhillon et al., 2006). Overall, the effects of these ARC/VMH-specific manipulations are modest compared to the phenotype of Leprdb/db animals, however, suggesting that leptin action is more widely distributed. Indeed, important functional roles have been described for hypothalamic LepRb neurons, including elsewhere in the hypothalamus, including the lateral hypothalamic area (LHA), as well as in the midbrain and brainstem (Grill et al., 2002; Hayes et al., 2010; Hommel et al., 2006; Leinninger et al., 2009; Leinninger and Myers, 2008; Leshan et al., 2009; Leshan et al., 2010; Ring and Zeltser, 2010).
While the identification of LepRb neurons reveals the direct targets of leptin action in the brain, it is also important to identify the brain regions that are innervated by LepRb neurons, as these sites likely represent important output nuclei for leptin action. In this study, we have analyzed the mouse brain for LepRb-containing neural soma and their projections, in order to identify such regions.
2. Results
2.1 LepRbEGFP and LepRbEGFPf mice
To effectively study the sites and mechanisms of leptin action in the brain, it is necessary to determine the brain regions where leptin acts- including not only those that contain LepRb-expressing soma, but also those regions to which LepRb neurons project to effect trans-synaptic regulation. Due to the lack of sensitive LepRb detection in the brain by immunocytochemistry, we and others have employed genetic models to detect LepRb soma (Leshan et al., 2006; Scott et al., 2009). Use of a mouse model (Leprcre) that expresses cre recombinase from the LepRb-specific mRNA in combination with a cre-inducible enhanced green fluorescent protein (EGFP; LepRbEGFP mice) or similar reporter alleles promotes reporter gene expression in LepRb-expressing cells to facilitate their detection (Figure 1) (Leshan et al., 2006). While EGFP accumulates in the cytoplasm and serves well to identify soma, cytoplasm-poor neural processes (such as axons) are poorly labeled by standard EGFP in many cases. Since it is also important to identify which brain regions are indirectly influenced by leptin, we also generated a reporter allele (Gt(ROSA)26SorEGFPf) that drives the expression of farnesylated EGFP (EGFPf; which is localized to the membrane and allows for the visualization of axonal projections) in cre-expressing cells (Figure 1)(Leshan et al., 2009).
Figure 1. LepRbEGFP and LepRbEGFPf reporter mice.
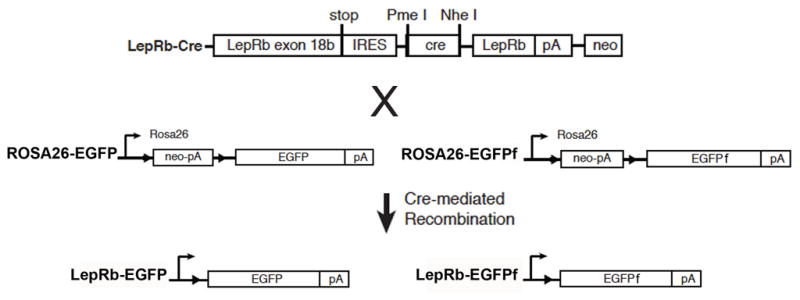
a) Schematic diagram demonstrating cre-mediated EGFP and EGFPf expression in LepRb expressing cells of LepRbEGFP and LepRbEGFPf mice. In each line, cre-dependent excision of a transcription-blocking cassette induces the expression of EGFP or EGFPf in LepRb neurons of mice expressing cre recombinase from the LepRb-specific mRNA.
We generated Leprcre;ROSAEGFPf (LepRbEGFPf) mice for comparison to LepRbEGFP mice to systematically define the brain regions that can be modulated by leptin via innervation from LepRb neurons relative to areas in which leptin acts directly on LepRb neurons, respectively. Fixed brains from LepRbEGFP and LepRbEGFPf mice were immunostained for EGFP-immunoreactivity (−IR) and imaged to determine the brain regions containing LepRb neural soma (soma with EGFP-IR in LepRbEGFP mice) and those containing neural projections from LepRb neurons (diffuse EGFP-IR in LepRbEGFPf mice) (Tables 1–2; Supplemental Material).
2.2 Hypothalamic regions containing both LepRb neurons and projections
Overall, the hypothalamus contained both the greatest number of LepRb/EGFP-IR neurons and the greatest density of LepRb (EGFP-IR) projections (Figure 2; Tables 1–2; Supplemental Material). The largest numbers of EGFP-IR neurons in LepRbEGFP mice were found in the ventral premamillary (PMv), arcuate (ARC), and dorsomedial (DMH) nuclei of the hypothalamus (Figure 2; Table 1). While EGFP-containing LepRb soma were distributed throughout the ARC, most neurons in the PMv lay in the middle portion of the nucleus (relative to the dorsoventral axis). In the DMH, EGFP expression was markedly lower in the compact portion. Substantial numbers of LepRb neurons were also present in the posterior hypothalamus (PH), VMH (specifically the dorsomedial portion), the LHA, and the preoptic area (POA) (Table 1; Supplemental Material).
Figure 2. LepRbEGFP and LepRbEGFPf reporter mice reveal LepRb neurons and projections in the hypothalamus and surrounding regions.

Representative fluorescent images (4x) of EGPF-IR of brain sections from LepRbEGFP (left panels) and LepRbEGFPf (right panels (′)) mice in the mid-hypothalamus (A, A′) at the level of the ARC and DMH and at the level of the PMv (B, B′). Higher magnification (10x) images of the indicated regions in A, A′ show the DMH (Aa, Aa′) and ARC (Ab, Ab′). Higher magnification (10X) images of the indicated regions in B, B′ show the PMv (Ba, Ba′). 3v, third-ventricle.
Table 1.
Localization of EGFP-IR soma in LepRbEGFP reporter mice. Relative amounts of EGFP-IR LepRb soma in each brain area.
| FOREBRAIN | EGFP |
|---|---|
| Claustrum | ++ |
| Insular Cortex | ++ |
| Temporal Cortex, Association Area | ++ |
| Somatosensory Cortex | +++ |
| Auditory Cortex | +++ |
| Visual Cortex | + |
| Perirhinal Cortex | + |
| Ectorhinal Cortex | +++ |
| Dorsal Endopiriform Nucleus | +++ |
| Ventral Endopiriform Nucleus | +++ |
| Dentate Gyrus | + |
| CA1, CA2, CA3 | +/− |
| Lateral Septal Nucleus | ++ |
| Bed Nucleus of the Stria Terminalis | ++ |
| Nucleus Accumbens | +/− |
| Central Amygdala | + |
| Substantia Innominata | +/− |
| Paraventricular Thalamic Nucleus | ++ |
| Parafascicular Thalamic Nucleus | + |
| Ventromedial Thalamic Nucleus | + |
| Subparafascicular Thalamic Nucleus | + |
| Ventral Anterior Thalamic Nucleus | + |
| Paraventricular Thalamic Nucleus | + |
| Submedius Thalamic Nucleus | +/− |
| Reuniens Thalamic Nucleus | ++ |
| Reticular Thalamic Nucleus | +/− |
| Anteromedial Thalamic Nucleus | + |
| Central Medial Thalamic Nucleus | +/− |
| Anterior Hypothalamus | + |
| Preoptic Nuclei | +++ |
| Parastrial Nucleus | + |
| Anteroventral Periventricular Nuc | +/− |
| Arcuate Nucleus | ++++ |
| Dorsomedial Hypothalamus | ++++ |
| Lateral Hypothalamus | +++ |
| Paraventricular Nucleus | + |
| Premammillary nucleus, ventral | ++++ |
| Ventromedial Hypothalamus | +++ |
| median eminence | +/− |
| Posterior hypothalamus | +++ |
| Supramammillary Nucleus | ++ |
| Perifornical area | ++ |
| Suprachiasmatic nucleus | + |
| Medial Tuberal Nucleus | + |
| Lateral Habenula | +/− |
| Zona Incerta | + |
| Medial Mammillary | + |
| ventral tuberomammillary nucleus | +/− |
| MIDBRAIN | EGFP |
| nucleus of brachium of inferior colliculus | +/− |
| commissure of inferior colliculus | +++ |
| intermed geniculate nuc/superior colliculus | + |
| Ventral Tegmental Area | +++ |
| Substantia Nigra | +++ |
| Edinger-Westphal Nucleus | +++ |
| Linear Raphe | ++ |
| Dorsal Raphe | +++ |
| A8 Dopamine Cells | + |
| Median Raphe | +/− |
| Periaqueductal Gray | ++++ |
| Lateral Dorsal Tegmental Nucleus | +/− |
| red nucleus | + |
| raphe cap | + |
| Precommissural Nucleus | ++ |
| Cuneiform Nucleus | + |
| medial terminal nuc of acc optic tract | +/− |
| interfascicular nucleus | + |
| interpeduncular nucleus | +/− |
| Deep Mesencephalic Nucleus | +++ |
| Supraoculomotor Cap | + |
| Supraoculomotor Central Gray | + |
| nucleus posterior commissure | + |
| parvocellular oculomotor nucleus | +/− |
| HINDBRAIN | EGFP |
| Pontine Reticular Formation, Oral | ++ |
| Medullary Reticular Nucleus, dorsal | + |
| Nucleus of the Solitary Tract | ++ |
| area postrema | +/− |
| Dorsal Motor Nucleus of Vagus Nerve | + |
| Hypoglossal Nucleus | +/− |
| Parabrachial Nucleus | +++ |
| Parvicellular Reticular Nucleus | + |
| Spinal Trigeminal Nucleus | +/− |
| nucleus ambiguous | +/− |
| cuneate nucleus | +/− |
| Intermediate Reticular Nucleus | + |
| Subcoeruleus Nucleus, Dorsal Part | +/− |
| paralemniscal nucleus | +/− |
| nucleus intercalatus | +/− |
| rostroventrolateral reticular nucleus | +/− |
| prepositus hypoglossal nucleus | + |
++++, highest; +++, high; ++, medium; +, low; +/−, sparse/absent.
Most hypothalamic regions containing EGFP-IR soma in LepRbEGFP mice also contained substantial EGFP-IR projections in LepRbEGFPf mice (Table 2; Figure 2; Supplemental Material). While the distribution of somatic EGFP in LepRbEGFP mice roughly approximated that of EGFPf in LepRbEGFPf mice in most hypothalamic regions (Figure 2; see, e.g., DMH), this was not universally true: In the ARC of LepRbEGFPf mice, copious EGFP-IR projections were observed streaming ventral and lateral to the nucleus in addition to within the main cluster of ARC LepRb soma, and in the PMv little EGFPf was detected except in the area ventral and medial to the main cluster of LepRb neurons (in the region of the ARC). These findings not only reveal the ability of EGFPf to identify projections relative to soma, but also suggest that the area containing PMv LepRb neurons may be sparsely innervated by other LepRb neurons and that PMv LepRb neurons project outside of the PMv, while the opposite may be true for DMH LepRb neurons.
Table 2.
Intensity of EGFPf-IR in LepRbEGFPf reporter mice. Relative maximum density of EGFP-IR in each region by ImageJ quantification.
| FOREBRAIN | EGFP |
|---|---|
| Claustrum | +++ |
| Insular Cortex | ++ |
| Temporal Cortex, Association Area | ++ |
| Somatosensory Cortex | + |
| Auditory Cortex | ++ |
| Visual Cortex | +/− |
| Perirhinal Cortex | + |
| Ectorhinal Cortex | + |
| Dorsal Endopiriform Nucleus | +++ |
| Ventral Endopiriform Nucleus | +++ |
| Dentate Gyrus | + |
| CA1, CA2, CA3 | ++ |
| Lateral Septal Nucleus | + |
| Bed Nucleus of the StriaTerminalis | ++ |
| Nucleus Accumbens | +++ |
| Central Amygdala | ++ |
| Substantia Innominata | + |
| Paraventricular Thalamic Nucleus | + |
| Parafascicular Thalamic Nucleus | +/− |
| Ventromedial Thalamic Nucleus | +/− |
| Subparafascicular Thalamic Nucleus | +/− |
| Ventral Anterior Thalamic Nucleus | +/− |
| Paraventricular Thalamic Nucleus | + |
| Submedius Thalamic Nucleus | +/− |
| Reuniens Thalamic Nucleus | + |
| Reticular Thalamic Nucleus | +/− |
| Central Medial Thalamic Nucleus | +/− |
| Anterior Hypothalamus | ++ |
| Preoptic Nuclei | +++ |
| Parastrial Nucleus | + |
| Anteroventral Periventricular Nuc | +++ |
| Arcuate Nucleus | ++++ |
| Dorsomedial Hypothalamus | +++ |
| Lateral Hypothalamus | ++ |
| Paraventricular Nucleus | +++ |
| Premammillary nucleus, ventral | ++++ |
| Ventromedial Hypothalamus | ++ |
| median eminence | ++++ |
| Posterior hypothalamus | ++ |
| Perifornical area | ++ |
| Suprachiasmatic nucleus | ++ |
| Medial Tuberal Nucleus | +/− |
| Lateral Habenula | +/− |
| Zona Incerta | +/− |
| Medial Mammillary | ++ |
| ventral tuberomammillary nucleus | +/− |
| MIDBRAIN | EGFP |
| nucleus of brachium of inferior colliculus | +/− |
| commissure of inferior colliculus | + |
| intermed geniculate nuc/superior colliculus | ++ |
| Ventral Tegmental Area | +++ |
| Substantia Nigra | +++ |
| Edinger-Westphal Nucleus | +++ |
| Linear Raphe | +++ |
| Dorsal Raphe | ++++ |
| A8 Dopamine Cells | + |
| Median Raphe | +/− |
| Periaqueductal Gray | ++++ |
| Lateral Dorsal Tegmental Nucleus | +/− |
| red nucleus | +/− |
| raphe cap | ++ |
| Precommissural Nucleus | +/− |
| Cuneiform Nucleus | + |
| medial terminal nuc of acc optic tract | +/− |
| interfascicular nucleus | +++ |
| interpeduncular nucleus | ++ |
| Deep Mesencephalic Nucleus | ++ |
| Supraoculomotor Cap | + |
| Supraoculomotor Central Gray | + |
| nucleus posterior commissure | +/− |
| parvocellular oculomotor nucleus | + |
| HINDBRAIN | EGFP |
| Pontine Reticular Formation, Oral | +/− |
| Medullary Reticular Nucleus, dorsal | +/− |
| Nucleus of the Solitary Tract | +++ |
| area postrema | +/− |
| Dorsal Motor Nucleus of Vagus Nerve | + |
| Hypoglossal Nucleus | + |
| Parabrachial Nucleus | ++ |
| Parvicellular Reticular Nucleus | + |
| Spinal Trigeminal Nucleus | +/− |
| nucleus ambiguous | ++ |
| cuneate nucleus | +/− |
| Intermediate Reticular Nucleus | + |
| Subcoeruleus Nucleus, Dorsal Part | +/− |
| paralemniscal nucleus | +/− |
| nucleus intercalatus | + |
| rostroventrolateral reticular nucleus | +/− |
| prepositus hypoglossal nucleus | + |
++++, highest; +++, high; ++, medium; +, low; +/−, sparse/absent.
2.3 Midbrain regions containing both LepRb neurons and projections
Within the midbrain, the largest concentration of LepRb soma and LepRb projections were found in the dorsal raphe (DR) and periaqueductal gray (PAG) with lower amounts in the ventral tegmental area (VTA), the Edinger-Westphal nucleus (EW), and linear raphe (LR) (Figure 3; Tables 1–2; Supplemental Material). LepRb and LepRb projections were also present in the substantia nigra (SN) primarily in the pars compacta, with many fewer cells and projections in the pars reticulata (Tables 1–2; Supplemental Material). A small number of LepRb neurons and projections were also localized in the intermediate geniculate nucleus, the cuneiform nucleus, and in the A8 dopamine cells (Tables 1–2). Overall, the distribution of LepRb soma and projections were similar in these regions, suggesting the presence of projections from local LepRb neurons and/or the innervation of these areas from distant populations of LepRb neurons.
Figure 3. LepRbEGFP and LepRbEGFPf reporter mice reveal LepRb neurons and projections in the midbrain.
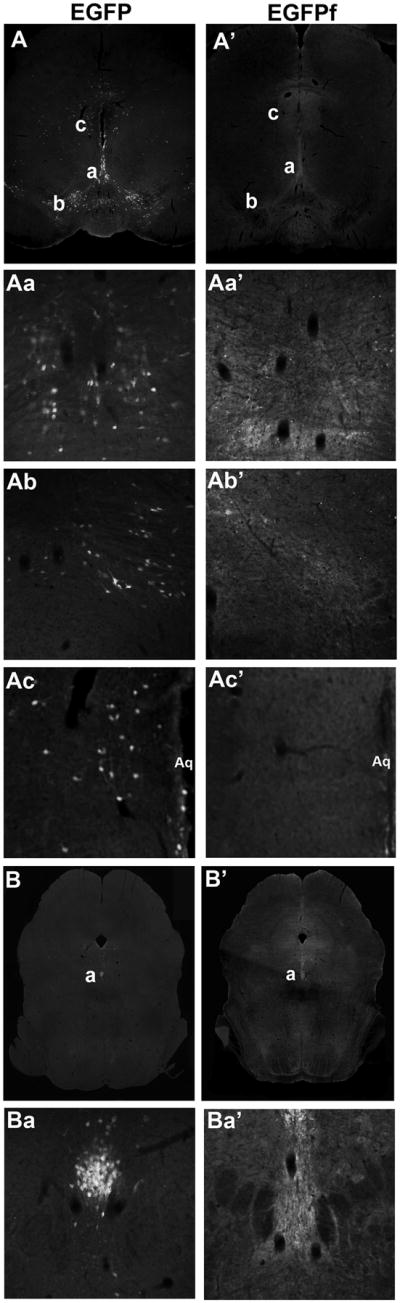
Representative fluorescent images (4x) of EGPF-IR of brain sections from LepRbEGFP (first and third columns) and LepRbEGFPf (second and fourth columns (′)) mice in the midbrain (A, A′) at the level of the VTA and at the level of the DR (B, B′). Higher magnification (10x) images of the indicated regions in A, A′ show the LiR (Aa, Aa′), EW (Ab, Ab′), and VTA (Ac, Ac′). Higher magnification (10X) images of the indicated regions in B, B′ show the DR (Ba, Ba′) and PAG (Bb, Bb′). Aq, aqueduct.
2.4 Hindbrain regions containing both LepRb neurons and projections
In the hindbrain, substantial numbers of LepRb neurons and projections were located in the lateral parabrachial nucleus (LPBN) and within and surrounding the nucleus of the solitary tract (NTS) (Figure 4; Tables 1–2). While LepRb soma and projections were similarly distributed in the LPBN, the density of EGFPf-IR fibers was lower than in other regions with a similar density of EGFP-IR LepRb soma (compare, e.g., to the DMH, Figure 2A), suggesting that, like the PMv, the LPBN receives relatively few projections from local or distant LepRb neurons, and that LPBN LepRb neurons predominantly project outside the LPBN.
Figure 4. LepRbEGFP and LepRbEGFPf reporter mice reveal LepRb neurons and projections in the hindbrain.

Representative fluorescent images (4x) of EGPF-IR of brain sections from LepRbEGFP (left panels) and LepRbEGFPf (right panels (′)) mice in the hindbrain at the level of the LPBN (A, A′) and at the level of the AP and NTS (B, B′). Higher magnification (10x) images of the indicated regions in A, A′ show the LPBN (Aa, Aa′). Higher magnification (10X) images of the indicated regions in B, B′ show the NTS (Ba, Ba′). Aq, aqueduct.
In addition, LepRb projections into the area surrounding the LepRb soma in the NTS were substantially stronger than into the NTS region containing the LepRb soma, suggesting that the NTS LepRb neurons may project outside of the confined area in which they lie, and that, in contrast, the regions surrounding the circumscribed area containing NTS LepRb neurons receive copious innervation from LepRb neurons. Interestingly, the area postrema (AP) was devoid of LepRb soma and projections (Figure 4), suggesting that the integration of leptin action with signals that act via the AP must occur at other sites. Smaller numbers of neurons and projections were identified in the dorsal motor nucleus of the vagus (DMV), the parvicellular reticular nucleus, and the prepositus hypoglossal nucleus (Tables 1–2).
2.5 Additional regions containing LepRb neurons and projections
Substantial numbers of LepRb soma and projections were found in the bed nucleus of the stria terminalis (BNST). Comparatively few cortical regions contained LepRb soma and projections, and most that did were relatively circumscribed. Both LepRb neurons and projections were observed throughout the prefrontal cortex (PFC). The insular cortex, temporal cortex, auditory cortex, and somatosensory cortex all contained discrete pockets of LepRb soma and projections (Tables 1–2; Supplemental Material). Fewer LepRb neurons and sparse LepRb projections were found in the visual cortex. A few LepRb neurons were also detected in the hippocampal formation, along with projections from LepRb neurons, which showed the highest density in CA1-3 and lower concentrations in the dentate gyrus. Scattered LepRb neurons and projections were observed within the thalamus.
2.6 Brain regions predominantly containing projections from LepRb neurons
Our analysis of LepRbEGFP compared to LepRbEGFPf mice also revealed brain regions that contained few or no LepRb soma, but that received copious projections from LepRb neurons, suggesting that these regions represent important targets of LepRb neurons that lie elsewhere in the brain (Figure 5; Tables 1–2). These regions included the anteroventral periventricular nucleus (AVPe), the nucleus accumbens (NAc) subregion that borders the BNST, the paraventricular nucleus of the hypothalamus (PVH), and the central nucleus of the amygdala (CeA). Interestingly, the innervation of these regions by distant LepRb neurons was also detectable as diffuse EGFP-IR in LepRbEGFP mice (although the axonal morphology was less well-defined with standard EGFP than with EGFPf), suggesting the dense innervation of these regions by LepRb neurons.
Figure 5. LepRbEGFP and LepRbEGFPf reporter mice reveal anatomical regions innvervated by LepRb neurons and largely lacking LepRb soma.

Representative fluorescent images (4x) of EGPF-IR of brain sections from LepRbEGFP (first and third columns) and LepRbEGFPf (second and fourth columns (′)) mice in the rostral hypothalamus at the level of the POA and NAc (A, A′), at the level of the PVH (B, B′) and the mid-hypothalamus/amygdala at the level of the CeA (C, C′). Higher magnification (10x) images of the indicated regions in A, A′ show the POA (Aa, Aa′), and NAc (at the border with the BNST) (Ab, Ab′). Higher magnification (10X) images of the indicated regions in B, B′ show the PVH (Ba, Ba′). Higher magnification (10X) images of the indicated regions in C, C′ show the CeA (Ca, Ca′). 3v, third ventricle; Ac, anterior commissure.
3. Discussion
Leptin regulates appetite, energy homeostasis, neuroendocrine function, and a variety of behaviors via LepRb in the brain (Ahima et al., 1999; Bouret and Simerly, 2007; Friedman and Halaas, 1998; Myers et al., 2009; Williams et al., 2009). Understanding the neural mechanisms of leptin action necessarily entails defining the brain sites on which leptin acts directly and indirectly. Here, we have utilized two molecular tools, the LepRbEGFP and LepRbEGFPf mouse models, to elucidate the distribution of LepRb neurons and their projections, respectively, throughout the brain.
3.1 LepRb soma
The distribution of LepRb neurons in the brain revealed by LepRbEGFP mice is similar to that determined by examination of LepRb mRNA expression via in situ hybridization (Elmquist et al., 1998) and a LepRb-EYFP reporter model (Scott et al., 2009) similar to our LepRbEGFP mice. Large populations of LepRb neurons lie in the hypothalamus, especially in the ARC, DMH and PMv; other substantial populations reside in the LHA, VMH, and preoptic areas. The midbrain populations are generally smaller than those of the hypothalamus, with the exception of the PAG; the VTA and Raphe nuclei also contain substantial concentrations of LepRb neurons. Within the brainstem, the LPBN contains a large number of LepRb neurons; the NTS represents the only other hindbrain site with significant numbers of LepRb soma. Additionally, while most cortical sites contain no LepRb neurons, a few regions, including the PFC and other circumscribed areas, contain pockets of LepRb neurons. The thalamus contains relatively few, sparsely-distributed LepRb soma, while the BNST contains a substantial number of LepRb soma throughout the region.
3.2 LepRb projections
In addition to confirming the presence of LepRb soma in these regions, our use of LepRbEGFPf mice enabled us to examine the innervation of brain regions by LepRb neurons. Along with identifying brain areas that receive no “direct” leptin action either from LepRb soma or projections, this analysis revealed differences between the distribution of soma and projections in sites that contain both, or a relative abundance of one over the other.
3.3 Distinct patterns of soma relative to projections in different brain regions
Regions that contain both LepRb soma and projections fall into several distinct classes. Some of these areas, including the hypothalamic PMv and the hindbrain LPBN and NTS, reveal few EGFPf-containing LepRb projections in the vicinity of the LepRb soma relative to other areas with similar numbers of LepRb soma. This pattern reveals few projections (from local or distant sites) into the LepRb soma-containing area, suggesting that while leptin acts directly upon these LepRb neurons, these cells transmit leptin-encoded (and other) information to other areas. This also implies that the soma in these LepRb projection-poor areas do not serve to integrate direct leptin action with information from other LepRb neurons.
3.4 Similarly distributed soma and projections
Other regions (including the hypothalamic ARC, DMH, and LHA, and most midbrain and cortical areas with LepRb soma) contain similarly distributed soma and projections, suggesting that these areas not only contain LepRb neurons, but also receive substantial input from local and/or distant LepRb neurons. These presumably represent areas that process/integrate information from multiple LepRb neurons, in addition to receiving direct leptin stimulation. For the ARC, from which axons can be observed streaming ventrally and laterally, an output function is also likely; indeed, such a function is consistent with the known projection patterns and roles of LepRb-containing POMC and AgRP/NPY neurons in this area (Elias et al., 1999; Elias et al., 1998; Fekete et al., 2000; King and Williams, 1998).
3.5 Projection targets with few or no soma
Areas that receive substantial projections from LepRb neurons, but which contain few LepRb soma, include the PVH, CeA, the subregion of the NAc bordering the BNST, and the region surrounding the LepRb soma-containing area of the NTS. These areas represent output targets of distant LepRb neurons. In the case of the PVH, this finding is consistent with data identifying this region as a target of distant (e.g., ARC and DMH) LepRb neurons, including the well-characterized ARC POMC and AgRP/NPY neurons (Bouret et al., 2004; Elmquist, 2001). Similarly, the LepRb projections to the CeA and NAc are consistent with our previous data demonstrating that the dense innervation of the CeA stems from LepRb neurons, including those in the VTA, while the relatively fewer projections into a small region of the NAc arise from midline midbrain LepRb neurons, such as those in the RLi (Leshan et al., 2010).
A number of conclusions follow from our findings in the hindbrain region containing the NTS and surrounding areas. First, the lack of LepRb soma or projections in the AP reveal that leptin itself does not act directly upon this area, suggesting that integration of leptin signals with those from peptides (e.g., amylin) that act on the AP occurs at other sites. LepRb neurons or projection targets in the NTS represent likely sites for the convergence of signals from leptin with those from the AP, since AP neurons project onto neurons in the NTS (Shapiro and Miselis, 1985). Indeed, while the innervation of the region containing the soma of NTS LepRb neurons contains relatively little EGFPf (few projections), the NTS regions adjacent to the AP and the DMV receive dense projections from LepRb neurons, suggesting the innervation of these areas by NTS LepRb neurons and/or distant (including ARC) LepRb neurons. These observations are consistent with a model in which the hindbrain areas surrounding the NTS LepRb soma integrate signals from substantial numbers of LepRb neurons.
In summary, we have utilized the LepRbEGFP mouse model to verify and characterize the anatomical localization of brain-wide LepRb expression. Furthermore, using the LepRbEGFPf mouse model we have systematically analyzed the regions of the brain receiving innervation directly from LepRb neurons. This analysis has also identified regions of the brain containing substantially greater number of LepRb soma relative to projections and vice-versa, suggesting that some areas that contain soma with few projections serve primarily as sensing sites for leptin, while other regions containing dense soma and projections integrate information from LepRb neurons.
4. Methods
4.1 Animals
LepRbEGFP (Leprcre; Gt(ROSA)26Sortm2Sho) and LepRbEGFPf (Leprcre; Gt(ROSA)26SorEGFPf) mice (Figure 1) were bred in-house in the Unit for Laboratory Animal Medicine (ULAM) at the University of Michigan, as previously described (Leshan et al., 2009). All mice were housed in a 12h light/12h dark cycle, had ad libitum access to food and water. All care and procedures were in accordance with the guidelines and with the approval of the University of Michigan Committee on the Use and Care of Animals.
4.2 Perfusion and Immunolabeling
Forty week-old, female, LepRbEGFP and LepRbEGFPf mice were anesthetized with a lethal dose of intraperitoneal pentobarbital and immediately perfused with 0.1M PBS followed by 10% formalin. Brains were removed, postfixed, and cryoprotected as previously described (Munzberg et al., 2003). Coronal 30μm sections were collected from a sliding microtome in four representative series and stored in cryoprotectant at −20°C until use. For immunofluorescent (IF) labeling, free-floating sections were blocked in normal donkey serum and then incubated with chicken anti-EGFP (Abcam, 1:1000). Sections were then washed and incubated with donkey anti-chicken Alexa-488 (Cell Signaling, 1:200). Following washing, sections were mounted and coverslipped with ProLong Antifade mounting medium (Invitrogen).
4.3 Microscopy and Analysis
Multiple 4x images of each brain section were obtained using an Olympus BX-51 brightfield microscope with attached camera and merged using Adobe Photoshop software (Adobe Systems). For quantification of LepRb expressing neurons in LepRbEGFP mice, the number of EGFP expressing neurons were counted and recorded for each brain region as defined by the Paxinos and Franklin mouse brain atlas (Paxinos and franklin, 2001). Cell counts were performed on merged images and brain regions were categorized based on their number of EGFP expressing neurons. Similarly, LepRb projections were quantified using merged 4x images obtained from LepRbEGFPf mice. Specific brain regions were defined as above and assessed for presence of EGFPf and were quantified using ImageJ software. Briefly, a 0.1 × 0.1 mm ROI was placed on the brightest region of each defined brain area and image density was measured by the image analysis software. Brain regions appearing in several sections were measured multiple times and the highest measurement was used for relative comparison between brain regions.
Supplementary Material
Abbreviations
- AVPe
anteroventral periventricular nucleus
- Ac
anterior commisure
- Aq
aqueduct
- AP
area postrema
- ARC
arcuate nucleus
- BNST
bed nucleus of the stria terminalis
- CeA
central nucleus of the amygdala
- DMH
doromedial hypothalamic nucleus
- DMV
dorsal motor nucleus of the vagus
- DR
dorsal raphe
- EW
Edinger-Westphal nucleus
- EGFP
enhanced green fluorescent protein
- EGFPf
farnesylated enhanced green fluorescent protein
- icv
intracerebroventricular
- ip
intraperitoneal
- IR
immunoreactivity
- LHA
lateral hypothalamic area
- LPBN
lateral parabrachial nucleus
- LepR
leptin receptor
- LiR
linear raphe
- LepRb
long form of the leptin receptor
- NAc
nucleus accumbens
- NTS
nucleus of the solitary tract
- PVH
paraventricular nucleus
- PAG
periaqueductal gray
- PH
posterior hypothalamus
- PFC
prefrontal cortex
- POA
preoptic area
- SN
substantia nigra
- 3v
third ventricle
- PMv
ventral premamillary nucleus
- VTA
ventral tegmental area
Footnotes
Author Contributions: CMP contributed ideas, performed research and wrote the manuscript; RLL contributed ideas, performed research and edited the manuscript; JCJ performed research; MGM contributed ideas and edited the manuscript.
Publisher's Disclaimer: This is a PDF file of an unedited manuscript that has been accepted for publication. As a service to our customers we are providing this early version of the manuscript. The manuscript will undergo copyediting, typesetting, and review of the resulting proof before it is published in its final citable form. Please note that during the production process errors may be discovered which could affect the content, and all legal disclaimers that apply to the journal pertain.
References
- Ahima RS, Kelly J, Elmquist JK, Flier JS. Distinct physiologic and neuronal responses to decreased leptin and mild hyperleptinemia. Endocrinology. 1999;140:4923–4931. doi: 10.1210/endo.140.11.7105. [DOI] [PubMed] [Google Scholar]
- Ahima RS, Prabakaran D, Mantzoros CS, Qu D, Lowell BB, Maratos-Flier E, Flier JS. Role of leptin in the neuroendocrine response to fasting. Nature. 1996;382:250–252. doi: 10.1038/382250a0. [DOI] [PubMed] [Google Scholar]
- Balthasar N, Coppari R, McMinn J, Liu SM, Lee CE, Tang V, Kenny CD, McGovern RA, Chua SC, Jr, Elmquist JK, Lowell BB. Leptin receptor signaling in pomc neurons is required for normal body weight homeostasis. Neuron. 2004;42:983–991. doi: 10.1016/j.neuron.2004.06.004. [DOI] [PubMed] [Google Scholar]
- Bates SH, Dundon TA, Seifert M, Carlson M, Maratos-Flier E, Myers MG., Jr Lrb-stat3 signaling is required for the neuroendocrine regulation of energy expenditure by leptin. Diabetes. 2004;53:3067–3073. doi: 10.2337/diabetes.53.12.3067. [DOI] [PubMed] [Google Scholar]
- Bingham NC, Anderson KK, Reuter AL, Stallings NR, Parker KL. Selective loss of leptin receptors in the ventromedial hypothalamic nucleus results in increased adiposity and a metabolic syndrome. Endocrinology. 2008;149:2138–2148. doi: 10.1210/en.2007-1200. [DOI] [PMC free article] [PubMed] [Google Scholar]
- Bouret SG, Draper SJ, Simerly RB. Formation of projection pathways from the arcuate nucleus of the hypothalamus to hypothalamic regions implicated in the neural control of feeding behavior in mice. J Neurosci. 2004;24:2797–2805. doi: 10.1523/JNEUROSCI.5369-03.2004. [DOI] [PMC free article] [PubMed] [Google Scholar]
- Bouret SG, Simerly RB. Development of leptin-sensitive circuits. J Neuroendocrinol. 2007;19:575–582. doi: 10.1111/j.1365-2826.2007.01563.x. [DOI] [PubMed] [Google Scholar]
- Campfield LA, Smith FJ, Guisez Y, Devos R, Burn P. Recombinant mouse ob protein: Evidence for a peripheral signal linking adiposity and central neural networks. Science. 1995;269:546–549. doi: 10.1126/science.7624778. [DOI] [PubMed] [Google Scholar]
- Chua SC, Jr, Chung WK, Wu-Peng XS, Zhang Y, Liu SM, Tartaglia LA, Leibel RL. Phenotypes of mouse diabetes and rat fatty due to mutations in the ob (leptin) receptor. Science. 1996;271:994–996. doi: 10.1126/science.271.5251.994. [DOI] [PubMed] [Google Scholar]
- Chua SC, Jr, Liu SM, Li Q, Sun A, DeNino WF, Heymsfield SB, Guo XE. Transgenic complementation of leptin receptor deficiency. Ii. Increased leptin receptor transgene dose effects on obesity/diabetes and fertility/lactation in lepr-db/db mice. Am J Physiol Endocrinol Metab. 2004;286:E384–E392. doi: 10.1152/ajpendo.00349.2003. [DOI] [PubMed] [Google Scholar]
- Cohen P, Zhao C, Cai X, Montez JM, Rohani SC, Feinstein P, Mombaerts P, Friedman JM. Selective deletion of leptin receptor in neurons leads to obesity. J Clin Invest. 2001;108:1113–1121. doi: 10.1172/JCI13914. [DOI] [PMC free article] [PubMed] [Google Scholar]
- de Luca C, Kowalski TJ, Zhang Y, Elmquist JK, Lee C, Kilimann MW, Ludwig T, Liu SM, Chua SC., Jr Complete rescue of obesity, diabetes, and infertility in db/db mice by neuron-specific lepr-b transgenes. J Clin Invest. 2005;115:3484–3493. doi: 10.1172/JCI24059. [DOI] [PMC free article] [PubMed] [Google Scholar]
- Dhillon H, Zigman JM, Ye C, Lee CE, McGovern RA, Tang V, Kenny CD, Christiansen LM, White RD, Edelstein EA, Coppari R, Balthasar N, Cowley MA, Chua S, Jr, Elmquist JK, Lowell BB. Leptin directly activates sf1 neurons in the vmh, and this action by leptin is required for normal body-weight homeostasis. Neuron. 2006;49:191–203. doi: 10.1016/j.neuron.2005.12.021. [DOI] [PubMed] [Google Scholar]
- Elias CF, Aschkenasi C, Lee C, Kelly J, Ahima RS, Bjorbaek C, Flier JS, Saper CB, Elmquist JK. Leptin differentially regulates npy and pomc neurons projecting to the lateral hypothalamic area. Neuron. 1999;23:775–786. doi: 10.1016/s0896-6273(01)80035-0. [DOI] [PubMed] [Google Scholar]
- Elias CF, Saper CB, Maratos-Flier E, Tritos NA, Lee C, Kelly J, Tatro JB, Hoffman GE, Ollmann MM, Barsh GS, Sakurai T, Yanagisawa M, Elmquist JK. Chemically defined projections linking the mediobasal hypothalamus and the lateral hypothalamic area. J Comparative Neurology. 1998 [PubMed] [Google Scholar]
- Elmquist JK. Hypothalamic pathways underlying the endocrine, autonomic, and behavioral effects of leptin. Int J Obes Relat Metab Disord. 2001;25(Suppl 5):S78–S82. doi: 10.1038/sj.ijo.0801918. [DOI] [PubMed] [Google Scholar]
- Elmquist JK, Bjorbaek C, Ahima RS, Flier JS, Saper CB. Distributions of leptin receptor mrna isoforms in the rat brain. J Comp Neurol. 1998;395:535–547. [PubMed] [Google Scholar]
- Elmquist JK, Elias CF, Saper CB. From lesions to leptin: Hypothalamic control of food intake and body weight. Neuron. 1999;22:221–232. doi: 10.1016/s0896-6273(00)81084-3. [DOI] [PubMed] [Google Scholar]
- Fekete C, Legradi G, Mihaly E, Huang QH, Tatro JB, Rand WM, Emerson CH, Lechan RM. Alpha-melanocyte-stimulating hormone is contained in nerve terminals innervating thyrotropin-releasing hormone-synthesizing neurons in the hypothalamic paraventricular nucleus and prevents fasting-induced suppression of prothyrotropin-releasing hormone gene expression. J Neurosci. 2000;20:1550–1558. doi: 10.1523/JNEUROSCI.20-04-01550.2000. [DOI] [PMC free article] [PubMed] [Google Scholar]
- Friedman JM, Halaas JL. Leptin and the regulation of body weight in mammals. Nature. 1998;395:763–770. doi: 10.1038/27376. [DOI] [PubMed] [Google Scholar]
- Fulton S, Pissios P, Manchon RP, Stiles L, Frank L, Pothos EN, Maratos-Flier E, Flier JS. Leptin regulation of the mesoaccumbens dopamine pathway. Neuron. 2006;51:811–822. doi: 10.1016/j.neuron.2006.09.006. [DOI] [PubMed] [Google Scholar]
- Grill HJ, Schwartz MW, Kaplan JM, Foxhall JS, Breininger J, Baskin DG. Evidence that the caudal brainstem is a target for the inhibitory effect of leptin on food intake. Endocrinology. 2002;143:239–246. doi: 10.1210/endo.143.1.8589. [DOI] [PubMed] [Google Scholar]
- Hayes MR, Skibicka KP, Leichner TM, Guarnieri DJ, DiLeone RJ, Bence KK, Grill HJ. Endogenous leptin signaling in the caudal nucleus tractus solitarius and area postrema is required for energy balance regulation. Cell Metab. 2010;11:77–83. doi: 10.1016/j.cmet.2009.10.009. [DOI] [PMC free article] [PubMed] [Google Scholar]
- Hommel JD, Trinko R, Sears RM, Georgescu D, Liu ZW, Gao XB, Thurmon JJ, Marinelli M, DiLeone RJ. Leptin receptor signaling in midbrain dopamine neurons regulates feeding. Neuron. 2006;51:801–810. doi: 10.1016/j.neuron.2006.08.023. [DOI] [PubMed] [Google Scholar]
- King PJ, Williams G. Role of arc npy neurons in energy homeostasis. Drug News Perspect. 1998;11:402–410. doi: 10.1358/dnp.1998.11.7.659946. [DOI] [PubMed] [Google Scholar]
- Leinninger GM, Jo YH, Leshan RL, Louis GW, Yang H, Barrera JG, Wilson H, Opland DM, Faouzi MA, Gong Y, Jones JC, Rhodes CJ, Chua S, Jr, Diano S, Horvath TL, Seeley RJ, Becker JB, Munzberg H, Myers MG., Jr Leptin acts via leptin receptor-expressing lateral hypothalamic neurons to modulate the mesolimbic dopamine system and suppress feeding. Cell Metab. 2009;10:89–98. doi: 10.1016/j.cmet.2009.06.011. [DOI] [PMC free article] [PubMed] [Google Scholar]
- Leinninger GM, Myers MG., Jr Lrb signals act within a distributed network of leptin-responsive neurones to mediate leptin action. Acta Physiol (Oxf) 2008;192:49–59. doi: 10.1111/j.1748-1716.2007.01784.x. [DOI] [PubMed] [Google Scholar]
- Leshan RL, Bjornholm M, Munzberg H, Myers MG., Jr Leptin receptor signaling and action in the central nervous system. Obesity (Silver Spring) 2006;14(Suppl 5):208S–212S. doi: 10.1038/oby.2006.310. [DOI] [PubMed] [Google Scholar]
- Leshan RL, Louis GW, Jo YH, Rhodes CJ, Munzberg H, Myers MG., Jr Direct innervation of gnrh neurons by metabolic- and sexual odorant-sensing leptin receptor neurons in the hypothalamic ventral premammillary nucleus. J Neurosci. 2009;29:3138–3147. doi: 10.1523/JNEUROSCI.0155-09.2009. [DOI] [PMC free article] [PubMed] [Google Scholar]
- Leshan RL, Opland DM, Louis GW, Leinninger GM, Patterson CM, Rhodes CJ, Munzberg H, Myers MG., Jr Vta leptin receptor neurons specifically project to and regulate cart neurons of the extended central amygdala. J Neurosci. 2010 doi: 10.1523/JNEUROSCI.1001-10.2010. In Press. [DOI] [PMC free article] [PubMed] [Google Scholar]
- Lu XY. The leptin hypothesis of depression: A potential link between mood disorders and obesity? Curr Opin Pharmacol. 2007;7:648–652. doi: 10.1016/j.coph.2007.10.010. [DOI] [PMC free article] [PubMed] [Google Scholar]
- Lu XY, Kim CS, Frazer A, Zhang W. Leptin: A potential novel antidepressant. Proc Natl Acad Sci USA. 2006;103:1593–1598. doi: 10.1073/pnas.0508901103. [DOI] [PMC free article] [PubMed] [Google Scholar]
- Munzberg H, Huo L, Nillni EA, Hollenberg AN, Bjorbaek C. Role of signal transducer and activator of transcription 3 in regulation of hypothalamic proopiomelanocortin gene expression by leptin. Endocrinology. 2003;144:2121–2131. doi: 10.1210/en.2002-221037. [DOI] [PubMed] [Google Scholar]
- Myers MG, Jr, Munzberg H, Leinninger GM, Leshan RL. The geometry of leptin action in the brain: More complicated than a simple arc. Cell Metab. 2009;9:117–123. doi: 10.1016/j.cmet.2008.12.001. [DOI] [PMC free article] [PubMed] [Google Scholar]
- Paxinos G, franklin kbj. The mouse brain in stereotaxic coordinates. San Diego, CA: Academic Press; 2001. [Google Scholar]
- Ring LE, Zeltser LM. Disruption of hypothalamic leptin signaling in mice leads to early-onset obesity, but physiological adaptations in mature animals stabilize adiposity levels. J Clin Invest. 2010;120:2931–2941. doi: 10.1172/JCI41985. [DOI] [PMC free article] [PubMed] [Google Scholar]
- Robertson SA, Leinninger GM, Myers MG., Jr Molecular and neural mediators of leptin action. Physiol Behav. 2008 doi: 10.1016/j.physbeh.2008.04.005. [DOI] [PMC free article] [PubMed] [Google Scholar]
- Rosenbaum M, Murphy EM, Heymsfield SB, Matthews DE, Leibel RL. Low dose leptin administration reverses effects of sustained weight-reduction on energy expenditure and circulating concentrations of thyroid hormones. J Clin Endocrinol Metab. 2002;87:2391–2394. doi: 10.1210/jcem.87.5.8628. [DOI] [PubMed] [Google Scholar]
- Scott MM, Lachey JL, Sternson SM, Lee CE, Elias CF, Friedman JM, Elmquist JK. Leptin targets in the mouse brain. J Comp Neurol. 2009;514:518–532. doi: 10.1002/cne.22025. [DOI] [PMC free article] [PubMed] [Google Scholar]
- Shapiro RE, Miselis RR. The central neural connections of the area postrema of the rat. J Comp Neurol. 1985;234:344–364. doi: 10.1002/cne.902340306. [DOI] [PubMed] [Google Scholar]
- Vaisse C, Halaas JL, Horvath CM, Darnell JE, Jr, Stoffel M, Friedman JM. Leptin activation of stat3 in the hypothalamus of wild-type and ob/ob mice but not db/db mice. Nature Genetics. 1996;14:95–97. doi: 10.1038/ng0996-95. [DOI] [PubMed] [Google Scholar]
- van de WE, Leshan R, Xu AW, Balthasar N, Coppari R, Liu SM, Jo YH, MacKenzie RG, Allison DB, Dun NJ, Elmquist J, Lowell BB, Barsh GS, de Luca C, Myers MG, Jr, Schwartz GJ, Chua SC., Jr Collective and individual functions of leptin receptor modulated neurons controlling metabolism and ingestion. Endocrinology. 2008;149:1773–1785. doi: 10.1210/en.2007-1132. [DOI] [PMC free article] [PubMed] [Google Scholar]
- Williams KW, Scott MM, Elmquist JK. From observation to experimentation: Leptin action in the mediobasal hypothalamus. Am J Clin Nutr. 2009;89:985S–990S. doi: 10.3945/ajcn.2008.26788D. [DOI] [PMC free article] [PubMed] [Google Scholar]
Associated Data
This section collects any data citations, data availability statements, or supplementary materials included in this article.