

Abstract
Calmodulin (CaM) is a remarkably flexible protein which can bind multiple targets in response to changes in intracellular calcium concentration. It contains four calcium-binding sites, arranged in two globular domains. The calcium affinity of CaM N-terminal domain (N-CaM) is dramatically reduced when the complex with the edema factor (EF) of Bacillus anthracis is formed. Here, an atomic explanation for this reduced affinity is proposed through molecular dynamics simulations and free energy perturbation calculations of the EF-CaM complex starting from different crystallographic models. The simulations show that electrostatic interactions between CaM and EF disfavor the opening of N-CaM domains usually induced by calcium binding. Relative calcium affinities of the N-CaM binding sites are probed by free energy perturbation, and dissociation probabilities are evaluated with locally enhanced sampling simulations. We show that EF impairs calcium binding on N-CaM through a direct conformational restraint on Site 1, by an indirect destabilization of Site 2, and by reducing the cooperativity between the two sites.
Introduction
Calmodulin (CaM) is a member of the EF-hand super-family (1), involved as a calcium sensor in signaling pathways (2–4). It can regulate diverse proteins through its remarkable structural flexibility (5–7). CaM contains two globular domains—N-terminal (N-CaM) and C-terminal (C-CaM)—linked by a flexible helix (8). Each domain contains two EF-hand calcium-binding motifs. Calcium cooperative binding switches CaM conformation from a compact closed state to an open state (9–11), exposing hydrophobic patches that contribute to CaM target recognition (12).
The pathogen Bacillus anthracis indirectly recruits CaM to activate its edema factor (EF). Binding of CaM induces a large conformational transition, which activates EF adenylyl cyclase catalytic site (13), leading to overproduction of cAMP.
CaM is inserted in an unusual extended conformation between EF catalytic core (residues 292–622) and helical domain (residues 660–767) in the EF-CaM complex (14) (Fig. 1). The presence of EF increases calcium affinity of C-CaM site 3 (S3) and site 4 (S4), while it reduces that of N-CaM site 1 (S1) and site 2 (S2) (Table S1 in the Supporting Material). Concomitantly, the stability and even the formation of the EF-CaM complex depends on the level of calcium bound to CaM. The predominant form presents two Ca2+ ions bound to C-CaM (15). Previous molecular dynamics (MD) simulations (16) showed that CaM was less fitted to EF in EF–(0Ca-CaM) and EF–(4Ca-CaM) than in EF–(2Ca-CaM), with weaker interactions and more collective motions.
Figure 1.
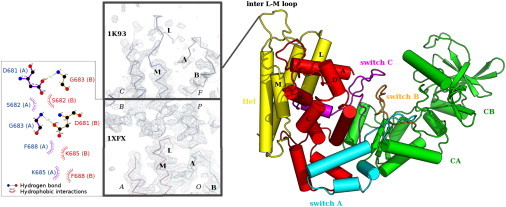
Structure of the EF-CaM complex. In the structure displayed on the right (PDB id 1K93 (14)), CaM (in red) is inserted between the helical domain Hel of EF (in yellow) and the catalytic core of EF composed of domains CA and CB (in green). Switch A (in cyan) is part of CA, switch B (orange) stabilizes the catalytic site, and switch C (magenta) embraces CaM. Electron density maps of the interface between Hel of EF and CaM are displayed on the left, contoured at 1.10 σ with COOT 0.4 (30): chains C and F of 1K93 (14), chains A and O of 1XFX (18) and their symmetry-related chains B and P. (Inset, bottom left) LIGPLOT figure (26) depicts the hydrogen bonds and hydrophobic interactions established between the inter L-M loops of chains A and B of 1XFX.
In this work, we investigate the correlations between EF-CaM and calcium-CaM interactions. Two models of the four-Ca2+ loaded form of EF-CaM were built from two different crystallographic structures (17) (Table S2 in the Supporting Material). The first structure, 1K93 (14), contains the adenylyl cyclase domain of EF (residues 292–798) bound to a two-Ca2+ loaded CaM. The other structure, 1XFX (18), contains the intact EF including its N-terminal protective antigen binding domain (residues 64–291), in complex with a four-Ca2+ loaded CaM.
Although the two structures are globally similar, the backbone conformation of EF at the interface with N-CaM differs. The electron density of this region is better defined in 1XFX (Fig. 1) than in 1K93. The loop located between helices L and M (residues 675–684) seems to form a distorted protruding lace (residues 681–691) in structure 1K93, whereas its conformation is well defined in 1XFX. Indeed, in 1XFX, the inter L-M loop is in contact with a corresponding symmetry-related loop (inset on the left in Fig. 1) and its conformation is tightly packed.
Here, we show that the interaction network between EF and N-CaM can be characterized with molecular dynamics simulations of EF–(4Ca-CaM) derived from 1K93 and 1XFX. The tightness of this network is correlated with the conformation of N-CaM and the calcium coordination in sites S1 and S2. Relative affinities of calcium between these sites were estimated with free energy perturbation (FEP) and locally enhanced sampling (LES) simulations. Calcium-binding structures and affinities in sites S1 and S2 reveal a dynamical interplay between EF-CaM and calcium-CaM interactions.
Material and Methods
Molecular dynamics simulations
Preparation of initial coordinate files
The setup of the coordinate files for MD simulations was performed as described previously (16). The 1k93-4Ca complex was generated from structure 1K93 (14) by adding two Ca2+ in the N-terminal calcium loops of CaM (16). The 1xfx-4Ca complex was obtained directly from structure 1XFX (18) by selecting chains C and Q and removing residues 3–4 of CaM.
Lennard-Jones parameters for Ca2+ ions were taken from the PARM99 set of AMBER 8 (19) (R = 1.7131Å, ɛ = 0.4597898 kcal mol–1 (20)). These parameters satisfactorily reproduce the experimental calcium coordination geometries and dynamics on isolated calmodulin (21) and on the EF-CaM complex (16).
Production and analysis of the trajectories
Fifteen-nanosecond MD simulations of the 1k93-4Ca and 1xfx-4Ca models were produced with AMBER 8 (19), as described previously (16). The relaxation of the systems, containing >80,000 atoms, took 3 ns (16), and therefore the analyses were performed on the 12 ns of simulation after relaxation. The PTRAJ module of AMBER 9 (22) was used to process the trajectories.
The term “EF-hand” found in the literature describes a CaM motif involving helices and is not related to the EF protein. The opening of the EF-hand motifs (23) of CaM was evaluated by calculating the angles formed between the axes of α-helices A (residues 8–19) and B (residues 31–37) for site 1 (S1), helices C (residues 46–53) and D (residues 66–73) for site 2 (S2), helices E (residues 83–92) and F (residues 103–110) for site 3 (S3), and helices G (residues 119–127) and H (residues 139–145) for site 4 (S4). Solvent-accessible surface area (SASA) calculations were performed by MSMS 2.5.3 (24) with a probe sphere radius of 1.5 Å. Hydrogen bonds were identified with the HBPLUS 2.25 program (25) in the LIGPLOT 4.4.2 package (26). Graphics were plotted using the R 2.4.1 package (27). VMD 1.8.3 (28), and PyMOL (29) were used for visualization of the molecular conformations. The electron density maps were visualized with COOT 0.4 (30), using the REFMAC5 dictionary (31).
Locally enhanced sampling simulations
LES simulations were performed with CHARMM (Ver. 33b2) (32). The equilibrated conformations obtained as described above were used as starting points. Water and ions were removed and multiple copies of Ca2+ were inserted. Thirteen runs were performed for each Ca2+ of interest with 1, 2, 4, 8, 16, 18, 20, 22, 24, 26, 28, 30, and 32 replicas of the ion. To mimic the effect of solvent, a sigmoidal dielectric function was used (33,34), (1.416 × r) with a shifting function up to 8 Å (35). A Ca2+ ion was considered dissociated if it was farther than 8 Å from the center-of-mass of residues D20, D22, D24, T26, and E31 of S1 or residues D56, D58, N60, T62, and E67 of S2 at the end of the runs.
Calculations of relative binding free energies
Thermodynamic integration calculations
Relative free energies of calcium dissociation were calculated by free energy perturbation (FEP) (36–38). The free energy difference between the two states of the system, i.e., “0” bound to a Ca2+ ion and “1” unbound, was computed by thermodynamic integration (39).
The potential functions V0 and V1 of the two states are coupled via a parameter λ and the transition of λ from zero to one is simulated to calculate the free energy difference between the states,
| (1) |
where A01 and A00 refer to the free energies of the unbound and bound states, respectively. The angular brackets denote a statistically weighted sampling of conformational space that can (at least approximately) be accomplished by performing molecular dynamics simulations at varying values of λ. Then the integral can be calculated numerically by summing up the weighted average contributions of different λ-windows,
| (2) |
All transformations were set up so that a Ca2+ ion bound to CaM disappeared when changing λ from zero to one.
FEP/MD simulations
Initial configurations for FEP calculations were obtained from the last frames of the MD trajectories described above. FEP/MD simulations were carried out using the SANDER module of AMBER 10 (40) at 300 K and 1 bar, using soft-core potentials, the best variational protocol available in AMBER (41). The systems were first relaxed during 50-ps MD using a 2-fs time-step with SHAKE (42) and a Langevin thermostat with a collision frequency of 2 ps–1. Then, during the FEP, the Langevin thermostat had a collision frequency of 0.5 ps–1. Ca2+ ions were removed in three steps.
First, restraints were applied to ensure reversibility (43). They were set according to the bond conformation of the ions so that, in the backward calculation, a forming particle (a not-yet-localized ghost calcium ion) would be driven to its initial position (see below). The same restraints radii were used to ensure an equal restrained volume in all simulations so that their contributions correctly canceled over the thermodynamic cycle.
Second, the ion charge was removed by successive 300-ps MD runs with λ-values of 0.05, 0.15, 0.25, 0.35, 0.45, 0.55, 0.65, 0.75, 0.85, 0.95, and 1.
Third, the Lennard-Jones potential was subsequently annihilated by a sequence of MD runs with corresponding λ-values of 0.05, 0.15, 0.25, 0.35, 0.45, 0.55, 0.65, 0.75, 0.85, and 0.95.
The restraints were applied as a harmonic potential on the distance between the Ca2+ atom and atoms from the binding loop. Because the systems had different initial positions, restraints were set on specific residues in each case. In S1, the distance of Ca2+ to the geometric center of atoms D20.Cγ, D22.Cγ, D24.Cγ, and T26.C was restrained. In S2, the geometric center of atoms D56.Cγ, D58.Cγ, N60.Cγ, and T62.C was considered in 1k93-4Ca and that of V55.C, D56.Cγ, T62.C, and E67.Cγ was considered in 1xfx-4Ca. The restraint potential was zero for distances d < d0 = 2.5 Å and K(d – d0)2 with K = 1 kcal mol–1 Å–2 otherwise. Hence, all calcium ions were enclosed in equivalent volumes. The harmonic constant was gradually increased during a 1-ns MD from 0.025 to 1 kcal mol–1 Å–2.
The convergence of the simulations was assessed with the autocorrelation functions of the integrand time series. The functions were fitted to a double-exponential model and errors on estimates were evaluated according to Blondel (41) and Straatsma et al. (44). The system proved to be relaxed in 60 ps after each increment of λ, and the integrant was then cumulated for 240 ps.
Results
Interaction network between EF helical domain and N-CaM
Structural and dynamics properties of Ca2+-saturated EF-CaM complexes were studied with 15-ns MD simulations starting from models built with 1K93 and 1XFX crystal structures. Interactions between N-CaM and EF are different in 1k93-4Ca and 1xfx-4Ca models, as shown in Fig. 2. While residues D22 and D24 of CaM contact K680 of EF in 1k93-4Ca, residues D20, K21, D22, and E31 are in contact with K691, E692, and K695 in 1xfx-4Ca. Helix B (HB) of CaM is thus positioned closer to EF and more parallel to CaM helix A (HA) in 1xfx-4Ca than in 1k93-4Ca.
Figure 2.
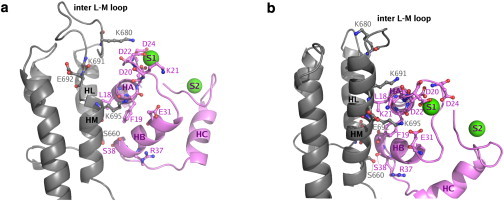
Interface between EF helical domain (residues 657–756) and N-CaM (residues 5–64) in the EF-CaM complex. The conformations taken after 8 ns of MD simulations (a) 1k93-4Ca and (b) 1xfx-4Ca, respectively, are represented in cartoon with PyMOL (29). EF helical domain Hel is colored in gray with helices L (HL), M (HM) and the inter L-M loop labeled in black. N-CaM is colored in pink with helices A (HA), B (HB), C (HC), and S1 and S2 labeled in purple. Residues Ser660, Lys680, Lys691, Glu692, and Lys695 of EF (labels in gray) and residues Leu18, Phe19, Asp20, Lys21, Asp22, Asp24, Glu31, Arg37, and Ser38 of CaM (labels in magenta) are highlighted in licorice, and calcium ions are displayed as green spheres and labeled S1 and S2.
Hydrogen bonds and water molecules bridging helices L and M of EF (residues 657–706) to the first EF-hand of N-CaM (residues 5–38) were monitored along 1k93-4Ca and 1xfx-4Ca simulations (Fig. 3). CaM helix A (HA) residues E11, E14, and S17 make direct contacts with EF (residues 665–691) in both trajectories. By contrast, interaction patterns between EF and CaM S1 (residues 20–28) and helix B (residues 29–38) differ substantially. For instance, K680 of EF is linked by hydrogen bonds to CaM residues D22 (42% of simulation time) and D24 (19%) in 1k93-4Ca (Fig. 3 a), whereas it is not oriented toward CaM in 1xfx-4Ca (Fig. 2 b). Reciprocally, K691 and E692 are not oriented toward CaM in 1k93-4Ca (Fig. 2 a), but they establish water bridges with D20 (27%) and K21 (50%) and hydrogen-bond with K21 (88%) in 1xfx-4Ca (Fig. 3, b and d). Similarly, K695 forms water bridges with L18 (15%) and F19 (52%) in 1k93-4Ca (Fig. 3 c) while it interacts through hydrogen bonds with F19 (76%) and E31 (89%), and through a water bridge with D22 (44%) in 1xfx-4Ca (Fig. 3, b and d). Finally, R37 and S38 of CaM HB are linked to S660 and A661 of EF in 1xfx-4Ca (Fig. 3, b and d) but are too far from EF to establish similar interactions in 1k93-4Ca (Fig. 2 a). Noticeably, new hydrogen bonds were established with the S1 loop (Fig. 3 a) during the 1k93-4Ca simulation. Similarly, the stable hydrogen bond involving E31 (Fig. 3 b) was not found in 1XFX.
Figure 3.
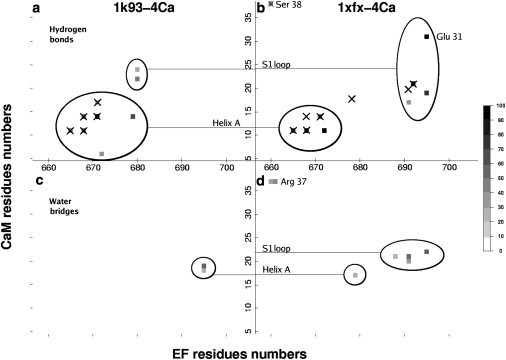
Interaction network between the helical domain of EF (focusing on residues 657–706) and N-CaM (focusing on residues 5–38): (a and b) hydrogen bonds and (c and d) water bridges established in (a and c) 1k93-4Ca and (b and d) 1xfx-4Ca trajectories are materialized (as squares). The potential hydrogen bonds (distance <4 Å) observed in the initial crystallographic structures 1K93 and 1XFX are represented (crosses). (Color code for occupancy through simulation time: light shaded to solid.) Only interactions present for >15% of the simulation time are represented. Labels on the central vertical axis indicate helix A and S1 calcium-binding loop of N-CaM. The associated circles highlight the interactions between these regions of N-CaM and EF.
Thus, S1 of CaM and HB of EF interact more effectively in 1xfx-4Ca than in 1k93-4Ca, and the first CaM EF-hand is more firmly attached to EF in 1xfx-4Ca. The interactions with EF involve 10 residues spread over CaM EF-hand (11,14,17,19–22,31,37 and 38) in 1xfx-4Ca while only four residues of helix A (6,11,14,19) and two of the calcium-binding loop (residues 22 and 24) are involved in 1k93-4Ca. The mechanical constraints involve key CaM calcium-binding residues in 1xfx-4Ca (45,23) that could explain why EF binding reduces N-CaM calcium affinity.
Plasticity of N-CaM
Calcium-induced conformational changes
The starting structure of 1k93-4Ca was that of EF-CaM complex on which two Ca2+ were added on S1 and S2 of CaM (16). By contrast, four Ca2+ ions were already bound to CaM in the initial structure of the 1xfx-4Ca MD trajectory. Calculation of interhelical angles and solvent-accessible surface area (SASA) along 1k93-4Ca previously revealed a partial opening of N-CaM upon calcium addition (16). Indeed, S2 adopts a semiopen conformation in 1k93-4Ca, with an interhelical angle of 75.7° (Table 1). No such conformational change is observed in 1xfx-4Ca. S1 even slightly closes from 45.8° to ∼36.7° during the simulation (Table 1). Furthermore, the SASA of hydrophobic patches in 1xfx-4Ca is 457 ± 44 Å2 in N-CaM (closed) and 742 ± 32 Å2 in C-CaM (open) (Table 1), so both calcium-binding sites of N-CaM are closed in 1xfx-4Ca.
Table 1.
Average interhelical angles (°) of CaM S1, S2, S3, and S4, and solvent-accessible surface area (SASA) in Å2 of CaM N-terminal and C-terminal hydrophobic patches, as defined by Yang et al. (56)
| S1 (°) | S2 (°) | S3 (°) | S4 (°) | SASA (Å2) |
||
|---|---|---|---|---|---|---|
| N-CaM | C-CaM | |||||
| 1K93 (x-ray) | 45.5 ± 0.2 | 56.3 ± 0.0 | 78.1 ± 0.1 | 88.3 ± 0.8 | 641 | 784 |
| 1XFX (x-ray) | 45.8 ± 0.0 | 58.8 ± 0.2 | 76.4 ± 0.0 | 83.0 ± 0.0 | 468 | 733 |
| 1k93-4Ca (MD) | 43.7 ± 7.2 | 75.7 ± 7.7 | 80.4 ± 2.7 | 101.0 ± 4.6 | 505 ± 42 | 840 ± 31 |
| 1xfx-4Ca (MD) | 36.7 ± 4.1 | 55.3 ± 4.5 | 79.3 ± 2.9 | 95.4 ± 3.8 | 457 ± 44 | 742 ± 32 |
Values are given for the crystallographic structures 1K93 of EF–(2Ca-CaM) and 1XFX of EF–(4Ca-CaM) and for the MD trajectories of 1k93-4Ca and 1xfx-4Ca (averaged over the last 12 ns).
Opening of S2 in 1k93-4Ca was associated with a stiffening of the N-terminal part of the calcium-binding loop (residues 54–60) (16). As a counterbalancing effect, increased flexibility was observed in the upstream region comprising HB and the N-terminal part of the inter B-C loop (residues 29–44). In 1xfx-4Ca, HC and the N-terminal part of S2 (residues 45–60) are more flexible (Fig. 4 a). The upstream region (residues 29–44) is more rigid because of tighter EF-HB interactions through residues E31, R37, and S38. The S1 calcium-binding loop (residues 20–29) is also more rigid in 1xfx-4Ca.
Figure 4.
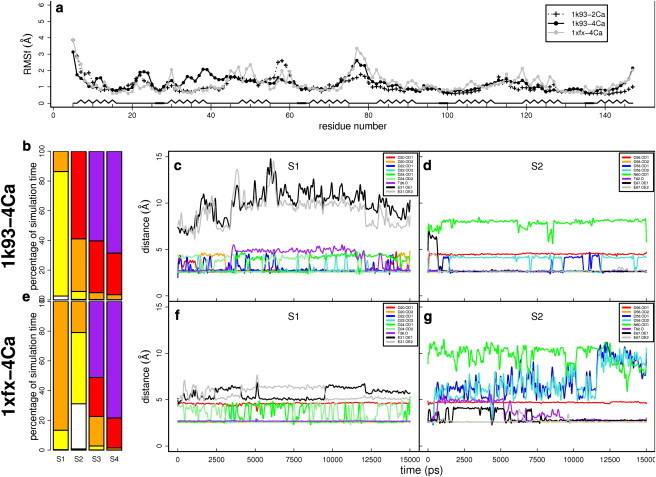
(a) CaM atomic fluctuations per residue over the last 12 ns of 1k93-2Ca (16) (black dashed line and crosses), 1k93-4Ca (black solid line and circles), and 1xfx-4Ca (gray solid line and circles) MD trajectories, and schematics secondary structure. (b–g) Calcium coordination in (b–d) 1k93-4Ca and (e–g) 1xfx-4Ca trajectories, respectively. (b and e) Number of oxygens in the calcium coordination spheres of S1, S2, S3, and S4, with two oxygens displayed in white, three oxygens in yellow, four oxygens in orange, five oxygens in red, and six oxygens in purple. (c and d, f and g) Coordination distances in calcium-binding sites (c) S1 of 1k93-4Ca, (d) S2 of 1k93-4Ca, (f) S1 of 1xfx-4Ca, and (g) S2 of 1xfx-4Ca. In S1, coordination distances are calculated between the cation and Oδ1 of Asp1-20 (red), Oδ2 of Asp1-20 (orange), Oδ1 of Asp3-22 (blue), Oδ2 of Asp3-22 (cyan), Oδ1 of Asp5-24 (dark green), Oδ2 of Asp5-24 (light green), O of Tyr7-26 (purple), Oɛ1 of Glu12-31 (black), and Oɛ2 of Glu12-31 (gray). In S2, coordination distances are calculated between the calcium ion and Oδ1 of Asp1-56 (red), Oδ2 of Asp1-56 (orange), Oδ1 of Asp3-58 (blue), Oδ2 of Asp3-58 (cyan), Oδ1 of Asn5-60 (dark green), O of Tyr7-62 (purple), Oɛ1 of Glu12-67 (black), and Oɛ2 of Glu12-67 (gray). The optimal coordination distance is 2.6 Å.
Calcium coordination
The canonical CaM calcium-binding site is formed by residues Asp1, Asp3, (Asp/Asn)5, X7, and Glu12 from the interhelical binding loop. Complete calcium coordination is achieved by six oxygen atoms located at 2.6 Å of the cation: one Oδ of Asp1, one Oδ of Asp3, one Oδ of (Asp/Asn)5, the backbone oxygen of residue X7, and both oxygens Oɛ of Glu12. Six-oxygen coordination is observed in both C-terminal CaM sites, S3 and S4.
By contrast, the N-terminal sites (S1 and S2) are not fully coordinated neither in 1k93-4Ca nor in 1xfx-4Ca (Fig. 4). In 1k93-4Ca, S2 makes a tighter coordination of the cation than S1 (Fig. 4 b): five oxygens are involved in >50% of the simulation time in S2, while, at most, three oxygens are involved in S1. The situation is inverted in 1xfx-4Ca (Fig. 4 e): the number of coordinating oxygens ranges from two to four in S2 while in S1 four oxygens coordinate Ca2+ at least during 80% of the simulation. The side chain of Asp3-58 flips, swapping the oxygens positions in 1k93-4Ca (cyan and blue curves in Fig. 4 d). In 1xfx-4Ca, by contrast, they leave the coordination sphere (Fig. 4 g). Therefore, Ca2+ coordination in S2 appears much more unstable in 1xfx-4Ca than in 1k93-4Ca.
The greater flexibility of S1 in 1k93-4Ca relative to 1xfx-4Ca can be associated with more stable ion-oxygen bonds (Fig. 4, a –c, e, and f). Nevertheless, Ca2+-Glu12-31 distances are greater in 1k93-4Ca (10 Å) than in 1xfx-4Ca (6Å) (Fig. 4, c and f, black and gray curves), and the backbone oxygen of Thr7-26 in 1k93-4Ca moves 5 Å away from the cation (Fig. 4 c, purple curve).
By contrast, the cation bound to S2 misses the coordination by Asn5-60 in both 1k93-4Ca and 1xfx-4Ca, and the two side-chain oxygens of Glu12-67 are located far from the Ca2+ ion in both initial structures (>4 Å). However, they come into the coordination sphere at 2.6 Å (black and gray curves), and stick close to the cation through the whole 1k93-4Ca simulation (Fig. 4 d) and during the second-half of the 1xfx-4Ca trajectory (Fig. 4 g).
N-CaM calcium coordination is incomplete for both 1k93-4Ca and 1xfx-4Ca, in agreement with the lower calcium affinity of this domain. Calcium addition induces a partial opening of the second N-CaM EF-hand in 1k93-4Ca, whereas both EF-hands of N-CaM are closed in 1xfx-4Ca (Table 1). Ca2+ coordination in S1 is stronger in 1xfx-4Ca than in 1k93-4Ca. On the other hand, coordination in S2 seems stronger in 1k93-4Ca, because it is not directly constrained by EF and is, thus, more flexible than S1.
Calcium affinity of CaM N-terminal sites S1 and S2
Calcium dissociation from N-CaM through LES simulations
The locally enhanced sampling (LES) method, designed to explore the motions of a subset of atoms within a larger molecular system (46), was applied here on the Ca2+ ions. Ions are replicated. Replicas do not interact with each other. Protein-replica interactions are scaled according to the replica number (34), reducing the dissociation energy barriers and increasing dissociation rates exponentially (47).
Independent LES simulations were performed for each Ca2+ dissociation from sites S1 or S2 in 1xfx-4Ca or 1k93-4Ca (Table 2). Ca2+ was replicated 1, 2, 4, 8, 16, 18, 20, 22, 24, 26, 28, 30, or 32 times for each site.
Table 2.
Locally enhanced sampling (LES) MD simulations of the EF-CaM complex
| Number of copies | LES-1k93-(S1) | LES-1k93-(S2) | LES-1xfx-(S1) | LES-1xfx-(S2) |
|---|---|---|---|---|
| 1 | N | N | N | N |
| 2 | N | N | N | N |
| 4 | N | N | N | N |
| 8 | N | N | N | N |
| 16 | S | N | S | N |
| 18 | S | N | S | N |
| 20 | S | S | S | S |
| 22 | 4D | S | S | S |
| 24 | 7D | S | 6D | S |
| 26 | 17D | 1D | 16D | 10D |
| 28 | 17D | 4D | 9D | 6D |
| 30 | 29D | 8D | 22D | 29D |
| 32 | 32D | 19D | 32D | 32D |
The calcium ion bound to either S1 (1) or S2 (2) is duplicated in 1, 2, 4, 8, 16, 18, 20, 22, 24, 26, 28, 30, or 32 copies and dissociation events are observed during 200 ps of LES simulation: (N) No dissociation observed. (S) Started dissociation (some copies may even go out and come back in). (D) Number of dissociated copies at the end of the simulation.
For both 1k93-4Ca and 1xfx-4Ca, at least 16 copies were necessary to dissociate ions from S1 and 20 copies were necessary for S2 (Table 2), indicating that the ions were more firmly attached to S2. Full dissociations occurred with fewer copies in LES-1k93-(S1), the dissociation probability being 18% with 22 copies. By contrast, 26 copies were necessary to observe dissociation in LES-1k93-(S2). Moreover, dissociation probabilities in LES-1k93-(S1) were higher than those in LES-1k93-(S2) from 22 to 32 copies. All calcium ions dissociated in LES-1k93-(S1) with 32 copies. The stronger binding of calcium to S2 relative to S1 in 1k93-4Ca is consistent with the more complete calcium coordination in S2 observed in the previous section.
Calcium also dissociated with less copies in LES-1xfx-(S1) (24 copies) than in LES-1xfx-(S2) (26 copies). However, the dissociation probabilities were similar and all copies dissociated in both 32-copy simulations. Dissociation frequencies suggest that the calcium affinity of CaM S2 is lowered in 1xfx-4Ca compared to 1k93-4Ca, whereas calcium affinity of S1 is slightly improved, in agreement with coordination numbers computed in the previous section (Fig. 4, b and e).
Binding free energies estimates with FEP/MD simulations
The relative free energies of calcium dissociation from N-terminal sites S1 and S2 of CaM were estimated with FEP/MD simulations (Table 3 and Fig. 5). This method arguably provides accurate free energies estimates, provided that the convergence of MD simulations is sufficient (48). Here we intended to sample conformations in the vicinity of initial structures. The Ca2+ dissociation was simulated in three steps: first, a positional restraint was applied to ensure reversibility; second, charges were removed; and, third, Lennard-Jones interactions were annihilated. This procedure was applied to avoid numerical instabilities (49). The time autocorrelation functions of the integrand time series fit well to a biexponential model (Fig. S1 and Fig. S2 in the Supporting Material). The fast decrease shows a good convergence. The calculated free energies (Table 3) are of the same order of magnitude as previously reported Ca2+ hydration free energies (50).
Table 3.
Relative calcium dissociation free energies from S1 and S2 in the 1k93-4Ca and 1xfx-4Ca complexes
| 1k93-4ca |
1xfx-4ca |
|||
|---|---|---|---|---|
| S1 | S2 | S1 | S2 | |
| ΔGele | 319.03 ± 0.33 | 330.77 ± 0.79 | 329.53 ± 0.40 | 323.59 ± 0.52 |
| ΔGvdw | −3.19 ± 0.17 | −3.09 ± 0.24 | −2.89 ± 0.20 | 0.40 ± 0.12 |
| ΔGdiss | 315.84 ± 0.37 | 327.68 ± 0.82 | 326.65 ± 0.45 | 323.99 ± 0.53 |
ΔGele is the estimate obtained from the first step of charge removal, ΔGvdw is the estimate obtained from the second step of atom type and van der Waals parameters annihilation, and ΔGdiss is the estimate of the total relative free energy of dissociating the calcium. All values are in kcal/mol. Errors on ΔGele and ΔGvdw are evaluated as , where erri is the error computed on the MD production run corresponding to the ith frame of λ-value. Errors on ΔGdiss are evaluated as .
Figure 5.
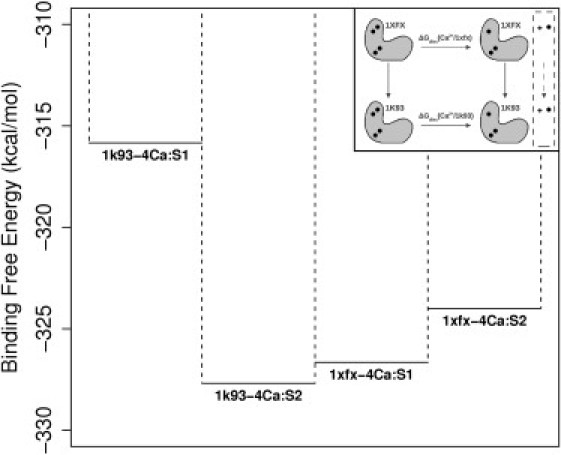
Relative calcium-binding affinities (kcal/mol) of S1 and S2 in the 1k93-4Ca and 1xfx-4Ca complexes. (Inset) Description of the thermodynamic cycle allowing the comparison of calcium ion dissociation energies from the 1k93-4Ca and 1xfx-4Ca complexes. (Horizontal reaction) Calculated values depicted in the figure and in Table 3. (Vertical arrows) Conformational change between the 1xfx-4Ca complex and the 1k93-4Ca one. (Solid circles) Calcium ions. They are displaced from the protein to a vacuum volume defined by the geometrical constraints (dashed box). For the comparison, the transfer energies from that vacuum volume to bulk solvent cancels out by virtue of the thermodynamic cycle.
Errors on estimates were evaluated using the method of Blondel (41) and Straatsma et al. (44). Predicted errors were small compared to usual errors for FEP calculations (1–2 kcal mol–1 (49)), reflecting very good convergence properties (Fig. S1 and Fig. S2). However, these errors must be considered as minimal estimates because they can only be evaluated from data themselves. The positional restraints did not have a direct free-energy contribution in the application phase: Ca2+ ions are firmly attached to their binding site.
Calcium free energy of association from S2 appeared ∼3.7 kcal mol–1 weaker for 1xfx-4Ca than for 1k93-4Ca (Table 3 and Fig. 5), in agreement with LES simulations. For S1, on the other hand, Ca2+ association free energy appeared ∼10.8 kcal mol–1 stronger in 1xfx-4Ca than in 1k93-4Ca. LES simulations showed the same tendency, but not its magnitude. The dissociation free energy from S1 in 1k93-4Ca appeared particularly low, and the other site, S2, showed an affinity ∼11.8 kcal mol–1 higher. By contrast, in 1xfx-4Ca, the affinity of S1 is only ∼2.67 kcal mol–1 higher than that of S2.
Relative calcium-binding free energies obtained with FEP/MD simulations confirm the qualitative trends revealed by LES simulations. The strongest calcium affinity was found in S2 for 1k93-4Ca configuration, while the weakest was in S1 of the same system. The two sites of 1xfx-4Ca had similar affinities in inverted order. Interestingly, computed calcium affinities mirror the association patterns in the structures: in 1xfx-4Ca, CaM is firmly attached to EF along the two EF-hands of N-CaM whereas, in 1k93-4Ca, the second EF-hand is not tightly bound to EF and can relax (Fig. 2). Thus, both LES and FEP/MD studies show that EF modulates the affinities of the two sites and their balance.
Discussion
The motivation for this study stemmed from the work of Ulmer et al. (15), who revealed that N-CaM calcium affinity was dramatically reduced by formation of EF-CaM complex. Then, Shen et al. (18) obtained a crystallographic structure of EF-CaM complex (1XFX), displaying an incomplete Ca2+coordination in N-CaM: Glu12-31 was far from the cation in S1, while Asn5-60 and Glu12-67 were far from the cation in S2.
Here, we probed the interplay between EF-CaM and Ca2+-CaM interactions by analysis of the dynamics properties of the complex in the vicinity of two microstates of the EF-(4Ca-CaM) complex. The two microstates display two archetypal conformations of the flexible inter L-M loop of EF at the interface with N-CaM. One conformation is well defined and tightly packed in the crystal, while the other is poorly defined and distorted. MD simulations extend crystallographic observations: The closed conformation of N-CaM in 1xfx-4Ca is maintained by EF through a dense network of interactions whereas, in 1k93-4Ca, the interaction network is weaker, enabling a partial opening of N-CaM upon calcium binding (16).
Ca2+ coordination in N-CaM provides insights into the EF-hand opening and the mechanism underlying the CaM conformational switch (5). For instance, in S1, Glu12-31 cannot coordinate the cation, either because of the N-CaM flexibility in 1k93-4Ca, or because of electrostatic restraints in N-CaM/EF interaction in 1xfx-4Ca. This glutamate was identified to play a crucial role in the calcium-induced conformational switch (51,45). Indeed, the crystallographic structure of a CaM trapped intermediate (45) revealed the following mechanism:
-
1.
Ca2+ binds to the N-terminal part of the binding loop (residues 1, 3, 5, and 7); and
-
2.
Glu12 comes into the Ca2+ coordination sphere, with the departing helix rotating and the EF-hand opening.
The persistence of Ca2+-S2 interactions in 1xfx-4Ca simulation agrees with previous steered MD simulations: bonds to Asp3 and Glu12 are the first to brake during dissociation (52). Disruption of Asp3-58 oxygen coordination could thus be interpreted as a first step toward dissociation. However, a more recent steered MD study of calcium dissociation from S3 and S4 revealed a two-step mechanism whereby Ca2+ ions leave Asp1, (Asp/Asn)7, and Glu12 before Asp3 and Asp5 (53). Thus, the lack of coordination observed in 1xfx-4Ca for Asp3 and Asp5 in S2 while Asp1, (Asp/Asn)7, and Glu12 are still bound to calcium suggests a distorted calcium-binding loop.
The previous analysis supports the importance of Glu12 for calcium coordination in EF-hand. However, in class II myosins, the corresponding residue is not required for calcium binding (54). Indeed, Physarium and scallop myosins adopt an atypical octahedral coordination geometry, although they feature conventional calcium-binding loops. Calcium binding alters internal dynamics of the protein, but does not induce large conformational change like for calmodulin. The observation made here for calmodulin may not apply to all EF-hand proteins.
LES simulations give a qualitative evaluation of Ca2+ ion-binding strengths in sites S1 and S2, in good agreement with the calcium coordination mode, and more interestingly with FEP calculations, despite the simple implicit solvent and the scaling of the interactions.
Free energies of calcium dissociation were estimated by FEP with thermodynamic integration. Because the 1xfx-4Ca model was derived directly from the x-ray structure 1XFX, we expected realistic values. Indeed, S1 has a 2.66 kcal mol–1 stronger affinity than S2, in agreement with the location of the calcium in S1 in the three-Ca2+ EF-CaM complex (18). Conversely, the 1k93-4Ca model was built by addition of two calcium ions to N-CaM as a perturbation of 1K93 x-ray structure. Therefore, Ca2+ affinities calculated with 1k93-4Ca simulations must be considered as a model, and the 11.84 kcal mol–1 gap between the two sites suggests an extremely weakly populated S1 site in this conformation. Nevertheless, they highlight the impact of the conformation of the inter L-M loop on S1 calcium affinity and reveals that EF breaks the cooperativity between N-CaM calcium-binding sites. The higher affinity form adopted by S2 in 1k93-4Ca compared to 1xfx-4Ca and the L-M loop conformational changes hamper calcium binding to S1.
In 1k93-4Ca, the N-terminal part of S1 and CaM helix A form several contacts with the helical domain of EF. S2, on the other hand, does not interact directly with EF and is more flexible. Binding of a Ca2+ ion can thus induce a reorientation of the helices and partially opens the EF-hand. This conformational change is propagated from S2 to S1 through helix B, which flexibility is increased to compensate the stiffening of the N-terminal part of S2 loop. This compensation was already observed in our previous MD study of the propagation of the electrostatic effect of Ca2+ binding in the EF-CaM complex (55). Hence, it appears that the balance between binding affinities of S1 and S2 is dependent on the propagation of the calcium-binding signal through CaM structure.
S1 position relative to EF is moved and tilted in 1xfx-4Ca compared to 1k93-4Ca, and interactions with EF are established through helix A, the calcium-binding loop of S1, and both extremities of helix B. Consequently, because EF closes S1 through a denser interaction network and a coupling between the two sites, S2 has less freedom to relax upon calcium binding, and remains in a closed conformation despite the absence of direct EF contact. Our analysis revealed a direct link between the conformation of the inter L-M loop and the conformation and calcium affinity of S1, and indirectly with those of S2.
Conclusions
We investigated the interplay among the EF-CaM and Ca2+-CaM interactions and association by structural analysis, MD simulations, and free energy calculations. The exploration of the conformational space surrounding two x-ray crystallographic structures of EF-CaM revealed the plasticity of the EF-CaM interface. MD simulations and free energy calculations unveiled the impact of the network of interactions between the EF helical domain and N-CaM on the affinity of N-CaM for calcium, and consequently to the overall stability of the complex. This study also contributes to better understanding of the mechanisms underlying calcium binding on CaM through the evaluation of the energetic interplay between the EF-CaM and the CaM-Ca2+ interfaces and its amplitude. The strong interactions of calcium with its environment allow the detection of large variations for the CaM-Ca2+ interaction. Because free energies of biological systems as a whole should remain within a limited range, these variations suggest similarly large compensating variations for EF-CaM interactions as a result of calcium binding on CaM. These variations should take place within the structural relaxations corresponding to the difference between the structures of 1k93 and 1xfx.
Acknowledgments
We acknowledge the French National Calculations Centers' Institut du Développement et des Ressources en Informatique Scientifique (IDRIS, Orsay) and Centre Informatique National de l'Enseignement Supérieur (CINES, Montpellier) for computational resources.
This work was supported by the French Ministry of Defense, Direction Générale pour l'Armement/Mission pour la Recherche et l'Innovation Scientifique (DGA/MRIS), the National Scientific Research Center, Centre National de la Recherche Scientifique (CNRS), the Institut Pasteur, and Coordenação de Aperfeiçoamento de Pessoal de Nível Superior (CAPES, Brazil).
Footnotes
Leandro Martinez's present address is Institute of Chemistry, State University of Campinas (UNICAMP), Brazil.
Contributor Information
Elodie Laine, Email: elaine@pasteur.fr.
Thérèse E. Malliavin, Email: terez@pasteur.fr.
Supporting Material
References
- 1.Ikura M., Ames J.B. Genetic polymorphism and protein conformational plasticity in the calmodulin superfamily: two ways to promote multifunctionality. Proc. Natl. Acad. Sci. USA. 2006;103:1159–1164. doi: 10.1073/pnas.0508640103. [DOI] [PMC free article] [PubMed] [Google Scholar]
- 2.Chin D., Means A.R. Calmodulin: a prototypical calcium sensor. Trends Cell Biol. 2000;10:322–328. doi: 10.1016/s0962-8924(00)01800-6. [DOI] [PubMed] [Google Scholar]
- 3.Van Eldik L., Watterson D., editors. Calmodulin and Signal Transduction. Academic Press; San Diego, CA: 1998. [Google Scholar]
- 4.Vogel H.J. The Merck Frosst Award Lecture 1994. Calmodulin: a versatile calcium mediator protein. Biochem. Cell Biol. 1994;72:357–376. [PubMed] [Google Scholar]
- 5.Valeyev N.V., Bates D.G., Kotov N.V. Elucidating the mechanisms of cooperative calcium-calmodulin interactions: a structural systems biology approach. BMC Syst. Biol. 2008;2:48. doi: 10.1186/1752-0509-2-48. [DOI] [PMC free article] [PubMed] [Google Scholar]
- 6.Crivici A., Ikura M. Molecular and structural basis of target recognition by calmodulin. Annu. Rev. Biophys. Biomol. Struct. 1995;24:85–116. doi: 10.1146/annurev.bb.24.060195.000505. [DOI] [PubMed] [Google Scholar]
- 7.Weinstein H., Mehler E.L. Ca2+-binding and structural dynamics in the functions of calmodulin. Annu. Rev. Physiol. 1994;56:213–236. doi: 10.1146/annurev.ph.56.030194.001241. [DOI] [PubMed] [Google Scholar]
- 8.Babu Y.S., Sack J.S., Cook W.J. Three-dimensional structure of calmodulin. Nature. 1985;315:37–40. doi: 10.1038/315037a0. [DOI] [PubMed] [Google Scholar]
- 9.Finn B.E., Evenäs J., Forsén S. Calcium-induced structural changes and domain autonomy in calmodulin. Nat. Struct. Biol. 1995;2:777–783. doi: 10.1038/nsb0995-777. [DOI] [PubMed] [Google Scholar]
- 10.Kuboniwa H., Tjandra N., Bax A. Solution structure of calcium-free calmodulin. Nat. Struct. Biol. 1995;2:768–776. doi: 10.1038/nsb0995-768. [DOI] [PubMed] [Google Scholar]
- 11.Zhang M., Tanaka T., Ikura M. Calcium-induced conformational transition revealed by the solution structure of apo calmodulin. Nat. Struct. Biol. 1995;2:758–767. doi: 10.1038/nsb0995-758. [DOI] [PubMed] [Google Scholar]
- 12.Ishida H., Takahashi K., Yazawa M. Solution structures of the N-terminal domain of yeast calmodulin: Ca2+-dependent conformational change and its functional implication. Biochemistry. 2000;39:13660–13668. doi: 10.1021/bi000582x. [DOI] [PubMed] [Google Scholar]
- 13.Liddington R.C. Anthrax: a molecular full nelson. Nature. 2002;415:373–374. doi: 10.1038/415373a. [DOI] [PubMed] [Google Scholar]
- 14.Drum C.L., Yan S.Z., Tang W.J. Structural basis for the activation of anthrax adenylyl cyclase exotoxin by calmodulin. Nature. 2002;415:396–402. doi: 10.1038/415396a. [DOI] [PubMed] [Google Scholar]
- 15.Ulmer T.S., Soelaiman S., Bax A. Calcium dependence of the interaction between calmodulin and anthrax edema factor. J. Biol. Chem. 2003;278:29261–29266. doi: 10.1074/jbc.M302837200. [DOI] [PubMed] [Google Scholar]
- 16.Laine E., Yoneda J.D., Malliavin T.E. The conformational plasticity of calmodulin upon calcium complexation gives a model of its interaction with the edema factor of Bacillus anthracis. Proteins. 2008;71:1813–1829. doi: 10.1002/prot.21862. [DOI] [PubMed] [Google Scholar]
- 17.Berman H.M., Westbrook J., Bourne P.E. The Protein DataBank. Nucleic Acids Res. 2000;28:235–242. doi: 10.1093/nar/28.1.235. [DOI] [PMC free article] [PubMed] [Google Scholar]
- 18.Shen Y., Zhukovskaya N.L., Tang W.J. Calcium-independent calmodulin binding and two-metal-ion catalytic mechanism of anthrax edema factor. EMBO J. 2005;24:929–941. doi: 10.1038/sj.emboj.7600574. [DOI] [PMC free article] [PubMed] [Google Scholar]
- 19.Case D.A., Darden T.A., Kollman P.A. University of California; San Francisco, CA: 2004. AMBER 8. [Google Scholar]
- 20.Aqvist J. Ion-water interaction potentials derived from free energy perturbation simulations. J. Phys. Chem. 1990;94:8021–8024. [Google Scholar]
- 21.Fiorin G., Biekofsky R.R., Carloni P. Unwinding the helical linker of calcium-loaded calmodulin: a molecular dynamics study. Proteins. 2005;61:829–839. doi: 10.1002/prot.20597. [DOI] [PubMed] [Google Scholar]
- 22.Case D.A., Darden T.A., Kollman P.A. University of California; San Francisco, CA: 2006. AMBER 9. [Google Scholar]
- 23.Lewit-Bentley A., Réty S. EF-hand calcium-binding proteins. Curr. Opin. Struct. Biol. 2000;10:637–643. doi: 10.1016/s0959-440x(00)00142-1. [DOI] [PubMed] [Google Scholar]
- 24.Sanner, M. F., A. J. Olson, and J. C. Spehner. 1995. Fast and robust computation of molecular surfaces. In Proceedings of the 11th Annual ACM Symposium on Computational Geometry.
- 25.McDonald I.K., Thornton J.M. Satisfying hydrogen bonding potential in proteins. J. Mol. Biol. 1994;238:777–793. doi: 10.1006/jmbi.1994.1334. [DOI] [PubMed] [Google Scholar]
- 26.Wallace A.C., Laskowski R.A., Thornton J.M. LIGPLOT: a program to generate schematic diagrams of protein-ligand interactions. Protein Eng. 1995;8:127–134. doi: 10.1093/protein/8.2.127. [DOI] [PubMed] [Google Scholar]
- 27.R Development Core Team. 2006. R: A Language and Environment for Statistical Computing. R Foundation for Statistical Computing, Vienna, Austria. http://www.R-project.org. ISBN 3–900051–07–0. Accessed September 9, 2010.
- 28.Humphrey W., Dalke A., Schulten K. VMD: visual molecular dynamics. J. Mol. Graph. 1996;14:33–38. doi: 10.1016/0263-7855(96)00018-5. 27–28. [DOI] [PubMed] [Google Scholar]
- 29.Delano, W. L. 2002. The PyMOL molecular graphics system. http://www.pymol.org. Accessed September 9, 2010.
- 30.Emsley P., Cowtan K. COOT: model-building tools for molecular graphics. Acta Crystallogr. D Biol. Crystallogr. 2004;60:2126–2132. doi: 10.1107/S0907444904019158. [DOI] [PubMed] [Google Scholar]
- 31.Vagin A.A., Steiner R.A., Murshudov G.N. REFMAC5 dictionary: organization of prior chemical knowledge and guidelines for its use. Acta Crystallogr. D Biol. Crystallogr. 2004;60:2184–2195. doi: 10.1107/S0907444904023510. [DOI] [PubMed] [Google Scholar]
- 32.Brooks B.R., Bruccoleri R.E., Karplus M. CHARMM—a program for macromolecular energy, minimization, and dynamics calculations. J. Comput. Chem. 1983;4:187–217. [Google Scholar]
- 33.Lavery R., Sklenar H., Pullman B. The flexibility of the nucleic acids: (II). The calculation of internal energy and applications to mononucleotide repeat DNA. J. Biomol. Struct. Dyn. 1986;3:989–1014. doi: 10.1080/07391102.1986.10508478. [DOI] [PubMed] [Google Scholar]
- 34.Blondel A., Renaud J.P., Karplus M. Retinoic acid receptor: a simulation analysis of retinoic acid binding and the resulting conformational changes. J. Mol. Biol. 1999;291:101–115. doi: 10.1006/jmbi.1999.2879. [DOI] [PubMed] [Google Scholar]
- 35.Laine E., Goncalves C., Blondel A. Use of allostery to identify inhibitors of calmodulin-induced activation of Bacillus anthracis edema factor. Proc. Natl. Acad. Sci. USA. 2010;107:11277–11282. doi: 10.1073/pnas.0914611107. [DOI] [PMC free article] [PubMed] [Google Scholar]
- 36.Miyamoto S., Kollman P.A. Absolute and relative binding free energy calculations of the interaction of biotin and its analogs with streptavidin using molecular dynamics/free energy perturbation approaches. Proteins. 1993;16:226–245. doi: 10.1002/prot.340160303. [DOI] [PubMed] [Google Scholar]
- 37.Gouda H., Kuntz I.D., Kollman P.A. Free energy calculations for theophylline binding to an RNA aptamer: comparison of MM-PBSA and thermodynamic integration methods. Biopolymers. 2003;68:16–34. doi: 10.1002/bip.10270. [DOI] [PubMed] [Google Scholar]
- 38.Steinbrecher T., Case D.A., Labahn A. A multistep approach to structure-based drug design: studying ligand binding at the human neutrophil elastase. J. Med. Chem. 2006;49:1837–1844. doi: 10.1021/jm0505720. [DOI] [PubMed] [Google Scholar]
- 39.Kirkwood J.G. Statistical mechanics of fluid mixtures. J. Chem. Phys. 1935;3:300–313. [Google Scholar]
- 40.Case D.A., Darden T.A., Kollman P.A. University of California; San Francisco, CA: 2008. AMBER 10. [Google Scholar]
- 41.Blondel A. Ensemble variance in free energy calculations by thermodynamic integration: theory, optimal “alchemical” path, and practical solutions. J. Comput. Chem. 2004;25:985–993. doi: 10.1002/jcc.20025. [DOI] [PubMed] [Google Scholar]
- 42.Ryckaert J.P., Ciccotti G., Berendsen H.J.C. Numerical integration of the Cartesian equations of motion of a system with constraints: molecular dynamics of n-alkanes. J. Comput. Phys. 1977;23:327–341. [Google Scholar]
- 43.Wang J., Deng Y., Roux B. Absolute binding free energy calculations using molecular dynamics simulations with restraining potentials. Biophys. J. 2006;91:2798–2814. doi: 10.1529/biophysj.106.084301. [DOI] [PMC free article] [PubMed] [Google Scholar]
- 44.Straatsma T.P., Berendsen H.J.C., Stam A.J. Estimation of statistical errors in molecular simulation calculations. Mol. Phys. 1986;57:89–95. [Google Scholar]
- 45.Grabarek Z. Structure of a trapped intermediate of calmodulin: calcium regulation of EF-hand proteins from a new perspective. J. Mol. Biol. 2005;346:1351–1366. doi: 10.1016/j.jmb.2005.01.004. [DOI] [PubMed] [Google Scholar]
- 46.Elber R., Karplus M. Enhanced sampling in molecular dynamics: use of the time-dependent Hartree approximation for a simulation of carbon monoxide diffusion through myoglobin. J. Am. Chem. Soc. 1990;112:9161–9175. [Google Scholar]
- 47.Ulitsky A., Elber R. The thermal equilibrium aspects of the time dependent Hartree and the locally enhanced sampling approximations: formal properties, a correction, and computational examples for rare gas clusters. J. Chem. Phys. 1993;98:3380–3388. [Google Scholar]
- 48.Deng Y., Roux B. Computations of standard binding free energies with molecular dynamics simulations. J. Phys. Chem. B. 2009;113:2234–2246. doi: 10.1021/jp807701h. [DOI] [PMC free article] [PubMed] [Google Scholar]
- 49.Steinbrecher T., Hrenn A., Labahn A. Bornyl (3,4,5-trihydroxy)-cinnamate—an optimized human neutrophil elastase inhibitor designed by free energy calculations. Bioorg. Med. Chem. 2008;16:2385–2390. doi: 10.1016/j.bmc.2007.11.070. [DOI] [PubMed] [Google Scholar]
- 50.Yu H., Whitfield T.W., Roux B. Simulating monovalent and divalent ions in aqueous solution using a Drude polarizable force field. J. Chem. Theory Comput. 2010;6:774–786. doi: 10.1021/ct900576a. [DOI] [PMC free article] [PubMed] [Google Scholar]
- 51.Warren J.T., Guo Q., Tang W.J. A 1.3-Å structure of zinc-bound N-terminal domain of calmodulin elucidates potential early ion-binding step. J. Mol. Biol. 2007;374:517–527. doi: 10.1016/j.jmb.2007.09.048. [DOI] [PMC free article] [PubMed] [Google Scholar]
- 52.Kobayashi C., Takada S. Protein grabs a ligand by extending anchor residues: molecular simulation for Ca2+ binding to calmodulin loop. Biophys. J. 2006;90:3043–3051. doi: 10.1529/biophysj.105.078071. [DOI] [PMC free article] [PubMed] [Google Scholar]
- 53.Zhang Y., Tan H., Chen G. Ca2+ dissociation from the C-terminal EF-hand pair in calmodulin: a steered molecular dynamics study. FEBS Lett. 2008;582:1355–1361. doi: 10.1016/j.febslet.2008.03.010. [DOI] [PubMed] [Google Scholar]
- 54.Debreczeni J.E., Farkas L., Nyitray L. Structural evidence for non-canonical binding of Ca2+ to a canonical EF-hand of a conventional myosin. J. Biol. Chem. 2005;280:41458–41464. doi: 10.1074/jbc.M506315200. [DOI] [PubMed] [Google Scholar]
- 55.Laine E., Blondel A., Malliavin T.E. Dynamics and energetics: a consensus analysis of the impact of calcium on EF-CaM protein complex. Biophys. J. 2009;96:1249–1263. doi: 10.1016/j.bpj.2008.10.055. [DOI] [PMC free article] [PubMed] [Google Scholar]
- 56.Yang C., Jas G.S., Kuczera K. Structure, dynamics and interaction with kinase targets: computer simulations of calmodulin. Biochim. Biophys. Acta. 2004;1697:289–300. doi: 10.1016/j.bbapap.2003.11.032. [DOI] [PubMed] [Google Scholar]
Associated Data
This section collects any data citations, data availability statements, or supplementary materials included in this article.