

Abstract
Superresolution optical microscopy (nanoscopy) is of current interest in many biological fields. Superresolution optical fluctuation imaging, which utilizes higher-order cumulant of fluorescence temporal fluctuations, is an excellent method for nanoscopy, as it requires neither complicated optics nor illuminations. However, it does need an impractical number of images for real-time observation. Here, we achieved real-time nanoscopy by modifying superresolution optical fluctuation imaging and enhancing the fluctuation of quantum dots. Our developed quantum dots have higher blinking than commercially available ones. The fluctuation of the blinking improved the resolution when using a variance calculation for each pixel instead of a cumulant calculation. This enabled us to obtain microscopic images with 90-nm and 80-ms spatial-temporal resolution by using a conventional fluorescence microscope without any optics or devices.
Currently, optical microscopic techniques of nanoscale biological structures such as proteins are significantly constrained by optical diffraction limits (1). To achieve better resolution, techniques like electron microscopy, which includes transmission electron microscopy, cryo-electron microscopy, and scanning probe microscopy (which includes scanning tunneling microscopy and atomic force microscopy) have been developed. However, these techniques can only be applied to fixed cells. Other methods such as stimulated emission depletion, structured illumination microscopy, stochastic optical reconstruction microscopy, and fluorescence photoactivation localization are promising technologies because they offer subdiffraction limit optical resolution (2–5). However, these techniques require complicated and expensive instruments such as pulse lasers, phase plates, and optical scanning devices. These demands have prevented these technologies from being applied to biological studies where the primary investigator rarely has an expertise in optics. One excellent method, super-resolution optical fluctuation imaging (SOFI), may overcome these problems (6). SOFI processing uses digital image data composed of pixels. The spatial resolution is improved by calculating the high-order cumulant of each pixel during fluorescence fluctuations (6). Quantum dots (Qdot), which are semiconductor fluorescent probes with intense fluorescence, are known to show high blinking (Fig. 1 D) (7,8), and therefore are suitable for SOFI. Still, this combination is not considered practical for real-time observation, because an infeasible number of images are needed inasmuch as the high-order cumulant becomes nearly zero when long periods of the off- (i.e., nonfluorescent) state occur. Thus, real-time nanoscopy using SOFI requires creative tinkering.
Figure 1.
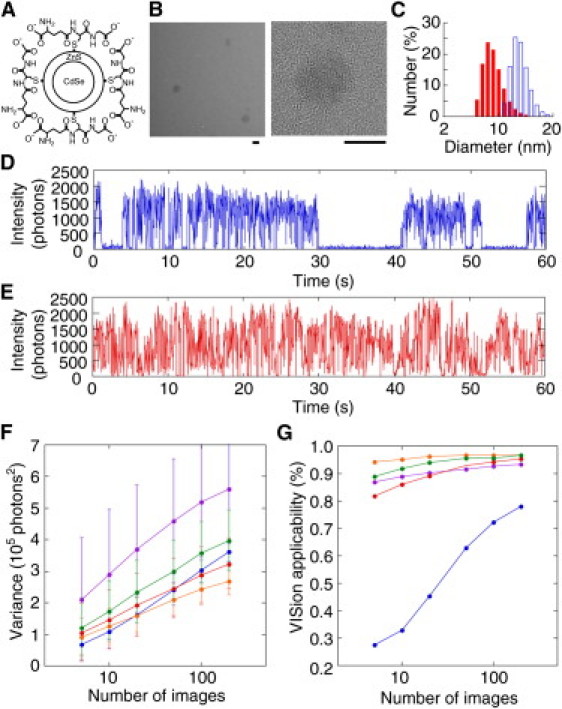
Blinking enhanced quantum dot (BEQ). (A) Schematic drawing of a BEQ. (B) Transmission electron microscope images of BEQ615. (Right panel is a magnification of the left panel.) Scale bars, 5 nm. (C) Histogram of Qdot diameter using dynamic light scattering. The mean diameter of commercial Qdot was 15.4 ± 2.5 nm (blue), and that of BEQ615 was 8.7 ± 1.6 nm (red). (D and E) Time courses of the fluorescence intensities of commercial Qdot (D) and BEQ611 (E). (F) Relationship between the variance (second-order cumulant) and the number of images used for the calculation. (G) Relationship between VISion applicability (see text for definition) and the number of images used for the calculation. (F and G) (Blue) Commercial Qdot; (purple) BEQ600; (red) BEQ606; (orange) BEQ611; and (green) BEQ615. Thirty time courses for each Qdot were obtained, each containing 1000 frames. Temporal resolution, 20 ms. The average number of photons emitted from fluorophores in the on-state was set to be 1200 by regulating the illuminating power of the laser.
Because decreasing the number of images improves the temporal resolution of SOFI, we developed a highly fluctuating Qdot where switching between the on- and off-state is minimized. A typical Qdot is composed of a CdSe core, ZnS shell to prevent the core from interacting with oxygen and water, and hydrophilic coating (7). We synthesized Qdot with a thinner ZnS shell to achieve highly blinking Qdot, as the thinner shell should promote more interaction between the luminophore and oxygen atoms in water (9). Four kinds of Qdot were synthesized: one with no-ZnS shell and three with variable shell thickness (Fig. 1, A and B, and the Supporting Material). The peaks of the fluorescence spectrum for the four were 600, 606, 611, and 615 nm, respectively. These Qdots were coated with glutathione to form a hydrophilic layer. Glutathione-coated Qdot is not only soluble in water, but also has two types of reaction groups (amino and carboxylic groups) to promote protein conjugation (10). The diameter of the largest Qdot among our four was 8.7 ± 1.6 nm (Fig. 1 C, red bar and Fig. S1 in the Supporting Material), which is still approximately half the diameter of commercially available Qdot. The biological probe has to be as small as possible to avoid steric effects on protein conjugation. Using a fluorescence microscope, we measured the fluorescence intensity of a Qdot fixed to a glass surface (Fig. 1, D and E). The fabricated Qdots showed higher blinking than commercial Qdot in solution. We named our Qdot the Blinking Enhanced Qdot (BEQ) 600, 606, 611, and 615, corresponding to the respective peak spectrum. Furthermore, we developed an easier method for SOFI. We used the variance instead of the high-order cumulant (see Fig. S2 in the Supporting Material) and named our novel analysis Variance Imaging for Superresolution (VISion).
The signal value in VISion is the variance of the fluorescence fluctuation, which is equal to the second-order cumulant of the central moment. We evaluated the blinking efficiency of our four BEQs for VISion. Fig. 1 F shows the relationship between the variance and the number of images used for the calculation. The variance increased with the number of images, but decreased when increasing the ZnS shell thickness. The applicability of newly synthesized Qdot for VISion was defined as the probability that the variance of the Qdot exceeds threefold that of the background noise (signal/noise ratio = 3) (Fig. 1 G). Using commercial Qdot, the applicability was only 27% when 10 images were used, and 80% for 200. On the other hand, the applicabilities reached 80% using only 10 images when BEQs were used. In particular, BEQ611 showed the best performance (95% by 10 images). Therefore, our BEQs have far more suitable blinking characteristics for real-time VISion. One exception is BEQ600. Despite showing the most intense blinking (Fig. 1 F), BEQ600 was structurally unstable in water and cannot be stored for a long time due to the absence of the ZnS shell. The other BEQs could be kept for over a month at room temperature due to the thin ZnS shell protecting the CdSe core.
Tests of real-time VISion under different conditions using BEQ611 are shown in Fig. 2. Fig. 2 A shows the raw image and four different cycles of variance images of a single BEQ611 particle for 100 (upper) and 20 (lower) images. For both cases, as the cycles of variance increases, the point spread function shrinks, indicating a resolution that overcomes the diffraction limit. This can be seen in Fig. 2 B, where the resolution is defined as the full width at half-maximum (FWHM) by fitting the profile with a Gaussian distribution. The FWHM graph shows that experimental improvements were slightly less than what can be theoretically achieved (Fig. 2 C). Overall, a 2.5-fold improvement was achieved using four cycles of variance for 20 images.
Figure 2.
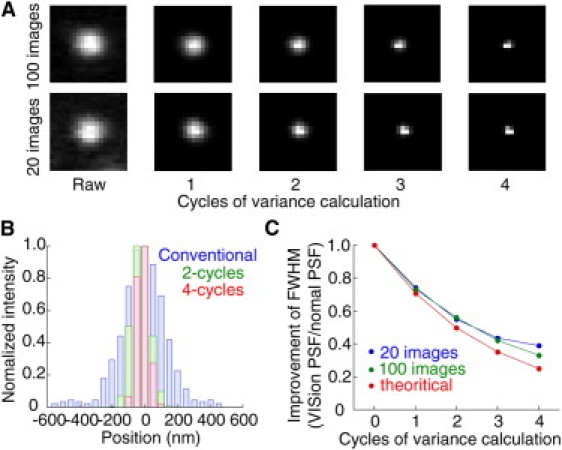
VISion analysis using BEQ611. (A) N-cycles of variance images for a single BEQ611 particle. (Upper) One-hundred images; (lower) 20 images. Pixel size, 50.4 nm. (B) Point spread functions had FWHM of 224, 166, and 88 nm for a conventional fluorescent image (blue), two-cycles-of-variance (green), and four-cycles-of-variance (red), respectively. (C) Relationship between FWHM improvements and cycles of variance in the case of 20 (blue) and 100 (green) images. (Red) Theoretical value using VISion analysis (1/(√2)n).
To demonstrate the biological potential of VISion and BEQ, we observed an endosome in a living cell. The glutathione coating of the BEQ potentiated the fluorescent labeling of the cell membrane (Fig. S3). BEQ611 first adhered to the membrane of a HeLa cell, but was then endocytosed within 3 h (Fig. 3 A). Fig. 3 A left panel is a conventional fluorescence image of endosomes labeled with BEQ611 inside the cell. Observed endosomes ranged between ∼100 and 500 nm in diameter. VISion and SOFI improved the resolution by (√2)n-fold compared to conventional imaging along both the horizontal and optical axes (see the Supporting Material) (6). After the two cycles of variance calculation, an endosome of ∼500 nm showed a donut shape with 172-nm resolution (Fig. 3 A, cyan circle). This endosome moved with a velocity of ∼50 nm/s, and could be observed every 400 ms (Fig. 3 B). The improvement of the resolution in VISion is limited by the size of the pixel, which depends on the magnification of the microscope. When the magnification and the camera frame rate were improved to 50.1 nm/pixel and 8 ms, respectively, VISion achieved 12.5-Hz temporal resolution at 90-nm spatial resolution (Fig. 3 C, middle). In comparison, while the third cumulant image in SOFI did improve the spatial resolution 154 nm, 100 images were needed (Fig. 3 C, right). Moreover, increasing the frame rate of the charge-coupled device camera can improve the temporal resolution.
Figure 3.
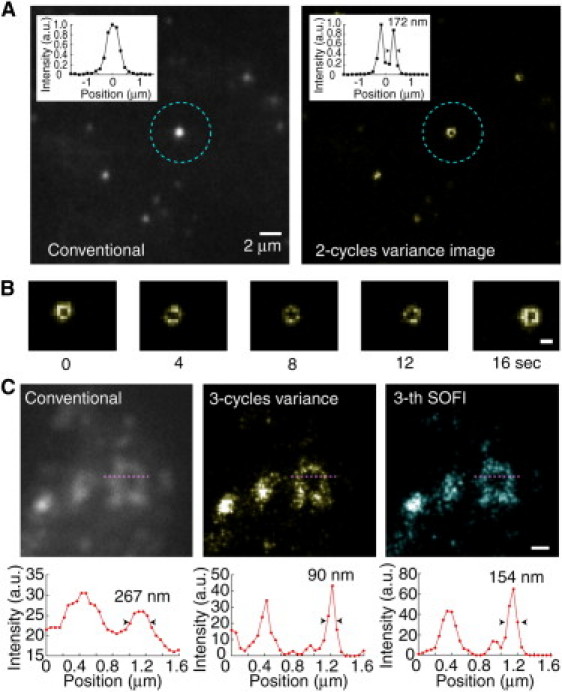
Real-time nano-imaging of endosomes in a living cell. (A) Conventional fluorescent image (left) and two-cycles-of-variance image (right) of a BEQ611-labeled vesicle inside a cell. Insertions in the top left of each image are cross-sections of the vesicle indicated by the cyan circles. Pixel size, 151 nm. (B) Captured images of the vesicle indicated by the dotted cyan circle in the right panel of A. White bar, 500 nm. (C) High magnification of VISion imaging. (Upper panels) Vesicles labeled with BEQ611 under conventional fluorescence (left), three-cycles-of-variance (middle), and SOFI (third cumulant image using 100 images, right) imaging. Pixel size, 50.4 nm. White bar, 500 nm. (Lower panels) Intensity profiles of the one-dimension cross-sections (magenta lines) from the upper panels.
Other studies have shown that stimulated emission depletion can achieve 35 Hz at 62-nm resolution (2), while structured illumination microscopy can achieve 11 Hz at 100-nm resolution (3). However, VISion separates itself from these by the fact it does not need any complicated optics for real-time nanoscopy. By combining VISion and BEQ, we can achieve 12.5 Hz at 90-nm resolution using conventional optical equipments. Overall, VISion processing using BEQs is appealing because it offers a relatively simple method to achieve real-time superresolution using a conventional microscopic setup.
Acknowledgments
We gratefully acknowledge Peter Karagiannis (Immunology Frontier Research Center, Osaka University) for critically reading this manuscript, Keiko Yoshizawa (Immunology Frontier Research Center, Osaka University) for the cell preparation, and Eiji Taguchi (Ultrahigh Vacuum Electron Microscopy Center (UHVEM), Osaka University) for observations with the high-resolution transmission electron microscope.
Supporting Material
References and Footnotes
- 1.Abbe E. Contributions to the theory of the microscope and the microscopic perception (translated from German) Arch. Mikr. Anat. 1873;9:413–468. [Google Scholar]
- 2.Westphal V., Rizzoli S.O., Hell S.W. Video-rate far-field optical nanoscopy dissects synaptic vesicle movement. Science. 2008;320:246–249. doi: 10.1126/science.1154228. [DOI] [PubMed] [Google Scholar]
- 3.Kner P., Chhun B.B., Gustafsson M.G. Super-resolution video microscopy of live cells by structured illumination. Nat. Methods. 2009;6:339–342. doi: 10.1038/nmeth.1324. [DOI] [PMC free article] [PubMed] [Google Scholar]
- 4.Rust M.J., Bates M., Zhuang X. Sub-diffraction-limit imaging by stochastic optical reconstruction microscopy (STORM) Nat. Methods. 2006;3:793–795. doi: 10.1038/nmeth929. [DOI] [PMC free article] [PubMed] [Google Scholar]
- 5.Juette M.F., Gould T.J., Bewersdorf J. Three-dimensional sub-100 nm resolution fluorescence microscopy of thick samples. Nat. Methods. 2008;5:527–529. doi: 10.1038/nmeth.1211. [DOI] [PubMed] [Google Scholar]
- 6.Dertinger T., Colyer R., Enderlein J. Fast, background-free, 3D super-resolution optical fluctuation imaging (SOFI) Proc. Natl. Acad. Sci. USA. 2009;106:22287–22292. doi: 10.1073/pnas.0907866106. [DOI] [PMC free article] [PubMed] [Google Scholar]
- 7.Bruchez M., Jr., Moronne M., Alivisatos A.P. Semiconductor nanocrystals as fluorescent biological labels. Science. 1998;281:2013–2016. doi: 10.1126/science.281.5385.2013. [DOI] [PubMed] [Google Scholar]
- 8.Nirmal M., Dabbousi B.O., Brus L.E. Fluorescence intermittency in single cadmium selenide nanocrystals. Nature. 1996;383:802–804. [Google Scholar]
- 9.Dabbousi B.O., Rodriguez-Viejo J., Bawendi M.G. (CdSe)ZnS core-shell Qdots: synthesis and characterization of a size series of highly luminescent nanocrystallites. J. Phys. Chem. B. 1997;101:9463–9475. [Google Scholar]
- 10.Tiwari D.K., Tanaka S., Jin T. Synthesis and characterization of Anti-HER2 antibody conjugated CdSe/CdZnS quantum dots for fluorescence imaging of breast cancer cells. Sensors. 2009;9:9332–9354. doi: 10.3390/s91109332. [DOI] [PMC free article] [PubMed] [Google Scholar]
Associated Data
This section collects any data citations, data availability statements, or supplementary materials included in this article.