

This work demonstrated that T1-independent chemical shift–based water-fat separation MR imaging with T2* correction, spectral modeling of fat, and eddy current correction is statistically equivalent to T2-corrected single-voxel stimulated-echo acquisition mode spectroscopy in the quantification of hepatic triglyceride content.
Abstract
Purpose:
To prospectively compare an investigational version of a complex-based chemical shift–based fat fraction magnetic resonance (MR) imaging method with MR spectroscopy for the quantification of hepatic steatosis.
Materials and Methods:
This study was approved by the institutional review board and was HIPAA compliant. Written informed consent was obtained before all studies. Fifty-five patients (31 women, 24 men; age range, 24–71 years) were prospectively imaged at 1.5 T with quantitative MR imaging and single-voxel MR spectroscopy, each within a single breath hold. The effects of T2* correction, spectral modeling of fat, and magnitude fitting for eddy current correction on fat quantification with MR imaging were investigated by reconstructing fat fraction images from the same source data with different combinations of error correction. Single-voxel T2-corrected MR spectroscopy was used to measure fat fraction and served as the reference standard. All MR spectroscopy data were postprocessed at a separate institution by an MR physicist who was blinded to MR imaging results. Fat fractions measured with MR imaging and MR spectroscopy were compared statistically to determine the correlation (r2), and the slope and intercept as measures of agreement between MR imaging and MR spectroscopy fat fraction measurements, to determine whether MR imaging can help quantify fat, and examine the importance of T2* correction, spectral modeling of fat, and eddy current correction. Two-sided t tests (significance level, P = .05) were used to determine whether estimated slopes and intercepts were significantly different from 1.0 and 0.0, respectively. Sensitivity and specificity for the classification of clinically significant steatosis were evaluated.
Results:
Overall, there was excellent correlation between MR imaging and MR spectroscopy for all reconstruction combinations. However, agreement was only achieved when T2* correction, spectral modeling of fat, and magnitude fitting for eddy current correction were used (r2 = 0.99; slope ± standard deviation = 1.00 ± 0.01, P = .77; intercept ± standard deviation = 0.2% ± 0.1, P = .19).
Conclusion:
T1-independent chemical shift–based water-fat separation MR imaging methods can accurately quantify fat over the entire liver, by using MR spectroscopy as the reference standard, when T2* correction, spectral modeling of fat, and eddy current correction methods are used.
© RSNA, 2011
Introduction
Nonalcoholic fatty liver disease (NAFLD) is closely associated with the metabolic syndrome, a constellation of conditions including type 2 diabetes, obesity, dyslipidemia, and hypertension, among others (1). NAFLD affects an estimated 30% of the U.S. population, including 75% of obese adults (2) and up to 10% of children (3–5). NAFLD encompasses a spectrum of liver diseases that include isolated steatosis, nonalcoholic steatohepatitis, and cirrhosis. It has been demonstrated that NAFLD is an independent risk factor for cardiovascular disease in patients with type 2 diabetes (6–8) and is associated with higher rates of malignancy (9–11). In addition, new data suggest that NAFLD may play a causative role in type 2 diabetes (12).
The hallmark feature of NAFLD is steatosis. Currently, the reference standard for the diagnosis and grading of steatosis is biopsy. However, widespread use of biopsy is limited because it is expensive, invasive, and has high sampling error (13–15). Steatosis is heterogeneous, and the sampling error likely reflects the inherent flaw of attempting to characterize a heterogeneous disease with a sample of only 1/50 000 of the liver.
Magnetic resonance (MR) spectroscopy is regarded by many as the noninvasive reference standard in the quantification of hepatic triglyceride content (16–19). However, MR spectroscopy requires a substantial amount of postprocessing—including complex combination of signals from phased-array coils, T2 correction, and spectral modeling—and may be impractical in some clinical settings.
In recent years, several groups have investigated the use of chemical shift–based water-fat separation MR imaging methods in the quantification of steatosis. Most studies have demonstrated excellent correlation with MR spectroscopy, although not all studies demonstrate good agreement with MR spectroscopy (20–26). Most investigators measure the “fat signal fraction” as a biomarker of liver triglyceride concentration. Fat signal fraction is the ratio of the signal from hydrogen nuclei in fat to the sum of the signal from hydrogen nuclei in free water and fat. For imaging, the fat signal fraction has the advantage of being independent of radiofrequency coil sensitivity profiles. It is important to note that the only signals visible with conventional MR imaging methods are from free water and triglycerides. Therefore, proton density fat fraction is defined as the density of hydrogen protons from fat normalized from the total hydrogen proton density from all mobile proton species.
Unfortunately, several important confounding factors must be addressed for fat signal fraction to be equivalent to proton density fat fraction. For the purposes of brevity, we will use the term “fat fraction” in the remainder of this article. Factors confounding fat fraction measurements include T1 bias (27,28), noise bias (27), T2* decay (28,29), the spectral complexity of fat (28–30), and eddy currents (31).
Eddy currents can affect the relative phase of the acquired echoes when using multiecho acquisitions, leading to inaccuracies in water-fat separation (31)—particularly at low (∼0%) and high (∼100%) fat fractions. A “magnitude fitting” method that discards these phase shifts and avoids these errors was used for all image reconstructions (31). The eddy current correction method is a hybrid approach that discards phase information from the acquired echoes at low fat fractions and estimates the fat fraction by fitting the signal to a magnitude signal model (that naturally discards all phase information). By discarding the phase information and fitting to the magnitude model, phase shifts from eddy currents are removed and their effects mitigated.
Thus, the purpose of our study was to prospectively compare an investigational version of a complex-based chemical shift–based fat fraction MR imaging method with MR spectroscopy for the quantification of hepatic steatosis.
Materials and Methods
Patients
Our institutional review board approved this prospective study, which was compliant with the Health Insurance Portability and Accountability Act; written informed consent was obtained from all patients before the studies. This study was a collaborative effort between the University of Wisconsin, Madison, Wis, the University of California, San Diego, Calif, and GE Healthcare; however, there was no direct financial support from GE Healthcare for this study. In addition, all experiments were performed at the University of Wisconsin. The authors who were not employees of GE Healthcare had control of data and information that might have presented a conflict of interest. This study included 55 patients (31 women, 24 men) with a mean age of 40 years (range, 24–71 years) who were scheduled for clinical abdominal MR imaging. Patients were recruited consecutively, irrespective of the indication for clinical MR imaging or any known diagnoses. Patients younger than 18 years and those who belonged to vulnerable groups (eg, prisoners, illiterate patients) were excluded as our institutional review board protocol did not permit the inclusion of such groups. The mean age of the 31 women was 41 years (range, 24–56 years), and the mean age of the 24 men was 40 years (range, 34–71 years). There was no statistically significant difference between male and female populations (two-sided Student t test). A total of 58 independent imaging studies were performed in the 55 patients, with three patients undergoing repeat study recruitment at follow-up clinical imaging visits. Patients were enrolled between October 2008 and July 2009 and were recruited irrespective of their clinical history All studies were successful, with no technical failures. When available, patient weight, height, and body mass index were recorded from the medical record. In addition, the medical records were examined for any history of known hepatic iron overload.
MR Imaging Technique
Imaging was performed with three clinical 1.5-T units (Signa HDx; GE Healthcare, Waukesha, Wis) by using an eight-channel phased-array torso coil. Before administration of contrast material, imaging of the liver was performed with an investigational version of a chemical shift–based water-fat separation method known as iterative decomposition of water and fat with echo asymmetry and least-squares estimation (IDEAL) (32,33), which was implemented with a multiecho three-dimensional spoiled gradient-echo acquisition.
The pulse sequence acquires six echoes per repetition time with fly-back readouts, and echo spacing was chosen to maximize the signal-to-noise ratio performance of the water-fat separation (29). A two-dimensional parallel imaging acceleration method (ARC, autocalibrating reconstruction for Cartesian acquisition) was used to reduce imaging time to within a short breath hold while still allowing for complete liver coverage (34). Imaging parameters were as follows: repetition time, 13.7 msec; first echo time, 1.3 msec; echo spacing, 2.0 msec; receiver bandwidth, ±125 kHz; field of view, 35 × 35 cm; section thickness, 10 mm; matrix, 256 × 128; 24 sections covering 24 cm in the superior-inferior direction; and true spatial resolution, 1.4 × 2.7 × 10 mm3. Parallel imaging provided a net acceleration of 2.2, for a total imaging time of 21 seconds. A 5° flip angle was used to minimize T1-related bias between water and fat (27,28).
Images were reconstructed by using an online algorithm that uses a region-growing algorithm to avoid water-fat swapping that can occur with water-fat separation methods (35). Water-fat swapping can occur with all chemical shift–based water-fat separation methods owing to the presence of magnetic field inhomogeneities. This leads to incorrect assignment of water signal to the fat-only image and fat signal to the water-only image. Fat fraction images were calculated by using the separated water and fat images (fat signal/[water signal + fat signal]) to remove the effects of B1 coil sensitivity. A magnitude discrimination method was used to avoid noise-related bias at low fat fractions, which can occur when calculating the fat fraction images from magnitude water and fat images (27).
Measurements from Fat Fraction Images Reconstructed with Different Parameters
It is well known that T2* decay corrupts the ability of chemical shift imaging methods to separate water and fat signals (28,29,36). Fortunately, the IDEAL reconstruction algorithm is capable of simultaneous T2* estimation and correction (29), which has been demonstrated in phantom (36) and animal studies (37) to improve the accuracy of fat quantification. To our knowledge, however, no studies have demonstrated the effect of T2* correction for fat quantification in patients with use of the IDEAL technique. Thus, a major purpose of this study was to examine the effect of T2* correction on fat quantification with IDEAL. In addition, the T2* correction method described by Yu et al (29) provides estimates of R2* (1/T2*) as part of this correction. Therefore, a secondary purpose of this study was to measure the range of T2* values experienced in clinical practice.
Most chemical shift–based water-fat separation methods model fat as a single peak in their signal model, which leads to inaccurate separation of water and fat signals because fat has a complex nuclear MR spectrum with at least six discrete peaks (28,30). Recently, Bydder et al (28) and Yu et al (30) independently incorporated spectral modeling of fat (“multipeak” reconstruction) into MR imaging fat quantification methods, demonstrating improved accuracy of fat quantification in phantoms (28,36), animal studies (37), and preliminary clinical studies (20,25). Therefore, a major purpose of this study was to assess the effect of multipeak reconstruction on fat quantification with additional clinical studies and in combination with T2* correction. Specifically, we evaluated the “precalibration” spectral modeling method of Yu et al (30) and its effect on fat quantification. The precalibration approach assumes that the six resonance frequencies of fat and their relative amplitudes are known a priori. In this work, we used the spectral model of liver triglycerides measured by Middleton et al (38).
A total of four reconstructions were performed on the same complex source images, without and with T2* correction and without and with multipeak spectral modeling of fat. All reconstructions were performed with eddy current correction. Because all reconstructions were performed from the same source data, perfect co-localization of the fat fractions measured from all reconstructions was obtained by copying and pasting the identical regions of interest (ROIs) to all of the fat fraction images.
MR Spectroscopy Technique
Single-voxel MR spectroscopy was performed to serve as a reference standard for fat fractions measured with MR imaging. Specifically, we used single-voxel STEAM (stimulated echo acquisition mode) acquisition without water suppression. STEAM was used, rather than point-resolved spectroscopy (PRESS), because of concerns that point-resolved spectroscopy may overestimate fat fraction and provide less-consistent fat fraction estimates owing to J-coupling effects (39).
A 2.0 × 2.0 × 2.5-cm3 voxel was placed in the posterior segment of the right hepatic lobe (segment VI or VII)—avoiding large vessels, bile ducts, or obvious abnormalities (eg, mass)—and shimmed during free breathing. After a single preacquisition excitation, five single-average spectra (repetition time of 3500 msec to avoid T1 weighting) were acquired consecutively at progressively longer echo times of 10, 20, 30, 40, and 50 msec within a 21-second breath-hold acquisition. A minimum mixing time of 5 msec was chosen to minimize J-coupling effects (39), and the receiver bandwidth was ±2.5 kHz with 2048 readout points.
All MR spectroscopy data were postprocessed by an MR physicist (G.H., with 10 years of experience in MR spectroscopy) who was blinded to the MR imaging results and located at a separate institution (University of California, San Diego) from where data were acquired (University of Wisconsin, Madison). The spectra from the individual coil elements were combined by using a singular value decomposition–based approach (40). Images from MR spectroscopy were postprocessed by using an advanced method for quantification of MR spectroscopy data with use of prior knowledge—the accurate, robust, and efficient spectral fitting algorithm (41) in the jMRUI software package (42). T2 decay correction was performed for both the water and fat peaks, providing a T2-corrected MR spectroscopy fat fraction.
Measurements of Fat Fraction and R2* from Reconstructed Images
Fat fraction was measured from IDEAL fat fraction images by using a 2.0 × 2.0-cm2 ROI (167 pixels) co-localized with the MR spectroscopy voxel and identical in size (in-plane) to the MR spectroscopy voxel. Co-localization was performed by using the coordinates of the MR spectroscopy voxel recorded in the header of the MR spectroscopy data from a single imaging section that was closest to the center of the MR spectroscopy voxel. The ROI was centered at the same anterior-posterior and/or left-right in-plane coordinates as the MR spectroscopy voxel. ROI measurements were made by an operator (S.M.) with 8 years of clinical and/or research experience in MR imaging and spectroscopy. The ROI was then copied to all fat fraction images to ensure perfect co-localization among the four different fat fraction reconstructions. The operator who measured the MR imaging fat fraction was blinded to MR spectroscopy measurements.
Finally, the same ROI was copied to the R2* map that was generated from the reconstruction that used T2* correction, multipeak spectral modeling, and magnitude fitting.
Statistical Analysis
All statistical analyses were performed by using Excel (v10.6841.6839 SP3; Microsoft, Redmond, Wash). Fat fraction values obtained with the four MR imaging reconstruction methods were plotted against those obtained with MR spectroscopy, and linear regression was performed to determine the correlation (r2), slope, and intercept as measures of agreement between fat fractions obtained with MR imaging and MR spectroscopy. Two-sided t tests at a significance level of P = .05 were used to determine whether the estimated slope and intercept were statistically different from 1.0 and 0.0, respectively.
The sensitivity, specificity, and accuracy of the fat fraction determined with MR imaging for the classification of patients with or without clinically significant steatosis were evaluated. With use of a predefined MR spectroscopy threshold fat fraction as the reference standard, accuracy was defined as the ratio of the sum of patients correctly identified with MR imaging as having clinically normal and abnormal fat fractions (true-positive findings + true-negative findings) to all patients in the study. For this study, a threshold fat fraction value of 5.56% was used to differentiate normal from abnormal fat fractions. This threshold was determined on the basis of a large MR spectroscopy study performed by Szczepaniak et al (43) in 2349 participants of the Dallas Heart Study. The 95th percentile cutoff of 5.56% fat fraction was determined from a subset of 345 patients with no identifiable risk factors for steatosis.
Finally, R2* values and fat fraction measurements made from the reconstruction that included T2* correction, multipeak modeling, and magnitude fitting were compared by using linear regression to detect any correlation between R2* and fat fraction. The average R2* value over all patients was also calculated.
Results
Figure 1 shows an example from a 67-year-old overweight woman (weight, 65.3 kg; body mass index, 27.2 kg/m2) with no known liver disease who presented for follow-up imaging after undergoing cryoablation for a small renal tumor. The fat fraction MR image was reconstructed without and with spectral modeling of fat and without and with correction for T2* decay, and the MR spectra were processed to correct for T2 decay. Good subjective agreement was achieved, with a fat fraction of 17.7% with MR imaging and 19.1% with MR spectroscopy when spectral modeling and T2* correction was performed.
Figure 1:

Representative example of a fat fraction MR image and its corresponding spectrum obtained with multiecho STEAM MR spectroscopy in a 67-year-old woman with no known liver disease. This patient was slightly overweight (weight, 65.3 kg; body mass index, 27.2 kg/m2). Values for MR imaging fat fraction reconstructed without and with spectral modeling (MP) and without and with T2* correction are shown. Good subjective agreement between MR imaging fat fraction (17.7%) and T2-corrected MR spectroscopy fat fraction (19.1%) was achieved when spectral modeling and T2* correction were performed. TE = echo time.
In all cases, linear regression demonstrated excellent correlation between the fat fractions measured at MR imaging and those measured at MR spectroscopy. Figure 2 shows plots of fat fractions determined with MR imaging and MR spectroscopy for the four combinations of reconstruction (without and with T2* correction and without and with multipeak modeling of fat) for all studies. All reconstructions in Figure 2 were performed with magnitude fitting for eddy current correction. The best agreement between MR imaging and MR spectroscopy fat fraction occurred when both T2* correction and multipeak modeling were used. In this case (Fig 2d), excellent correlation (r2 = 0.99) was achieved, with a slope (±standard deviation) of 1.00 ± 0.01 (P = .77) and an intercept of 0.2% ± 0.1 (P = .19), indicating near equivalence of MR imaging and MR spectroscopy in the measurement of fat fraction.
Figure 2a:

Scatterplots show fat fractions obtained with MR imaging plotted against those obtained with MR spectroscopy. The effects of T2* correction and multipeak modeling of fat were investigated by performing four fat-fraction image reconstructions, as follows: (a) without T2* correction and with single peak modeling of fat; (b) without T2* correction and with multipeak modeling of fat; (c) with T2* correction and with single peak modeling of fat; and (d) with T2* correction and with multipeak modeling of fat. MR imaging fat fraction was reconstructed from the same source data and measured from the same ROIs that were co-localized with the MR spectroscopy voxel. Although all combinations demonstrate excellent correlation, agreement between MR imaging and MR spectroscopy was statistically significant only when both T2* correction and multipeak modeling were used. Magnitude fitting was used to avoid the effects of eddy currents for all four reconstructions. These results demonstrate the necessity of both T2* correction and multipeak modeling of fat.
Figure 2d:

Scatterplots show fat fractions obtained with MR imaging plotted against those obtained with MR spectroscopy. The effects of T2* correction and multipeak modeling of fat were investigated by performing four fat-fraction image reconstructions, as follows: (a) without T2* correction and with single peak modeling of fat; (b) without T2* correction and with multipeak modeling of fat; (c) with T2* correction and with single peak modeling of fat; and (d) with T2* correction and with multipeak modeling of fat. MR imaging fat fraction was reconstructed from the same source data and measured from the same ROIs that were co-localized with the MR spectroscopy voxel. Although all combinations demonstrate excellent correlation, agreement between MR imaging and MR spectroscopy was statistically significant only when both T2* correction and multipeak modeling were used. Magnitude fitting was used to avoid the effects of eddy currents for all four reconstructions. These results demonstrate the necessity of both T2* correction and multipeak modeling of fat.
Figure 2b:

Scatterplots show fat fractions obtained with MR imaging plotted against those obtained with MR spectroscopy. The effects of T2* correction and multipeak modeling of fat were investigated by performing four fat-fraction image reconstructions, as follows: (a) without T2* correction and with single peak modeling of fat; (b) without T2* correction and with multipeak modeling of fat; (c) with T2* correction and with single peak modeling of fat; and (d) with T2* correction and with multipeak modeling of fat. MR imaging fat fraction was reconstructed from the same source data and measured from the same ROIs that were co-localized with the MR spectroscopy voxel. Although all combinations demonstrate excellent correlation, agreement between MR imaging and MR spectroscopy was statistically significant only when both T2* correction and multipeak modeling were used. Magnitude fitting was used to avoid the effects of eddy currents for all four reconstructions. These results demonstrate the necessity of both T2* correction and multipeak modeling of fat.
Figure 2c:

Scatterplots show fat fractions obtained with MR imaging plotted against those obtained with MR spectroscopy. The effects of T2* correction and multipeak modeling of fat were investigated by performing four fat-fraction image reconstructions, as follows: (a) without T2* correction and with single peak modeling of fat; (b) without T2* correction and with multipeak modeling of fat; (c) with T2* correction and with single peak modeling of fat; and (d) with T2* correction and with multipeak modeling of fat. MR imaging fat fraction was reconstructed from the same source data and measured from the same ROIs that were co-localized with the MR spectroscopy voxel. Although all combinations demonstrate excellent correlation, agreement between MR imaging and MR spectroscopy was statistically significant only when both T2* correction and multipeak modeling were used. Magnitude fitting was used to avoid the effects of eddy currents for all four reconstructions. These results demonstrate the necessity of both T2* correction and multipeak modeling of fat.
Figure 3 shows example fat fraction images from six representative cases from this study, demonstrating consistently good image quality in a wide range of patient sizes and body habitus. In addition, many patients exhibit areas of heterogeneous fat distribution, usually in the form of focal sparing.
Figure 3:

Representative examples of fat fraction images obtained with MR imaging in six patients. Fat fractions obtained with MR imaging (MRI) and MR spectroscopy (MRS) are also shown. There was good subjective agreement between MR imaging and MR spectroscopy (performed in the ROI drawn in the posterior segment). A wide range of fat fractions was experienced in this patient population. In addition, many patients had heterogeneous fat (eg, areas of focal sparing [arrows]).
With use of 5.56% as a threshold, an accuracy of 100% was achieved when T2* correction, multipeak modeling, and magnitude fitting were used (Table).
Sensitivity, Specificity, and Accuracy of Fat Fraction Determined with MR Imaging in the Detection of Steatosis
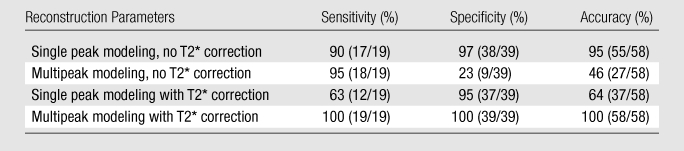
Note.—Numbers in parentheses are numbers of studies. Sensitivity, specificity, and accuracy of MR imaging fat fraction for the detection of steatosis was calculated by using a reference threshold fat fraction of 5.56%, based on MR spectroscopy results from the Dallas Heart Study (43). Excellent accuracy was achieved when both T2* correction and multipeak modeling of fat were used. Note that the accuracy in the detection of steatosis is very poor when T2* correction is not used, reflecting the importance of using T2* correction at low fat fractions (Fig 1b).
Finally, the T2* correction method used in this study provided an opportunity to measure R2* in our patient population and to determine whether there is an interdependence of apparent R2* and fat fraction. The mean of the estimated R2* from all 58 studies was 38.3 seconds−1 (range, 12.6–140.0 sec−1), which corresponds to a mean T2* of 26 msec ± 12 (range, 7–79 msec). Figure 4 plots the R2* and MR imaging fat fraction measured from the identical ROI from the reconstruction that used T2* correction, multipeak modeling of fat, and magnitude fitting. Linear regression demonstrated no correlation (r2 = 0.0005), with a slope and intercept of −0.07 ± 0.4 and 38.8 sec−1 ± 3.9, respectively.
Figure 4:

Scatterplot shows R2* plotted against fat fraction determined with MR imaging from the identical ROI in the posterior segment of the right lobe. Fat fraction and R2* were calculated by using the reconstruction that uses T2* correction, multipeak modeling of fat, and eddy current correction with magnitude fitting. No correlation was demonstrated with linear regression, indicating that R2* is not dependent on fat fraction. The mean R2* value was 38.3 seconds−1 (range, 12.6–140.0 seconds−1), which corresponds to a mean T2* of 26 msec ± 12 (range, 7–79 msec).
Patient weight was available in 41 patients, and both weight and height were available in 29. Of those patients with recorded data, the mean weight was 85.4 kg ± 19.3 (range, 59–143.3 kg), and the mean body mass index was 28.7 kg/m2 ± 4.8 (range, 19.9–37.5 kg/m2). Technical success in both imaging and MR spectroscopy was achieved in patients of all weights.
Discussion
This work demonstrated that T1-independent chemical shift–based water-fat separation MR imaging with T2* correction, spectral modeling of fat, and eddy current correction is statistically equivalent to T2-corrected single-voxel STEAM spectroscopy for the quantification of hepatic triglyceride content. In addition, with use of previously defined thresholds of 5.56% fat fraction to differentiate normal from abnormal fat fraction, MR imaging achieved an accuracy of 100% in the detection and identification of steatosis as long as all known confounding factors were addressed.
Yokoo et al (20) recently published a similar study reporting their experience with a two-dimensional magnitude-based fat quantification method based on the study by Bydder et al (28), demonstrating excellent agreement with MR spectroscopy with very high correlation coefficients. Our study also demonstrated the necessity of T2* correction and accurate spectral modeling. Unlike the magnitude-based method of Bydder et al (28), which can quantify fat only in a range of 0%–50%, our approach uses a three-dimensional acquisition and has the advantage of a complete dynamic range of 0%–100% fat fraction. Although hepatic fat fractions greater than 50% are uncommon, they do occur, and extension of these methods to other fat quantification applications such as quantification of abdominal adiposity or bone marrow fat will require a full dynamic range of 0%–100%.
Marked improvement in the statistical agreement between fat fraction measured with MR imaging and that measured with MR spectroscopy was achieved when T2* correction was used in conjunction with spectral modeling of fat, especially at lower fat fractions. The addition of T2* correction to spectral modeling not only improved correlation and agreement but also resulted in substantially improved accuracy for the detection and identification of steatosis, from 47% (95% sensitivity, 23% specificity) to 100%.
It is important to note that none of our patients had a history of iron overload and only a few patients had elevated R2* values, including one patient with an R2* of 140 seconds−1 (T2* = 7.1 msec). The mean of the estimated R2* values from all 58 studies was 38.3 seconds−1 (range, 12.6–140.0 sec−1), which corresponds to a mean T2* of 26 msec ± 12 (range, 7–79 msec). By comparison, Schwenzer et al (44) found that the T2* in 129 healthy subjects was 28 msec ± 7 (range, 14–46 msec). It is well known that iron overload shortens T2* in tissue (45) and is potentially problematic for fat quantification in patients with concomitant steatosis and iron overload, which has been reported to occur in patients with fatty liver disease (46,47). In our patients, the measured R2* values are similar to, or only slightly lower on average than, those reported in the literature (44) except for a few outliers (eg, R2* = 140 sec−1). Despite the fact that most patients had relatively normal T2* values, T2* correction was necessary to obtain the best agreement with MR spectroscopy. Therefore, we conclude that T2* correction is important for fat quantification even for normal T2* values. We also conclude that there was no dependence of estimated T2* on fat fraction in our patient population.
Our study has several limitations, including the lack of comparison to direct measurements of tissue triglyceride concentration. Comparison with a single targeted biopsy is unlikely to provide adequate validation because it is well known that biopsy suffers from marked sampling variability (13–15). In addition, core biopsies are used for histologic analysis, and pathologic grading of steatosis is based on the number of cells with intracellular fat rather than actual triglyceride correlation. Definitive validation would require comparison of MR images to large tissue samples obtained surgically or after death. Animal studies in obese mice with NAFLD have demonstrated excellent correlation with MR imaging fat fraction measurements and tissue lipid concentrations (37). Other limitations include the use of a patient population with a variety of diseases rather than a targeted group known to have NAFLD. The main purpose of this study, however, was comparison of MR imaging and MR spectroscopy in the quantification of hepatic triglyceride concentration, which does not require stratification according to disease. Finally, we did not fully evaluate the effect of eddy current correction with magnitude fitting. The technical details of magnitude fitting are beyond the scope of this work, and a full comparison will be made elsewhere. Regardless, this work validates the combined use of correction methods for all known confounding factors of fat quantification, achieving excellent agreement between MR imaging and MR spectroscopy.
In conclusion, we have demonstrated the ability of MR imaging to quantify hepatic proton density fat fraction accurately, using a chemical shift–based water-fat separation method. Excellent agreement between MR imaging and MR spectroscopy was achieved in a blinded prospective study, with statistical equivalence between MR imaging and MR spectroscopy. This work explicitly validates the combined use of T2* correction, spectral modeling of fat, and eddy current correction for fat quantification. Finally, the estimated values of R2*, obtained as a byproduct of T2* correction, agree with the range of R2* values in the liver reported in the literature (44), suggesting that this method has the potential to serve as a simultaneous biomarker of liver fat and hepatic iron overload. Future studies will compare biopsy and imaging and examine the role that imaging can play in the detection of liver disease and treatment planning. In addition, validation of these results at other centers is also needed to establish reproducibility of results from this study.
Advances in Knowledge.
Accurate, noninvasive quantification of hepatic steatosis with complete liver coverage is possible within a short breath hold with use of volumetric fat fraction imaging.
This work demonstrates that T1-independent, T2*-corrected chemical shift–based water-fat separation methods can be used to measure hepatic fat fraction in patients, demonstrating excellent correlation (r2 = 0.99) and agreement (slope = 1.00 ± 0.01, P = .77; intercept = 0.2% ± 0.1, P = .19) with MR spectroscopy, which was used as a reference standard.
Implications for Patient Care.
Volumetric fat fraction imaging covering the entire liver can be performed with short imaging times (single breath hold) and with minimal effect on total examination time.
Further studies demonstrating correlation of imaging with nontargeted biopsy are still needed to understand the meaning of fat fraction relative to the histologic grade of steatosis.
Disclosures of Potential Conflicts of Interest: S.M. Financial activities related to the present article: none to disclose. Financial activities not related to the present article: none to disclose. Other relationships: none to disclose. C.D.G.H. Financial activities related to the present article: none to disclose. Financial activities not related to the present article: none to disclose. Other relationships: none to disclose. G.H. Financial activities related to the present article: institution received a grant from GE. Financial activities not related to the present article: institution received money from patents (planned, pending, or issued) from UCSD Tech Transfer. Other relationships: none to disclose. C.B.S. Financial activities related to the present article: institution received a grant from GE. Financial activities not related to the present article: institution received money for a board membership to Bayer, institution received money for consultancy for Bayer, ISI, and Merck; institution received grants or grants are pending from Bayer and Bracco; institution received money for payment for lectures including service on speakers bureaus from Bayer; institution received payment for the development of educational presentations from Medscape, ICPME, and Bayer; institution received money from the Medical Advisory Boards of GE and Bayer. Other relationships: none to disclose. C.A.M. Financial activities related to the present article: none to disclose. Financial activities not related to the present article: institution received grants or grants are pending from GE Healthcare. Other relationships: none to disclose. H.Y. Financial activities related to the present article: none to disclose. Financial activities not related to the present article: is an employee of GE Healthcare; received loyalty distribution from Stanford University for patents (planned, pending, or issued). Other relationships: none to disclose. J.H.B. Financial activities related to the present article: none to disclose. Financial activities not related to the present article: none to disclose. Other relationships: is an employee of GE Healthcare; receives a salary from and has stock options with GE; is an inventor on patents related to the work and owned by GE. S.B.R. Financial activities related to the present article: none to disclose. Financial activities not related to the present article: is a consultant on the Medical Advisory Board of GE Healthcare; is negotiating terms for patent royalties from GE Healthcare but no payment has been received and it is unknown whether payment will ever occur. Other relationships: none to disclose.
Acknowledgments
The authors acknowledge Karl Vigen, PhD, for his assistance with experimental logistics.
Received April 6, 2010; revision requested June 1; revision received August 30; accepted September 30; final version accepted October 22.
Supported by GE Healthcare and the University of Wisconsin Institute for Clinical & Translational Research.
Funding: This research was supported by the National Institutes of Health (grants R01DK083380-01 and 1UL1RR025011).
Abbreviations:
- IDEAL
- iterative decomposition of water and fat with echo asymmetry and least-squares estimation
- NAFLD
- nonalcoholic fatty liver disease
- ROI
- region of interest
- STEAM
- stimulated echo acquisition mode
References
- 1.Yki-Järvinen H. Fat in the liver and insulin resistance. Ann Med 2005;37(5):347–356 [DOI] [PubMed] [Google Scholar]
- 2.Browning JD, Szczepaniak LS, Dobbins R, et al. Prevalence of hepatic steatosis in an urban population in the United States: impact of ethnicity. Hepatology 2004;40(6):1387–1395 [DOI] [PubMed] [Google Scholar]
- 3.Ogden CL, Carroll MD, Curtin LR, McDowell MA, Tabak CJ, Flegal KM. Prevalence of overweight and obesity in the United States, 1999–2004. JAMA 2006;295(13):1549–1555 [DOI] [PubMed] [Google Scholar]
- 4.Rashid M, Roberts EA. Nonalcoholic steatohepatitis in children. J Pediatr Gastroenterol Nutr 2000;30(1):48–53 [DOI] [PubMed] [Google Scholar]
- 5.Schwimmer JB. Definitive diagnosis and assessment of risk for nonalcoholic fatty liver disease in children and adolescents. Semin Liver Dis 2007;27(3):312–318 [DOI] [PubMed] [Google Scholar]
- 6.Targher G, Bertolini L, Poli F, et al. Nonalcoholic fatty liver disease and risk of future cardiovascular events among type 2 diabetic patients. Diabetes 2005;54(12):3541–3546 [DOI] [PubMed] [Google Scholar]
- 7.Rubinstein E, Lavine JE, Schwimmer JB. Hepatic, cardiovascular, and endocrine outcomes of the histological subphenotypes of nonalcoholic fatty liver disease. Semin Liver Dis 2008;28(4):380–385 [DOI] [PubMed] [Google Scholar]
- 8.Fabbrini E, deHaseth D, Deivanayagam S, Mohammed BS, Vitola BE, Klein S. Alterations in fatty acid kinetics in obese adolescents with increased intrahepatic triglyceride content. Obesity (Silver Spring) 2009;17(1):25–29 [DOI] [PMC free article] [PubMed] [Google Scholar]
- 9.Adams LA, Lymp JF, St Sauver J, et al. The natural history of nonalcoholic fatty liver disease: a population-based cohort study. Gastroenterology 2005;129(1):113–121 [DOI] [PubMed] [Google Scholar]
- 10.Matteoni CA, Younossi ZM, Gramlich T, Boparai N, Liu YC, McCullough AJ. Nonalcoholic fatty liver disease: a spectrum of clinical and pathological severity. Gastroenterology 1999;116(6):1413–1419 [DOI] [PubMed] [Google Scholar]
- 11.Sanyal AJ, Banas C, Sargeant C, et al. Similarities and differences in outcomes of cirrhosis due to nonalcoholic steatohepatitis and hepatitis C. Hepatology 2006;43(4):682–689 [DOI] [PubMed] [Google Scholar]
- 12.Adams LA, Waters OR, Knuiman MW, Elliott RR, Olynyk JK. NAFLD as a risk factor for the development of diabetes and the metabolic syndrome: an eleven-year follow-up study. Am J Gastroenterol 2009;104(4):861–867 [DOI] [PubMed] [Google Scholar]
- 13.Janiec DJ, Jacobson ER, Freeth A, Spaulding L, Blaszyk H. Histologic variation of grade and stage of non-alcoholic fatty liver disease in liver biopsies. Obes Surg 2005;15(4):497–501 [DOI] [PubMed] [Google Scholar]
- 14.Ratziu V, Charlotte F, Heurtier A, et al. Sampling variability of liver biopsy in nonalcoholic fatty liver disease. Gastroenterology 2005;128(7):1898–1906 [DOI] [PubMed] [Google Scholar]
- 15.Bondini S, Kleiner DE, Goodman ZD, Gramlich T, Younossi ZM. Pathologic assessment of non-alcoholic fatty liver disease. Clin Liver Dis 2007;11(1):17–23, vii [DOI] [PubMed] [Google Scholar]
- 16.Thomsen C, Becker U, Winkler K, Christoffersen P, Jensen M, Henriksen O. Quantification of liver fat using magnetic resonance spectroscopy. Magn Reson Imaging 1994;12(3):487–495 [DOI] [PubMed] [Google Scholar]
- 17.Szczepaniak LS, Babcock EE, Schick F, et al. Measurement of intracellular triglyceride stores by H spectroscopy: validation in vivo. Am J Physiol 1999;276(5 pt 1):E977–E989 [DOI] [PubMed] [Google Scholar]
- 18.Johnson NA, Walton DW, Sachinwalla T, et al. Noninvasive assessment of hepatic lipid composition: advancing understanding and management of fatty liver disorders. Hepatology 2008;47(5):1513–1523 [DOI] [PubMed] [Google Scholar]
- 19.Mehta SR, Thomas EL, Bell JD, Johnston DG, Taylor-Robinson SD. Non-invasive means of measuring hepatic fat content. World J Gastroenterol 2008;14(22):3476–3483 [DOI] [PMC free article] [PubMed] [Google Scholar]
- 20.Yokoo T, Bydder M, Hamilton G, et al. Nonalcoholic fatty liver disease: diagnostic and fat-grading accuracy of low-flip-angle multiecho gradient-recalled-echo MR imaging at 1.5 T. Radiology 2009;251(1):67–76 [DOI] [PMC free article] [PubMed] [Google Scholar]
- 21.Kawamitsu H, Kaji Y, Ohara T, Sugimura K. Feasibility of quantitative intrahepatic lipid imaging applied to the magnetic resonance dual gradient echo sequence. Magn Reson Med Sci 2003;2(1):47–50 [DOI] [PubMed] [Google Scholar]
- 22.Machann J, Thamer C, Schnoedt B, et al. Hepatic lipid accumulation in healthy subjects: a comparative study using spectral fat-selective MRI and volume-localized 1H-MR spectroscopy. Magn Reson Med 2006;55(4):913–917 [DOI] [PubMed] [Google Scholar]
- 23.Irwan R, Edens MA, Sijens PE. Assessment of the variations in fat content in normal liver using a fast MR imaging method in comparison with results obtained by spectroscopic imaging. Eur Radiol 2008;18(4):806–813 [DOI] [PubMed] [Google Scholar]
- 24.Kim H, Taksali SE, Dufour S, et al. Comparative MR study of hepatic fat quantification using single-voxel proton spectroscopy, two-point dixon and three-point IDEAL. Magn Reson Med 2008;59(3):521–527 [DOI] [PMC free article] [PubMed] [Google Scholar]
- 25.Reeder SB, Robson PM, Yu H, et al. Quantification of hepatic steatosis with MRI: the effects of accurate fat spectral modeling. J Magn Reson Imaging 2009;29(6):1332–1339 [DOI] [PMC free article] [PubMed] [Google Scholar]
- 26.Pineda N, Sharma P, Xu Q, Hu X, Vos M, Martin DR. Measurement of hepatic lipid: high-speed T2-corrected multiecho acquisition at 1H MR spectroscopy—a rapid and accurate technique. Radiology 2009;252(2):568–576 [DOI] [PubMed] [Google Scholar]
- 27.Liu CY, McKenzie CA, Yu H, Brittain JH, Reeder SB. Fat quantification with IDEAL gradient echo imaging: correction of bias from T(1) and noise. Magn Reson Med 2007;58(2):354–364 [DOI] [PubMed] [Google Scholar]
- 28.Bydder M, Yokoo T, Hamilton G, et al. Relaxation effects in the quantification of fat using gradient echo imaging. Magn Reson Imaging 2008;26(3):347–359 [DOI] [PMC free article] [PubMed] [Google Scholar]
- 29.Yu H, McKenzie CA, Shimakawa A, et al. Multiecho reconstruction for simultaneous water-fat decomposition and T2* estimation. J Magn Reson Imaging 2007;26(4):1153–1161 [DOI] [PubMed] [Google Scholar]
- 30.Yu H, Shimakawa A, McKenzie CA, Brodsky E, Brittain JH, Reeder SB. Multiecho water-fat separation and simultaneous R2* estimation with multifrequency fat spectrum modeling. Magn Reson Med 2008;60(5):1122–1134 [DOI] [PMC free article] [PubMed] [Google Scholar]
- 31.Yu H, Shimakawa A, Reeder S, McKenzie C, Brittain J. Magnitude fitting following phase sensitive water-fat separation to remove effects of phase errors (abstr). In: Proceedings of the Seventeenth Meeting of the International Society for Magnetic Resonance in Medicine. Berkeley, Calif: International Society for Magnetic Resonance in Medicine, 2009; 461 [Google Scholar]
- 32.Reeder SB, Pineda AR, Wen Z, et al. Iterative decomposition of water and fat with echo asymmetry and least-squares estimation (IDEAL): application with fast spin-echo imaging. Magn Reson Med 2005;54(3):636–644 [DOI] [PubMed] [Google Scholar]
- 33.Reeder SB, McKenzie CA, Pineda AR, et al. Water-fat separation with IDEAL gradient-echo imaging. J Magn Reson Imaging 2007;25(3):644–652 [DOI] [PubMed] [Google Scholar]
- 34.Brau AC, Beatty PJ, Skare S, Bammer R. Comparison of reconstruction accuracy and efficiency among autocalibrating data-driven parallel imaging methods. Magn Reson Med 2008;59(2):382–395 [DOI] [PMC free article] [PubMed] [Google Scholar]
- 35.Yu H, Reeder SB, Shimakawa A, Brittain JH, Pelc NJ. Field map estimation with a region growing scheme for iterative 3-point water-fat decomposition. Magn Reson Med 2005;54(4):1032–1039 [DOI] [PubMed] [Google Scholar]
- 36.Hines CD, Yu H, Shimakawa A, McKenzie CA, Brittain JH, Reeder SB. T1 independent, T2* corrected MRI with accurate spectral modeling for quantification of fat: validation in a fat-water-SPIO phantom. J Magn Reson Imaging 2009;30(5):1215–1222 [DOI] [PMC free article] [PubMed] [Google Scholar]
- 37.Hines CD, Yu H, Shimakawa A, et al. Quantification of hepatic steatosis with 3-T MR imaging: validation in ob/ob mice. Radiology 2010;254(1):119–128 [DOI] [PMC free article] [PubMed] [Google Scholar]
- 38.Middleton M, Hamilton G, Bydder M, Sirlin C. How much fat is under the water peak in liver fat MR spectroscopy? (abstr). In: Proceedings of the Seventeenth Meeting of the International Society for Magnetic Resonance in Medicine. Berkeley, Calif: International Society for Magnetic Resonance in Medicine, 2009; 4331 [Google Scholar]
- 39.Hamilton G, Middleton MS, Bydder M, et al. Effect of PRESS and STEAM sequences on magnetic resonance spectroscopic liver fat quantification. J Magn Reson Imaging 2009;30(1):145–152 [DOI] [PMC free article] [PubMed] [Google Scholar]
- 40.Bydder M, Hamilton G, Yokoo T, Sirlin CB. Optimal phased-array combination for spectroscopy. Magn Reson Imaging 2008;26(6):847–850 [DOI] [PMC free article] [PubMed] [Google Scholar]
- 41.Vanhamme L, van den Boogaart A, Van Huffel S. Improved method for accurate and efficient quantification of MRS data with use of prior knowledge. J Magn Reson 1997;129(1):35–43 [DOI] [PubMed] [Google Scholar]
- 42.Naressi A, Couturier C, Devos JM, et al. Java-based graphical user interface for the MRUI quantitation package. MAGMA 2001;12(2-3):141–152 [DOI] [PubMed] [Google Scholar]
- 43.Szczepaniak LS, Nurenberg P, Leonard D, et al. Magnetic resonance spectroscopy to measure hepatic triglyceride content: prevalence of hepatic steatosis in the general population. Am J Physiol Endocrinol Metab 2005;288(2):E462–E468 [DOI] [PubMed] [Google Scholar]
- 44.Wood JC, Enriquez C, Ghugre N, et al. MRI R2 and R2* mapping accurately estimates hepatic iron concentration in transfusion-dependent thalassemia and sickle cell disease patients. Blood 2005;106(4):1460–1465 [DOI] [PMC free article] [PubMed] [Google Scholar]
- 45.Bonkovsky HL, Jawaid Q, Tortorelli K, et al. Non-alcoholic steatohepatitis and iron: increased prevalence of mutations of the HFE gene in non-alcoholic steatohepatitis. J Hepatol 1999;31(3):421–429 [DOI] [PubMed] [Google Scholar]
- 46.George DK, Goldwurm S, MacDonald GA, et al. Increased hepatic iron concentration in nonalcoholic steatohepatitis is associated with increased fibrosis. Gastroenterology 1998;114(2):311–318 [DOI] [PubMed] [Google Scholar]
- 47.Schwenzer NF, Machann J, Haap MM, et al. T2* relaxometry in liver, pancreas, and spleen in a healthy cohort of one hundred twenty-nine subjects: correlation with age, gender, and serum ferritin. Invest Radiol 2008;43(12):854–860 [DOI] [PubMed] [Google Scholar]