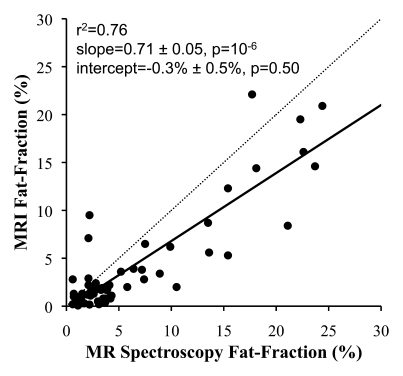
Figure 2c:
Scatterplots show fat fractions obtained with MR imaging plotted against those obtained with MR spectroscopy. The effects of T2* correction and multipeak modeling of fat were investigated by performing four fat-fraction image reconstructions, as follows: (a) without T2* correction and with single peak modeling of fat; (b) without T2* correction and with multipeak modeling of fat; (c) with T2* correction and with single peak modeling of fat; and (d) with T2* correction and with multipeak modeling of fat. MR imaging fat fraction was reconstructed from the same source data and measured from the same ROIs that were co-localized with the MR spectroscopy voxel. Although all combinations demonstrate excellent correlation, agreement between MR imaging and MR spectroscopy was statistically significant only when both T2* correction and multipeak modeling were used. Magnitude fitting was used to avoid the effects of eddy currents for all four reconstructions. These results demonstrate the necessity of both T2* correction and multipeak modeling of fat.

