

Correctly performed MR imaging is accurate with respect to MR spectroscopy in hepatic proton-density fat fraction measurement at 3.0 T.
Abstract
Purpose:
To compare the accuracy of several magnetic resonance (MR) imaging–based methods for hepatic proton-density fat fraction (FF) estimation at 3.0 T, with spectroscopy as the reference technique.
Materials and Methods:
This prospective study was institutional review board approved and HIPAA compliant. Informed consent was obtained. One hundred sixty-three subjects (39 with known hepatic steatosis, 110 with steatosis risk factors, 14 without risk factors) underwent proton MR spectroscopy and non–T1-weighted gradient-echo MR imaging of the liver. At spectroscopy, the reference FF was determined from frequency-selective measurements of fat and water proton densities. At imaging, FF was calculated by using two-, three-, or six-echo methods, with single-frequency and multifrequency fat signal modeling. The three- and six-echo methods corrected for T2*; the two-echo methods did not. For each imaging method, the fat estimation accuracy was assessed by using linear regression between the imaging FF and spectroscopic FF. Binary classification accuracy of imaging was assessed at four reference spectroscopic thresholds (0.04, 0.06, 0.08, and 0.10 FF).
Results:
Regression intercept of two-, three-, and six-echo methods were −0.0211, 0.0087, and −0.0062 (P <.001 for all three) without multifrequency modeling and −0.0237 (P <.001), 0.0022, and −0.0007 with multifrequency modeling, respectively. Regression slope of two-, three-, and six-echo methods were 0.8522, 0.8528, and 0.7544 (P <.001 for all three) without multifrequency modeling and 0.9994, 0.9775, and 0.9821 with multifrequency modeling, respectively. Significant deviation of intercept and slope from 0 and 1, respectively, indicated systematic error. Classification accuracy was 82.2%–90.1%, 93.9%–96.3%, and 83.4%–89.6% for two-, three-, and six-echo methods without multifrequency modeling and 88.3%–92.0%, 95.1%–96.3%, and 94.5%–96.3% with multifrequency modeling, respectively, depending on the FF threshold. T2*-corrected (three- and six-echo) multifrequency imaging methods had the overall highest FF estimation and classification accuracy. Among methods without multifrequency modeling, the T2*-corrected three-echo method had the highest accuracy.
Conclusion:
Non–T1-weighted MR imaging with T2* correction and multifrequency modeling helps accurately estimate hepatic proton-density FF at 3.0 T.
© RSNA, 2011
Introduction
Hepatic steatosis refers to excessive triglyceride (fat) accumulation in hepatocytes and is the defining histologic abnormality of alcoholic and nonalcoholic fatty liver disease (1,2). Other common causes of steatosis include hepatitis C infection (3–5) and certain medications (6,7). Alcoholic and nonalcoholic fatty liver disease can progress to cirrhosis and end-stage liver disease (8–11). Nonalcoholic fatty liver disease also contributes to development of diabetes (12–14) and cardiovascular disease (15–19). In the setting of hepatitis C and other liver diseases, coexisting steatosis may be associated with worse prognosis (3–5,20). Regardless of the specific cause, the diagnosis of steatosis is often important, and appropriate intervention may prevent long-term complications (21–25).
The current clinical reference standard for steatosis assessment is liver biopsy. However, biopsy is invasive, and only a fraction of the liver is sampled (26–30). The histologic interpretation of biopsy results is subjective and semiquantitative (31–33). Noninvasive, objective, quantitative, and whole-liver methods are needed for screening, disease monitoring, and research.
Magnetic resonance (MR) imaging is widely considered an ideal modality for noninvasive fat quantification. The triglyceride molecule is composed of several proton-containing chemical moieties (eg, -[CH2]n-). Each moiety resonates at a distinct frequency from that of water (H2O), as shown in Figure 1 (34,35). By utilizing proton MR spectroscopy, the relative abundance of these fat and water protons, or proton densities, can be determined in a frequency-selective manner, from which tissue FF can be calculated. As previously suggested, this proton-based measure relates to biochemical triglyceride content in liver (35–37) and thus serves as an objective, standardized, and quantitative biomarker for steatosis. Spectroscopic measurement of proton densities (38–40), however, is technically challenging, requiring multiecho acquisition to correct for T2, homogeneous shim, and uniform spectral response. These requirements can be met by using single-voxel but not (yet) multivoxel spectroscopy. Single-voxel methods, however, introduce unavoidable sampling variability and are problematic for longitudinal comparisons.
Figure 1:

Typical MR spectrum of fatty liver. Liver MR spectra in 38-year old woman, acquired at echo time (TE) 10, 15, 20, 25, and 30 msec. Fat peaks (1–5) are centered at 0.9, 1.3, 2.1, 4.2, and 5.3 ppm, respectively. Water peak (w) is at 4.7 ppm. Calculated fat fraction (FF) based on total fat and water proton densities was 0.409. The tiny 2.75-ppm peak (*) was not included in the calculation because it was not consistently observed at 3.0 T.
MR imaging, by comparison, is more suitable for routine clinical application because of accessibility, ease of use, and whole-liver coverage. However, fat quantification with MR imaging can be confounded by T1 relaxation and T2* relaxation effects. Multiple frequency components of triglycerides that cause complex and dynamic signal interference, referred to as the multifrequency effect, may also need consideration. Practical strategies to eliminate these confounders were recently proposed. For example, the effect of unequal fat and water T1s can be minimized by using a non–T1-weighted sequence (41–44). The effect of T2*-related signal loss can be corrected by using images acquired at multiple echo times (41,44–48). The multifrequency effect of fat signal can be modeled on the basis of prior knowledge of the fat spectrum (48–50). By employing these strategies, proton-density FF estimation with MR imaging was accurate with respect to spectroscopy at 1.5 T (49,50).
In principle, similar imaging methods may be implemented at 3.0 T with appropriate field-dependent modifications. However, longer tissue T1s, greater magnetic susceptibility, and higher precession frequencies are expected to exacerbate the confounding T1, T2*, and multifrequency effects, respectively. Therefore, a separate study at 3.0 T is necessary to assess the fat quantification performance. The purpose of this study was to compare the accuracy of several MR imaging methods for hepatic proton-density FF estimation at 3.0 T, with spectroscopy as the reference technique. In particular, the benefit of utilizing T2* correction and multifrequency modeling was assessed.
Materials and Methods
Study Design and Subjects
This prospective clinical study was approved by an institutional review board and was compliant with the Health Insurance Portability and Accountability Act. Between February 2008 and May 2009, subjects were referred by hepatologists and surgeons for participation in our study or were self-referred in response to flyers posted at our institution. Inclusion criteria were children (age, 10–18 years) and adults with histologically confirmed steatosis, children and adults with steatosis risk factors, and adults without specific risk factors (Table 1). The risk factors considered were body mass index 25 kg/m2 or higher, first-degree relative with fatty liver disease, unexplained abnormal serum alanine aminotransferase level, and chronic hepatitis C infection. Exclusion criteria were contraindication to MR imaging, known extreme claustrophobia, weight exceeding 250 lb (113 kg), and pregnancy. These broad criteria maximized enrollment with a wide range of steatosis severity, irrespective of specific causes. No subjects were excluded on the basis of the above criteria. Adult subjects gave informed consent. Children gave assent with parental consent. Age, sex, and cause of liver disease (if any) were recorded. Medication and alcohol-use history were not reviewed.
Table 1.
Characteristics of Study Population
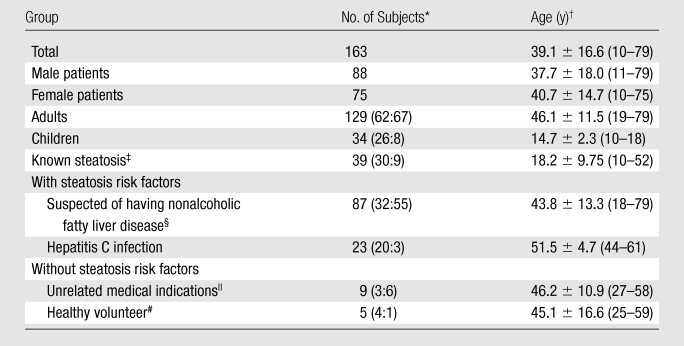
Data in parentheses are male-to-female ratios.
Data are means ± standard deviations, with ranges in parentheses.
Confirmed by biopsy findings.
Body mass index of 25 kg/m2 or higher, family history, or unexplained abnormal serum alanine aminotransferase level.
Referred for abdominal MR imaging for indications unrelated to steatosis.
Body mass index less than 25 kg/m2 and healthy.
MR Examination
Subjects were examined in the supine position by using an eight-channel torso phased-array receive coil at 3.0 T (Signa Excite HD; GE Medical Systems, Milwaukee, Wis). A three-plane localization imaging sequence was performed at the beginning of the examination.
MR spectroscopy.—While avoiding major blood vessels, bile ducts, or liver edges seen on the localization images, a single 20 × 20 × 20-mm voxel was placed in the right hepatic lobe (Couinaud segments V–VIII) and was shimmed automatically. The voxel was overlaid on the corresponding axial localization image and was saved for future reference in the picture archiving and communication system. Stimulated-echo acquisition mode proton spectroscopy was performed by using a long repetition time (3500 msec) to minimize T1 weighting. After a single preacquisition excitation pulse to balance T1 saturation on subsequent excitations, five stimulated-echo acquisition mode spectra were acquired at echo times of 10, 15, 20, 25, and 30 msec in a single 21-second breath hold. This echo time range enabled reproducible T2 estimation while minimizing the confounding effects of fat-peak J coupling (51,52). The shortest possible mixing time (5 msec) was used to minimize both J coupling and T1 weighting. No water, fat, or spatial saturation was applied. Signals recorded at eight array elements were combined into a single spectrum per echo time by using singular value decomposition (53) and were saved as text files for offline analysis.
MR imaging.—Multiple axial magnitude MR images were acquired through the liver by using a two-dimensional spoiled gradient-recalled-echo sequence with all coil elements without parallel imaging. To minimize T1 weighting, a low flip angle (10°) was used with a repetition time of 125 msec or longer (125–270 msec; default, 200 msec). Six fractional echo magnitude images were obtained at echo times of 1.15, 2.30, 3.45, 4.60, 5.75, and 6.90 msec in a single 12–34-second breath hold. Other imaging parameters were as follows: 8–10-mm section thickness; number of sections, 14–26 (default, 23) covering most, if not whole, liver; 0% intersection gap; ±142-kHz receiver bandwidth; 192 × 192 base matrix; number of signals acquired, one; and rectangular field of view adjusted to body habitus and breath-hold capacity. Images were transferred to a picture archiving and communication system for storage and further processing.
Extended examinations.—Whenever the imager schedule allowed for an extended examination, additional sequences were performed with the subject’s permission. The identical imaging sequence was repeated three times in separate breath holds, and the same volume of the liver was covered. When the subject’s hepatic anatomy allowed placement of multiple spectroscopic voxels, up to three nonoverlapping voxels were placed in different hepatic segments, and the identical spectroscopic sequence was repeated three times in separate breath holds at each voxel location. A spectroscopy voxel reference image was saved for each location. Other potential variables, including table and coil position, preimaging calibration, operator, and imaging parameters, were kept constant.
Image Processing
By using picture archiving and communication system software and the spectroscopic reference image, an MR research associate (M.S., 3 years of experience) placed a coregistered circular region of interest (ROI) of approximately 20 mm in diameter on the spoiled gradient-recalled-echo images at each spectroscopic voxel location. The average ROI signal intensity at each echo time was recorded.
FF Calculation
MR spectroscopy.—The spectroscopy data were analyzed offline by an MR physicist (G.H., 8 years of experience) in the time domain by using the advanced method for accurate, robust, and efficient spectral fitting algorithm in Java-based MR user-interface software (jMRUI; http://sermn02.uab.es/mrui) (54,55). T1 weighting was assumed negligible at 3500-msec repetition time and 5-msec mixing time. At each echo time, the areas of the water (4.7 ppm) and the three major fat spectral peaks (0.9, 1.3, and 2.1 ppm) were measured. For each frequency, the peak area was corrected for T2 exponential decay by using nonlinear least-square fitting to determine its relative proton density. On the basis of prior knowledge of the triglyceride molecular structure, the relative proton densities of the two nonmeasurable minor fat peaks (4.2 and 5.3 ppm) were determined from those of the three measurable major fat peaks (40). The smallest spectral component (2.75 ppm) was not considered, because it was not consistently or reliably measurable, unless the subject had extremely high fat content (eg, FF > 0.3). Spectral peaks other than water and fat were not measured. The reference proton-density FF was calculated by dividing the fat proton density (sum of all fat peaks) by the sum of the fat and water proton densities.
MR imaging.—The imaging ROI signal intensity data were analyzed with software (MATLAB; MathWorks, Natick, Mass) by a radiology research resident (T.Y., 4 years of experience). For each multiecho acquisition, imaging FF of the ROI was calculated by using two, three, or all six echo times by employing either the single- or multifrequency fat signal model described below. These six postprocessing methods thus generated six FF estimates from same ROI data. For all FF calculation methods, T1 weighting was assumed negligible because data were acquired with a flip angle of 10° and repetition time of 125 msec or longer.
The single-frequency model consisted of a simplified fat signal, a single-frequency signal at 1.3 ppm (ie, the methylene [-CH2-]n group). The multifrequency model consisted of a composite fat signal, a weighted sum of five frequency signals at 0.9, 1.3, 2.1, 4.2, and 5.3 ppm, with normalized weights of 0.09, 0.70, 0.12, 0.04, and 0.05, respectively. These weights were derived from human subjects with fatty liver disease (40). The smallest 2.75-ppm spectral component was not included to maintain consistency with the spectroscopy data. In both models, the water signal was modeled as a single-frequency signal at 4.7 ppm.
The two-echo method (56,57) used only the first two echo times (1.15 and 2.30 msec) and did not correct for T2*. The three- (41,44) and six-echo methods (45,46) used three (1.15, 2.30, and 4.60 msec) and all six echo times, respectively, to correct for monoexponential T2* decay (50). The three- and six-echo methods with multifrequency fat modeling accounted for all three confounders (T1, T2*, and multiple frequencies). Other methods did not account for T2* and/or the multiple frequency effects.
In addition to the FFs calculated from ROI signal intensity data, multisection liver FF maps were also reconstructed by applying the six-echo multifrequency method pixel by pixel.
Statistical Analysis
Every subject had at least one imaging and one spectroscopic fat measurement at a coregistered location in the liver. In subjects who underwent extended examinations, data from the first acquisition at the first measurement location were used to assess classification and overall estimation accuracy. The following statistical analyses were performed between October 2009 and March 2010 by a radiology research resident (T.Y.) in conjunction with a biostatistician (T.W., >10 years of experience).
Classification accuracy of imaging methods.—For each imaging method, binary classification accuracy was assessed by using spectroscopic FF as the reference for normal-versus-abnormal determination. Four reference thresholds (0.04, 0.06, 0.08, and 0.10 FF) were considered; subjects whose liver FF exceeded the respective threshold value were classified as having abnormal findings. This range included the 95 percentile FF value (0.0556) of the normal population reported previously (38). Bootstrap-based bias-corrected and accelerated 95% confidence intervals (58) were computed for the accuracy estimate of each method, as well as for pairwise differences between two methods.
Overall estimation accuracy of imaging methods.—For each imaging method, fat estimation accuracy was assessed by comparing the imaging and spectroscopic FFs by using linear regression analysis. For each imaging-spectroscopy regression, the calculated slope and intercept were compared with 1 and 0, respectively, by using two-sided t tests. Statistically significant deviation of the slope from 1 and/or intercept from 0 (ie, the identity line) was interpreted as systematic error at imaging compared with spectroscopy. Hochberg adjustment for multiple comparisons (59) was applied to the tests of the six regressions. For each regression, the correlation between imaging and spectroscopy was quantified by using the Pearson correlation coefficient. The average difference between imaging and spectroscopy was computed as the root mean square error (MSE1/2).
Estimation accuracy and intraexamination variability according to hepatic segments.—Subjects who underwent extended examinations had three repeat spectroscopic acquisitions at up to three voxels in different segments. These subjects also had three repeat imaging acquisitions covering most, if not the whole, liver. This design permitted assessment of estimation accuracy and intraexamination variability of imaging in different hepatic segments. For each imaging acquisition, ROIs were drawn on the reconstructed FF maps at corresponding locations of the spectroscopic voxels. In each segment, the estimation accuracy of imaging was assessed by using linear regression to compare the average FF over three repeated imaging measurements with the average FF over three repeated spectroscopic measurements. To assess the variability of imaging and spectroscopy, the average standard deviations of the three repeated imaging and spectroscopic measurements, respectively, were calculated. These analyses were performed by using the six-echo multifrequency imaging data only; data from other imaging methods were not considered. Within-subject variability of FF across different segments (ie, heterogeneity of fat content) was not assessed in this study.
Results
Subjects
During the study period, 163 subjects were enrolled. Subject characteristics are summarized in Table 1. Spectroscopic FF ranged from 0.004 to 0.445, with a mean of 0.097 ± 0.097 (standard deviation). In 48 subjects who underwent extended examination, the spectroscopic FF ranged from 0.008 to 0.431, with a mean of 0.113 ± 0.112.
Classification Accuracy of Imaging Methods
The classification accuracy of the six imaging methods assessed at threshold levels of 0.04–0.10 spectroscopic FF is summarized in Table 2. In pairwise comparisons, the three- and six-echo multifrequency methods and the three-echo single-frequency method had similar accuracy to each other and higher accuracy than the other remaining methods at all tested thresholds.
Table 2.
Classification Accuracy of Imaging at Various FF Thresholds
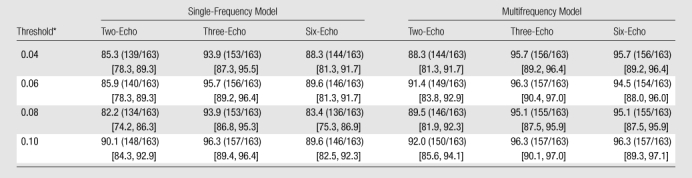
Note.—Data are percentages, with numbers to calculate percentages in parentheses. Data in brackets are bootstrap-based bias-corrected and accelerated 95% confidence intervals. Accuracy was calculated as (TP + TN)/(TP + FP + TN + FN) × 100%, where TP is true positive, FP is false positive, TN is true negative, and FN is false negative.
Diagnostic threshold proton-density FF.
Estimation Accuracy of Imaging Methods
The calculated imaging FF estimates of all 163 subjects were plotted against corresponding spectroscopic FFs (Fig 2). The identity line (slope = 1, intercept = 0) represents perfect imaging-spectroscopic agreement. The T2*-uncorrected (ie, two-echo) imaging methods demonstrated fixed underestimation as indicated by intercept less than 0, at 0.0211 (single-frequency) and 0.0237 (multifrequency) FF. The T2*-corrected (ie, three- and six-echo) methods showed little or no such error, with intercepts similar to 0. All single-frequency methods demonstrated scalar underestimation, as indicated by regression slope less than 1. The severity of this error was similar in the two- and three-echo data but was worse in the six-echo data. Incorporation of the multifrequency model resolved this error, with slopes similar to 1, regardless of number of echo times used. Overall, the T2*-corrected (three- and six-echo) multifrequency methods were the only methods with regression lines not statistically different from the identity line; regression lines of other methods significantly deviated from the identity line (ie, slope ≠ 1 and/or intercept ≠ 0), which indicated systematic bias. The T2*-corrected multifrequency methods had the highest accuracy as evidenced by small MSE1/2 (0.0125); other methods had lower accuracy with MSE1/2 0.0187–0.0400, depending on the degree of bias. All methods demonstrated high correlation with Pearson correlation coefficient of 0.98 or greater. However, high correlation did not necessarily indicate high accuracy, because the FF estimates were biased unless T2* correction and multifrequency modeling were used in combination.
Figure 2:

Fat quantification accuracy of imaging FF calculation methods. Linear regression analysis of imaging FF against spectroscopic FF. Top: Two-, three-, and six-echo method with single-frequency fat modeling (S-2, S-3, and S-6, respectively). Bottom: Two-, three-, and six-echo method with multifrequency fat modeling (M-2, M-3, and M-6, respectively). Red line = best-fit line. Gray line with intercept 0 and slope 1 = perfect agreement between imaging and spectroscopy. * = statistically significant deviation from the null hypotheses (slope = 1, intercept = 0) at Hochberg-adjusted 95% confidence level for multiple comparisons. corr = correction. r = Pearson correlation coefficient.
Estimation of Accuracy and Intraexamination Variability according to Hepatic Segments
Forty-eight subjects had repeated imaging and spectroscopic fat measurements at each coregistered location in the liver. Three different segments were sampled in 36 subjects, two different segments were sampled in nine subjects, and one segment was sampled in three subjects. The number of measurements in each segment is summarized in Table 3. Figure 3 shows the linear regression results between imaging and spectroscopy in each sampled segment. No segment showed statistically significant deviation from the diagonal line, with MSE1/2 ranging from 0.0082 to 0.0149 depending on the segment, which indicated high imaging-spectroscopy agreement (Fig 4). As shown in Table 3, the average standard deviation over repeated measurements was 0.0021–0.0055 in absolute FF for imaging and 0.0054–0.0096 for spectroscopy, depending on the segments. This sets nominal 95% confidence interval (1.96 · standard deviation) around measured FF values at ±0.0041–0.0108 for imaging and ±0.0106–0.0188 for spectroscopy, depending on the segments. Thus, imaging had slightly smaller measurement variability than spectroscopy; formal testing was not performed to assess the significance of this difference.
Table 3.
Fat Estimation Variability according to Hepatic Segment
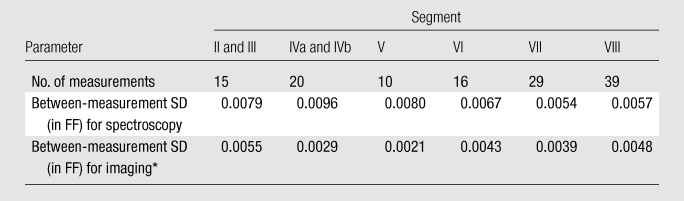
Note.—Data for segments II and III were pooled, as were data for segments IVa and IVb. No measurements were made in segment I because of small size. SD = standard deviation.
Six-echo multifrequency imaging method.
Figure 3:

Fat quantification accuracy of six-echo multifrequency imaging according to hepatic segments. Linear regression analysis of imaging FF against spectroscopic FF according to hepatic segments (II/III, IV, V, VI, VII, and VIII). Red line = best-fit line. Gray line with intercept 0 and slope 1 = perfect agreement between imaging and spectroscopy. No slope or intercept estimates were significantly different from 1 or 0, respectively, at Hochberg-adjusted 95% confidence level for multiple comparisons. r = regression coefficient.
Figure 4:

Cross-section gray-scale FF (in percentages) maps (dynamic range, 0%–50%) through the upper liver of patients suspected of having fatty liver disease were generated by using an automated online postprocessing algorithm (six-echo multifrequency method). Maps are in (left) segments IVa, VII, and VIII in 26-year-old woman, (middle) segments II, IVa, and VII in 45-year-old woman, and (right) segments IVa, VII, and VIII in 27-year-old man. Spectroscopic (white) and imaging (black) FF values at coregistered locations are shown.
Discussion
This prospective clinical study assessed the accuracy of MR imaging in hepatic FF estimation at 3.0 T, by using spectroscopy as the reference technique. Proton-density FF, an objective and standardized MR measure of tissue triglyceride content (35–37), serves as a quantitative biomarker for hepatic steatosis. At spectroscopy, the reference FF was directly determined by frequency-specific measurement of fat and water proton densities. At imaging, FF was calculated from non–T1-weighted images by using several different postprocessing methods, including T2*-corrected multifrequency methods. The accuracy of each imaging method in FF estimation was assessed by comparing calculated FF (imaging) with the reference FF (spectroscopy) at coregistered locations in the liver. The main result was that imaging FF approaches spectroscopic FF, if the confounding effects of T1, T2*, and multiple signal frequencies are minimized, corrected, and modeled, respectively. This result is in agreement with a previous human study at 1.5 T (50) and an animal study at 3.0 T (60) and underscores the importance of controlling these confounders.
Spectroscopy, rather than histologic examination, was chosen as the reference technique for the following reasons. First, FF calculated from spectroscopy-determined proton densities is directly related to the molecular triglyceride content (35–37). Second, spectroscopy and imaging both are used to measure fat content volumetrically by the relative number of fat protons and therefore are directly comparable with each other. Histologic examination assesses the number of fat-containing cells and does not measure volumetric fat content. Spectroscopy can be performed contemporaneously with imaging, the sampling volumes are similar (8000 mm3 for spectroscopy, 3000 mm3 for imaging), and reasonable colocalization is achievable. By comparison, core biopsy (approximately 30 mm3) is two orders of magnitude smaller in volume, prone to sampling error, and difficult to colocalize with imaging.
Single-frequency imaging methods based on one fat proton species (-CH2-) traditionally have been used to assess liver fat at both 1.5 (41,45,46,56,57) and 3.0 T (44,47). This study showed that such methods measure only a fraction of total fat, as indicated by the imaging-spectroscopy regression slope of less than 1. Multifrequency methods, incorporating all fat proton species, were shown to correctly measure the total fat quantity, with regression slope of approximately 1. This study also showed that T2* correction generally improved accuracy, which was consistent with previous results (41,44,46,47). However, the effect of T2* correction when using a single-frequency model depended on the number of echo times used for T2* estimation (three vs six), which suggests inadequacy of the single-frequency model for reliable T2* estimation. No such inconsistency was observed with multifrequency methods. On the basis of these observations, the most accurate imaging strategy is to use T2* correction with three or more echo times and multifrequency modeling, in addition to low T1 weighting. With this strategy, three echo times seemed sufficient for high FF accuracy, which then would allow acquisition of more two-dimensional sections within a given breath-hold duration. However, a separate study would be needed to systematically assess the FF estimation performance as a function of echo times and number of echo times. Adjustment of the two-echo FF with the observed slope and intercept is not recommended, because the individual T2* is generally unknown a priori and can vary in patients with coexisting abnormalities such as iron overload.
This study also evaluated the performance of MR imaging in different hepatic segments, with spectroscopy as the reference. Given the examination time and anatomic constraints, up to three segments were sampled per subject; all segments were collectively sampled in the study population except segment I. Close agreement between imaging and spectroscopy in all sampled segments suggest high accuracy of imaging over the entire liver. Both imaging and spectroscopy had low intraexamination variability in all segments, with measurement standard deviations less than 0.01 for both modalities. Slightly lower observed variability of imaging over spectroscopy may be because of mismatch in shape (circular vs rectangular), sampling volume (approximately 3000 mm3 vs approximately 8000 mm3), and ease of ROI or voxel registration between separate breath holds. We reported within-examination variability over three separate breath holds, with all other variables kept constant. This helps establish the upper bound on the precision performance of the technique. To assess the between-examination variability, a separate study is necessary that includes the influence of other variables, such as table and coil positions, imager calibration, imaging parameters, operator, and reader.
The high accuracy of FF estimation by using our 3.0-T GE imager was similar to previous studies with 1.5-T Siemens (50) and 1.5-T GE (49) imagers. This implies that the proton-density–based approach is likely cross-platform compatible and independent of the field-dependent changes in T1, T2*, and phase-cycling rates. Although not formerly tested, fat measurement may be advantageous at 3.0 T compared with 1.5 T, because of superior signal-to-noise ratio and accelerated phase cycling, allowing faster data acquisition. In principle, this proton-density–based approach can be implemented with any high-field-strength clinical imager 1.5 T or higher with multiecho spoiled gradient-recalled-echo capability. Moreover, to facilitate the application of this approach for clinical practice or research, T2* correction and multifrequency modeling can be incorporated as an automated postprocessing module, and FF maps can be generated online.
The following limitations of the study design and methods merit discussion. The study included subjects known to have or suspected of having steatosis, regardless of liver disease cause. The broad inclusion criteria were intended to collect a population sample with a wide range of liver fat content. Fat quantity at magnitude-based, phase-interference imaging is inaccurate in fat-dominant tissues, a problem called fat-water dominance ambiguity. In fat-dominant tissues (ie, FF > 0.5), additional techniques, such as field mapping (49), fat suppression (61), or multiple flip angles (or repetition times) (41), are needed to resolve the ambiguity. However, this ambiguity is a very infrequent concern, because proton-density FF rarely exceeds 0.5 in liver. None of the 2287 Dallas Heart Study subjects (38) exceeded 0.5 proton-density FF. The multifrequency FF calculation used a five-frequency fat signal model with predetermined weights; thus, an identical fat spectrum was assumed for all subjects, and possible individual variation in fatty acid composition was ignored. However, typical individual variation in the fat spectrum is unlikely to result in clinically meaningful estimation errors. As shown in a prior study (62), estimation accuracy was not meaningfully affected within reasonable variations of the fat signal model. Random imaging noise has been suggested as a potential source of error in fat quantification with complex data–based techniques (42). While no formal assessments were performed, high accuracy and low intraexamination variability at 3.0 T suggest that the contribution of random noise is not clinically important with magnitude data–based imaging techniques such as those presented here.
In conclusion, this clinical study showed that correctly performed MR imaging was accurate with respect to MR spectroscopy in hepatic proton-density FF measurement at 3.0 T. For the purposes of hepatic fat quantification, MR imaging may be an appropriate alternative to MR spectroscopy.
Advances in Knowledge.
MR imaging, if performed correctly, is accurate with respect to MR spectroscopy in the estimation of hepatic proton-density fat fraction (FF) at 3.0 T, with an average estimation error of ±0.0125 in absolute FF.
Accurate estimation of proton-density FF at MR imaging requires modeling of the multiple signal frequencies and correction of T2* decay, in addition to low T1 weighting.
Implications for Patient Care.
Proton-density FF serves as an objective, standardized, quantitative biomarker for hepatic steatosis.
MR imaging may be an appropriate alternative to MR spectroscopy for hepatic fat quantification.
Disclosures of Potential Conflicts of Interest: T.Y. Financial activities related to the present article: institution received grants from the National Institutes of Health and Bayer Healthcare. Financial activities not related to the present article: employed (resident) at the University of California at San Diego Medical Center; author and institution received research resident grant from RSNA; received travel stipend from ISMRM; received trainee research prize from RSNA. Other relationships: none to disclose. M.S. No potential conflicts of interest to disclose. G.H. Financial activities related to the present article: institution received grants from the National Institutes of Health and GE. Financial activities not related to the present article: institution receives money for patent with UCSD Tech Transfer. Other relationships: none to disclose. T.W. No potential conflicts of interest to disclose. M.E.S. No potential conflicts of interest to disclose. M.S.M. Financial activities related to the present article: institution received grant from GE for research funding. Financial activities not related to the present article: institution received grant from GE for research funding; is personal stockholder in GE (not provided by GE). Other relationships: none to disclose. M.B. Financial activities related to the present article: institution received grants from the National Institutes of Health (R01 DK075128) and from GE for research support. Financial activities not related to the present article: institution received money for consultancy from Merck; institution received grant from National Institutes of Health; institution has patent with UCSD Tech Transfer; institution receives royalties from UCSD Tech Transfer; institution receives royalties from VirtualScopics; author received payment for development of educational presentations from ISMRM. Other relationships: none to disclose. A.C.G. No potential conflicts of interest to disclose. Y.K. No potential conflicts of interest to disclose. A.K. No potential conflicts of interest to disclose. H.M.P. Financial activities related to the present article: none to disclose. Financial activities not related to the present article: received payment for presenting Medicine Grand Rounds on viral hepatitis from Alvarado Hospital. Other relationships: none to disclose. S.H. Financial activities related to the present article: received consulting fee or honorarium from Intuitive Surgical, Allergan Medical, Olympus, USGI Medical, and GORE Medical; received support for travel from Valentx. Financial activities not related to the present article: received payment for board membership from Intuitive Surgical, Virtual Ports, and Stryker; received consulting fee from Valentx and Intuitive Surgical; institution received grants from Allergan, USGI, and Medigus; was proctor/speaker for ETHICON Endo-Surgery; developed educational presentations for ETHICON Endo-Surgery; has stock in Virtual Ports and Apollo Surgical; received travel support from Valentx. Other relationships: none to disclose. J.E.L. Financial activities related to the present article: institution received NIDDK NASH CRN funding from the National Institutes of Health. Financial activities not related to the present article: institution received National Institutes of Health grant. Other relationships: none to disclose. J.B.S. Financial activities related to the present article: institution received grant from the National Institutes of Health. Financial activities not related to the present article: institution received grant from the National Institutes of Health. Other relationships: none to disclose. C.B.S. Financial activities related to the present article: institution received grants from the National Institutes of Health and GE; institution received travel support from the National Institutes of Health. Financial activities not related to the present article: institution receives payment for board membership of Bayer; institution receives payment for consultancy from Bayer, ISIS, and Merck; institution received grants from Bayer and Bracco; institution receives payment for lectures from Bayer; institution receives payment for development of educational presentations from Medscape, ICPME, and Bayer; institution serves on GE Medical Advisory Board and Bayer Medical Advisory Board. Other relationships: none to disclose.
Received March 29, 2010; revision requested June 8; revision received September 17; accepted September 30; final version accepted October 20.
Supported in part by Bayer Healthcare grant 070525.
Funding: This research was supported by the National Institutes of Health (grants NIDDK DK075128.04, NCMHD EXPORT P60 MD00220).
Abbreviations:
- FF
- fat fraction
- MSE
- mean square error
- ROI
- region of interest
References
- 1.Brunt EM. Alcoholic and nonalcoholic steatohepatitis. Clin Liver Dis 2002;6(2):399–420, vii [DOI] [PubMed] [Google Scholar]
- 2.Forgione A, Miele L, Cefalo C, Gasbarrini G, Grieco A. Alcoholic and nonalcoholic forms of fatty liver disease. Minerva Gastroenterol Dietol 2007;53(1):83–100 [PubMed] [Google Scholar]
- 3.Leandro G, Mangia A, Hui J, et al. Relationship between steatosis, inflammation, and fibrosis in chronic hepatitis C: a meta-analysis of individual patient data. Gastroenterology 2006;130(6):1636–1642 [DOI] [PubMed] [Google Scholar]
- 4.Björnsson E, Angulo P. Hepatitis C and steatosis. Arch Med Res 2007;38(6):621–627 [DOI] [PubMed] [Google Scholar]
- 5.Negro F, Sanyal AJ. Hepatitis C virus, steatosis and lipid abnormalities: clinical and pathogenic data. Liver Int 2009;29(suppl 2):26–37 [DOI] [PubMed] [Google Scholar]
- 6.Ramachandran R, Kakar S. Histological patterns in drug-induced liver disease. J Clin Pathol 2009;62(6):481–492 [DOI] [PubMed] [Google Scholar]
- 7.Zorzi D, Laurent A, Pawlik TM, Lauwers GY, Vauthey JN, Abdalla EK. Chemotherapy-associated hepatotoxicity and surgery for colorectal liver metastases. Br J Surg 2007;94(3):274–286 [DOI] [PubMed] [Google Scholar]
- 8.Diehl AM. Alcoholic liver disease: natural history. Liver Transpl Surg 1997;3(3):206–211 [PubMed] [Google Scholar]
- 9.Matteoni CA, Younossi ZM, Gramlich T, Boparai N, Liu YC, McCullough AJ. Nonalcoholic fatty liver disease: a spectrum of clinical and pathological severity. Gastroenterology 1999;116(6):1413–1419 [DOI] [PubMed] [Google Scholar]
- 10.Angulo P, Keach JC, Batts KP, Lindor KD. Independent predictors of liver fibrosis in patients with nonalcoholic steatohepatitis. Hepatology 1999;30(6):1356–1362 [DOI] [PubMed] [Google Scholar]
- 11.Mills SJ, Harrison SA. Comparison of the natural history of alcoholic and nonalcoholic fatty liver disease. Curr Gastroenterol Rep 2005;7(1):32–36 [DOI] [PubMed] [Google Scholar]
- 12.Amarapurka DN, Amarapurkar AD, Patel ND, et al. Nonalcoholic steatohepatitis (NASH) with diabetes: predictors of liver fibrosis. Ann Hepatol 2006;5(1):30–33 [PubMed] [Google Scholar]
- 13.Ekstedt M, Franzén LE, Mathiesen UL, et al. Long-term follow-up of patients with NAFLD and elevated liver enzymes. Hepatology 2006;44(4):865–873 [DOI] [PubMed] [Google Scholar]
- 14.Adams LA, Waters OR, Knuiman MW, Elliott RR, Olynyk JK. NAFLD as a risk factor for the development of diabetes and the metabolic syndrome: an eleven-year follow-up study. Am J Gastroenterol 2009;104(4):861–867 [DOI] [PubMed] [Google Scholar]
- 15.Schindhelm RK, Diamant M, Heine RJ. Nonalcoholic fatty liver disease and cardiovascular disease risk. Curr Diab Rep 2007;7(3):181–187 [DOI] [PubMed] [Google Scholar]
- 16.Targher G, Bertolini L, Rodella S, et al. Nonalcoholic fatty liver disease is independently associated with an increased incidence of cardiovascular events in type 2 diabetic patients. Diabetes Care 2007;30(8):2119–2121 [DOI] [PubMed] [Google Scholar]
- 17.Schwimmer JB, Pardee PE, Lavine JE, Blumkin AK, Cook S. Cardiovascular risk factors and the metabolic syndrome in pediatric nonalcoholic fatty liver disease. Circulation 2008;118(3):277–283 [DOI] [PMC free article] [PubMed] [Google Scholar]
- 18.Dunn W, Xu R, Wingard DL, et al. Suspected nonalcoholic fatty liver disease and mortality risk in a population-based cohort study. Am J Gastroenterol 2008;103(9):2263–2271 [DOI] [PMC free article] [PubMed] [Google Scholar]
- 19.Rubinstein E, Lavine JE, Schwimmer JB. Hepatic, cardiovascular, and endocrine outcomes of the histological subphenotypes of nonalcoholic fatty liver disease. Semin Liver Dis 2008;28(4):380–385 [DOI] [PubMed] [Google Scholar]
- 20.Powell EE, Jonsson JR, Clouston AD. Steatosis: co-factor in other liver diseases. Hepatology 2005;42(1):5–13 [DOI] [PubMed] [Google Scholar]
- 21.Ueno T, Sugawara H, Sujaku K, et al. Therapeutic effects of restricted diet and exercise in obese patients with fatty liver. J Hepatol 1997;27(1):103–107 [DOI] [PubMed] [Google Scholar]
- 22.Hickman IJ, Jonsson JR, Prins JB, et al. Modest weight loss and physical activity in overweight patients with chronic liver disease results in sustained improvements in alanine aminotransferase, fasting insulin, and quality of life. Gut 2004;53(3):413–419 [DOI] [PMC free article] [PubMed] [Google Scholar]
- 23.Huang MA, Greenson JK, Chao C, et al. One-year intense nutritional counseling results in histological improvement in patients with non-alcoholic steatohepatitis: a pilot study. Am J Gastroenterol 2005;100(5):1072–1081 [DOI] [PubMed] [Google Scholar]
- 24.Musso G, Gambino R, Cassader M. Non-alcoholic fatty liver disease from pathogenesis to management: an update. Obes Rev 2010;11(6):430–435 [DOI] [PubMed] [Google Scholar]
- 25.Tendler D, Lin S, Yancy WS, Jr, et al. The effect of a low-carbohydrate, ketogenic diet on nonalcoholic fatty liver disease: a pilot study. Dig Dis Sci 2007;52(2):589–593 [DOI] [PubMed] [Google Scholar]
- 26.Thampanitchawong P, Piratvisuth T. Liver biopsy: complications and risk factors. World J Gastroenterol 1999;5(4):301–304 [DOI] [PMC free article] [PubMed] [Google Scholar]
- 27.Joy D, Thava VR, Scott BB. Diagnosis of fatty liver disease: is biopsy necessary? Eur J Gastroenterol Hepatol 2003;15(5):539–543 [DOI] [PubMed] [Google Scholar]
- 28.Ratziu V, Charlotte F, Heurtier A, et al. Sampling variability of liver biopsy in nonalcoholic fatty liver disease. Gastroenterology 2005;128(7):1898–1906 [DOI] [PubMed] [Google Scholar]
- 29.Janiec DJ, Jacobson ER, Freeth A, Spaulding L, Blaszyk H. Histologic variation of grade and stage of non-alcoholic fatty liver disease in liver biopsies. Obes Surg 2005;15(4):497–501 [DOI] [PubMed] [Google Scholar]
- 30.Ratziu V, Bugianesi E, Dixon J, et al. Histological progression of non-alcoholic fatty liver disease: a critical reassessment based on liver sampling variability. Aliment Pharmacol Ther 2007;26(6):821–830 [DOI] [PubMed] [Google Scholar]
- 31.Brunt EM, Janney CG, Di Bisceglie AM, Neuschwander-Tetri BA, Bacon BR. Nonalcoholic steatohepatitis: a proposal for grading and staging the histological lesions. Am J Gastroenterol 1999;94(9):2467–2474 [DOI] [PubMed] [Google Scholar]
- 32.Sanyal AJ; American Gastroenterological Association AGA technical review on nonalcoholic fatty liver disease. Gastroenterology 2002;123(5):1705–1725 [DOI] [PubMed] [Google Scholar]
- 33.Kleiner DE, Brunt EM, Van Natta M, et al. Design and validation of a histological scoring system for nonalcoholic fatty liver disease. Hepatology 2005;41(6):1313–1321 [DOI] [PubMed] [Google Scholar]
- 34.Longo R, Pollesello P, Ricci C, et al. Proton MR spectroscopy in quantitative in vivo determination of fat content in human liver steatosis. J Magn Reson Imaging 1995;5(3):281–285 [DOI] [PubMed] [Google Scholar]
- 35.Thomsen C, Becker U, Winkler K, Christoffersen P, Jensen M, Henriksen O. Quantification of liver fat using magnetic resonance spectroscopy. Magn Reson Imaging 1994;12(3):487–495 [DOI] [PubMed] [Google Scholar]
- 36.Szczepaniak LS, Babcock EE, Schick F, et al. Measurement of intracellular triglyceride stores by H spectroscopy: validation in vivo. Am J Physiol 1999;276(5 pt 1):E977–E989 [DOI] [PubMed] [Google Scholar]
- 37.Reeder S, Hines C, Yu H, McKenzie C, Brittain J. On the definition of fat-fraction for in vivo fat quantification with magnetic resonance imaging [abstr]. In: Proceedings of the Seventeenth Meeting of the International Society for Magnetic Resonance in Medicine. Berkeley, Calif: International Society for Magnetic Resonance in Medicine, 2009; 211 [Google Scholar]
- 38.Szczepaniak LS, Nurenberg P, Leonard D, et al. Magnetic resonance spectroscopy to measure hepatic triglyceride content: prevalence of hepatic steatosis in the general population. Am J Physiol Endocrinol Metab 2005;288(2):E462–E468 [DOI] [PubMed] [Google Scholar]
- 39.Hamilton G, Middleton MS, Bydder M, et al. Influence of MR spectroscopy sequence on the measurement of IHCL levels [abstr]. In: Radiological Society of North America Scientific Assembly and Annual Meeting Program. Oak Brook, Ill: Radiological Society of North America, 2007; 548 [Google Scholar]
- 40.Middleton M, Hamilton G, Bydder M, Sirlin C. How much fat is under the water peak in liver fat MR spectroscopy? [abstr]. In: Proceedings of the Seventeenth Meeting of the International Society for Magnetic Resonance in Medicine. Berkeley, Calif: International Society for Magnetic Resonance in Medicine, 2009; 4331 [Google Scholar]
- 41.Hussain HK, Chenevert TL, Londy FJ, et al. Hepatic fat fraction: MR imaging for quantitative measurement and display—early experience. Radiology 2005;237(3):1048–1055 [DOI] [PubMed] [Google Scholar]
- 42.Liu CY, McKenzie CA, Yu H, Brittain JH, Reeder SB. Fat quantification with IDEAL gradient echo imaging: correction of bias from T(1) and noise. Magn Reson Med 2007;58(2):354–364 [DOI] [PubMed] [Google Scholar]
- 43.Yokoo T, Collins JM, Hanna RF, Bydder M, Middleton MS, Sirlin CB. Effects of intravenous gadolinium administration and flip angle on the assessment of liver fat signal fraction with opposed-phase and in-phase imaging. J Magn Reson Imaging 2008;28(1):246–251 [DOI] [PubMed] [Google Scholar]
- 44.Guiu B, Petit JM, Loffroy R, et al. Quantification of liver fat content: comparison of triple-echo chemical shift gradient-echo imaging and in vivo proton MR spectroscopy. Radiology 2009;250(1):95–102 [DOI] [PubMed] [Google Scholar]
- 45.Yu H, McKenzie CA, Shimakawa A, et al. Multiecho reconstruction for simultaneous water-fat decomposition and T2* estimation. J Magn Reson Imaging 2007;26(4):1153–1161 [DOI] [PubMed] [Google Scholar]
- 46.Bydder M, Yokoo T, Hamilton G, et al. Relaxation effects in the quantification of fat using gradient echo imaging. Magn Reson Imaging 2008;26(3):347–359 [DOI] [PMC free article] [PubMed] [Google Scholar]
- 47.O’Regan DP, Callaghan MF, Wylezinska-Arridge M, et al. Liver fat content and T2*: simultaneous measurement by using breath-hold multiecho MR imaging at 3.0 T—feasibility. Radiology 2008;247(2):550–557 [DOI] [PubMed] [Google Scholar]
- 48.Yu H, Shimakawa A, McKenzie CA, Brodsky E, Brittain JH, Reeder SB. Multiecho water-fat separation and simultaneous R2* estimation with multifrequency fat spectrum modeling. Magn Reson Med 2008;60(5):1122–1134 [DOI] [PMC free article] [PubMed] [Google Scholar]
- 49.Reeder SB, Robson PM, Yu H, et al. Quantification of hepatic steatosis with MRI: the effects of accurate fat spectral modeling. J Magn Reson Imaging 2009;29(6):1332–1339 [DOI] [PMC free article] [PubMed] [Google Scholar]
- 50.Yokoo T, Bydder M, Hamilton G, et al. Nonalcoholic fatty liver disease: diagnostic and fat-grading accuracy of low-flip-angle multiecho gradient-recalled-echo MR imaging at 1.5 T. Radiology 2009;251(1):67–76 [DOI] [PMC free article] [PubMed] [Google Scholar]
- 51.Hamilton G, Middleton M, Shiehmorteza M, Sirlin C. The effect of J-coupling on absolute quantification of liver fat using MRS: a phantom study [abstr]. In: Proceedings of the Seventeenth Meeting of the International Society for Magnetic Resonance in Medicine. Berkeley, Calif: International Society for Magnetic Resonance in Medicine, 2009; 2149 [Google Scholar]
- 52.Hamilton G, Middleton MS, Bydder M, et al. Effect of PRESS and STEAM sequences on magnetic resonance spectroscopic liver fat quantification. J Magn Reson Imaging 2009;30(1):145–152 [DOI] [PMC free article] [PubMed] [Google Scholar]
- 53.Bydder M, Hamilton G, Yokoo T, Sirlin CB. Optimal phased-array combination for spectroscopy. Magn Reson Imaging 2008;26(6):847–850 [DOI] [PMC free article] [PubMed] [Google Scholar]
- 54.Vanhamme L, van den Boogaart A, Van Huffel S. Improved method for accurate and efficient quantification of MRS data with use of prior knowledge. J Magn Reson 1997;129(1):35–43 [DOI] [PubMed] [Google Scholar]
- 55.Naressi A, Couturier C, Castang I, de Beer R, Graveron-Demilly D. Java-based graphical user interface for MRUI, a software package for quantitation of in vivo/medical magnetic resonance spectroscopy signals. Comput Biol Med 2001;31(4):269–286 [DOI] [PubMed] [Google Scholar]
- 56.Dixon WT. Simple proton spectroscopic imaging. Radiology 1984;153(1):189–194 [DOI] [PubMed] [Google Scholar]
- 57.Fishbein MH, Stevens WR. Rapid MRI using a modified Dixon technique: a non-invasive and effective method for detection and monitoring of fatty metamorphosis of the liver. Pediatr Radiol 2001;31(11):806–809 [DOI] [PubMed] [Google Scholar]
- 58.Efron B. Better bootstrap confidence intervals. J Am Stat Assoc 1987;82(397):171–185 [Google Scholar]
- 59.Hochberg A. A sharper Bonferroni procedure for multiple tests of significance. Biometrika 1988;75(4):800–802 [Google Scholar]
- 60.Hines CD, Yu H, Shimakawa A, et al. Quantification of hepatic steatosis with 3-T MR imaging: validation in ob/ob mice. Radiology 2010;254(1):119–128 [DOI] [PMC free article] [PubMed] [Google Scholar]
- 61.Qayyum A, Goh JS, Kakar S, Yeh BM, Merriman RB, Coakley FV. Accuracy of liver fat quantification at MR imaging: comparison of out-of-phase gradient-echo and fat-saturated fast spin-echo techniques—initial experience. Radiology 2005;237(2):507–511 [DOI] [PubMed] [Google Scholar]
- 62.Yokoo T, Bydder M, Hamilton G, et al. Effect of fat spectral model parameters on hepatic fat quantification by multi-echo gradient-echo magnetic resonance imaging [abstr]. In: Proceedings of the Seventeenth Meeting of the International Society for Magnetic Resonance in Medicine. Berkeley, Calif: International Society for Magnetic Resonance in Medicine, 2009;2134 [Google Scholar]