The results of our study suggest that expression levels of different tumor angiogenic markers vary during tumor growth in subcutaneous human breast, ovarian, and pancreatic cancer xenografts in mice and that targeted contrast-enhanced US imaging allows longitudinal noninvasive assessment of the temporal tumor angiogenic molecular marker expression levels in vivo.
Abstract
Purpose:
To evaluate the use of molecularly targeted microbubbles (MBs) and ultrasonography (US) in the noninvasive assessment of the level of expression of three angiogenic markers, αvβ3 integrin, endoglin, and vascular endothelial growth factor receptor (VEGFR) 2, on tumor vascular endothelial cells in vivo during tumor growth.
Materials and Methods:
All procedures using laboratory animals were approved by the Institutional Administrative Panel on Laboratory Animal Care. Binding specificity of three types of targeted MBs (MBIntegrin, MBEndoglin, MBVEGFR2) was tested in cell culture under flow shear stress conditions. In vivo targeted contrast material–enhanced US imaging signal using the three MB types was measured at three tumor stages (small, medium, large) in three subcutaneous cancer xenografts (breast, ovarian, pancreatic cancer) in mice (n = 54). In vivo US imaging signal was correlated with ex vivo angiogenic marker expression. Significant differences were evaluated by using the Student t, analysis of variance, Wilcoxon, and Tukey Honest Significant Difference tests.
Results:
Cell attachment of all three MB types was significantly (P = .016) higher compared with control MBs, and this attachment could be significantly (P = .026) decreased by blocking antibodies. Angiogenic marker–expressing cells bound significantly (P = .003) more targeted MBs than negative control cells, and MB attachment significantly (P < .001) correlated with marker expression levels on cells (ρ = 0.87). In early stage breast and ovarian cancers, in vivo targeted contrast-enhanced US demonstrated significantly (P ≤ .04) higher endoglin expression than both αvβ3 integrin and VEGFR2 expression, whereas in early stage pancreatic cancer, marker expressions were not significantly different (P ≥ .07). There was good correlation (ρ ≥ 0.63; P ≤ .05) between in vivo targeted contrast-enhanced US imaging signals using the three MB types and ex vivo immunoblotting results regarding expression levels of the three angiogenic markers. Immunofluorescence confirmed expression of αvβ3 integrin, endoglin, and VEGFR2 on tumor vascular endothelial cells.
Conclusion:
Targeted contrast-enhanced US imaging allows noninvasive in vivo assessment of the expression levels of αvβ3 integrin, endoglin, and VEGFR2, which vary during tumor growth in subcutaneous cancer xenografts.
© RSNA, 2011
Supplemental material: http://radiology.rsna.org/lookup/suppl/doi:10.1148/radiol.10101079/-/DC1
Introduction
Tumor angiogenesis, which is the formation of new blood vessels, is one of the most intensively studied areas of cancer research in recent years. After reaching a size of 1–2 mm in diameter, many tumors rely on an angiogenic switch, rendering tumor angiogenesis one of the hallmarks of early cancer (1). Therefore, the ability to visualize and quantify tumor angiogenesis may not only allow antiangiogenic treatment monitoring (2) in patients with cancer but may also be an elegant approach for screening and detecting cancer at an early, still curable stage, just after the angiogenic switch has occurred in tumor progression.
Several molecular angiogenic markers are overexpressed in tumors and could be used as targets for early cancer detection. αvβ3 Integrin, endoglin, and vascular endothelial growth factor (VEGF) receptor (VEGFR) 2 are three of the best-characterized molecular markers of tumor angiogenesis (3–5). These angiogenic markers are overexpressed on tumor vascular endothelial cells in several solid tumors, including breast (6,7), ovarian (8,9), and pancreatic cancer (10) and are considered important factors in tumor angiogenesis. Integrin αvβ3, a glycoprotein that consists of a noncovalently bound α and β subunit, forms a heterodimeric transmembrane receptor for extracellular matrix molecules including fibronectin, fibrinogen, von Willebrand factor, vitronectin, and proteolysed forms of collagen and laminin (11,12). These extracellular matrix molecules activate signaling cascades that regulate gene expression, cytoskeletal organization, cell adhesion, and cell survival and as a result make tumor cells become more invasive, migratory, and better able to survive in different microenvironments (11). Endoglin (CD105) is a transmembrane glycoprotein expressed predominantly on endothelial cells undergoing active angiogenesis, such as tumor endothelial cells (13). It is a component of the receptor complex of transforming growth factor (TGF)-β1, a pleiotropic cytokine involved in cellular proliferation, differentiation, and migration (14). The inhibition of endoglin expression enhanced the ability of TGF-β1 to suppress growth, migration, and capacity to form capillaries from cultured endothelial cells. VEGFR2 is an endothelium-specific receptor tyrosine kinase that is activated by VEGF A. Activation of the VEGF/VEGFR2 pathway triggers multiple signaling networks that result in endothelial cell survival, mitogenesis, migration, differentiation, and vascular permeability (15).
Little is known on the temporal expression levels of different tumor angiogenic markers during progression from small to larger tumors. Insights into the expression levels of tumor angiogenic markers during the progression of cancer, however, is of great importance in developing novel molecular imaging strategies aimed at visualization of tumor angiogenesis markers that are overexpressed in particular in early stage cancer for screening purposes. Knowledge of the temporal tumor angiogenic marker expression levels could also be useful for both drug development and to personalize future treatment plans in patients with cancer.
Targeted contrast material–enhanced ultrasonography (US) is a promising noninvasive molecular imaging approach that allows in vivo assessment of molecular markers of tumor angiogenesis (16–18). Since contrast agents used for this imaging approach stay within the vascular compartment owing to their diameter of several micrometers (19), this approach allows exclusive visualization of molecular markers of angiogenesis expressed on tumor vascular endothelial cells.
In this study, we hypothesized that the expression of the three tumor angiogenic markers αvβ3 integrin, endoglin, and VEGFR2 varies during the growth of subcutaneous ovarian, breast, and pancreatic cancer xenografts in mice. The purpose of this study was to evaluate whether targeted contrast-enhanced US allows noninvasive assessment of the temporal expression levels of αvβ3 integrin, endoglin, and VEGFR2 on tumor vascular endothelial cells in vivo.
Materials and Methods
Cell Culture Experiments
Standard cell culture methods were used and are described in detail in Appendix E1 (online).
Preparation of αvβ3 Integrin-, Endoglin-, and VEGFR2-targeted Contrast Microbubbles
Targeted contrast microbubbles (MBs) were prepared by using standard protocols, as described in detail in Appendix E1 (online).
Flow Chamber Experiments
Binding affinity and specificity of the different MB types to their respective targets were first assessed in cell culture experiments under flow shear stress conditions simulating flow in tumor capillaries by using a flow chamber experimental setup, as detailed in Appendix E1 (online).
Subcutaneous Mouse Tumor Models
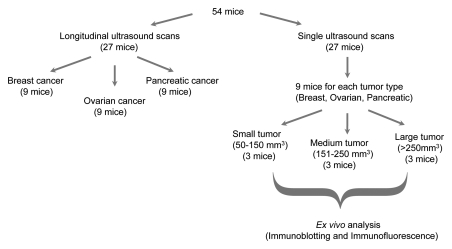
All procedures using laboratory animals were approved by the Institutional Administrative Panel on Laboratory Animal Care. Tumors were established by subcutaneous injection of 5 × 10⁶ human breast, human ovarian, or human pancreatic cancer cells dissolved in 50 μL of matrigel (BD Biosciences, San Jose, Calif) into the right hind limb of 6–8-week-old female nude mice (Charles River, Wilmington, Mass). Tumor volumes were measured daily with B-mode US (volumes were calculated by using the ellipsoid volume equation: 1/6π times width times height times length), and tumors were grouped into three groups according to volume: small (50–150 mm3), medium (151–250 mm3), and large (>250 mm3). For all three tumor types (breast, ovarian, and pancreatic cancer), nine tumors from each group (three small, three medium, three large; total, 27 mice) were scanned with targeted contrast-enhanced US imaging (Fig 1) as described below. All tumors were excised for correlation of in vivo US imaging data with ex vivo expression levels of molecular markers as assessed with immunoblotting (see below) (Fig 1). Nine mice, each bearing either breast, ovarian, or pancreatic cancer (total, 27 mice) were imaged with longitudinal targeted contrast-enhanced US imaging with intraindividual monitoring of expression levels of the three markers using the molecularly targeted contrast-enhanced US imaging approach described below.
Figure 1:
Flow diagram summarizes experimental design of in vivo targeted contrast-enhanced US imaging experiments.
Targeted Contrast-enhanced US Imaging
All mice were kept under anesthesia with 2% isoflurane in room air (2 L/min) during scanning, and all imaging settings were kept constant throughout the imaging sessions. Targeted contrast-enhanced US imaging was performed in the fundamental B mode on a US machine dedicated for small-animal imaging (Vevo 770; VisualSonics, Toronto, Ontario, Canada). Images were collected at a high spatial resolution (lateral and axial resolution of 100 and 40 µm, respectively; focal length, 6 mm; transmit power, 50%; mechanical index, 0.14; dynamic range, 52 dB) with the use of a 40-MHz high-frequency linear transducer (real-time microvisualization-704 scanhead). Central planes of tumors were aligned by measuring the length of the tumor and by placing the transducer at the center of the tumor. For longitudinal studies, images were referenced from previous scans to ensure that the transducer was always placed at approximately the same imaging plane.
In all mice, intra-animal comparisons were performed by injecting all four types of MB into the same animal during the same imaging session. All mice were injected in random order with four boluses of 100 μL saline containing 5 × 10⁷ of the four types of MB via a tail vein (injection time, 2 seconds). To allow MBs to clear from previous injections, we waited at least 30 minutes between different bolus injections (20). After injection of each of the four types of MBs, a US imaging sequence using an MB destruction and replenishment approach was performed as described previously (21,22): 4 minutes after each MB bolus injection, 120 B-mode imaging frames were acquired over a 6-second period. This was followed by an application of a destruction pulse (10 MHz; mechanical index, approximately 0.235) for 3 seconds to destroy all MBs in the field of view. Nine seconds later, 120 frames were acquired again to capture the influx of unbound MBs.
Analysis of Targeted Contrast-enhanced US Imaging Data Sets
Each imaging sequence was analyzed offline on a dedicated workstation using the Vevo 770 high-resolution microultrasound imaging software (VisualSonics). Regions of interest ranging in size between 5 and 54 mm2 and capturing the entire tumors were drawn in random order by one reader (N.D., with 2 years of experience in small-animal targeted contrast-enhanced US image analysis) who was blinded to the type of MB and the type of subcutaneous tumor.
The imaging signal from attached MBs was calculated by averaging pre- and postdestruction imaging signals and subtracting the postdestruction signal average from the predestruction signal, as previously described (23,24). The resulting video intensity was considered to represent MBs adherent to molecular endothelial markers. Images representing the adherent MBs were displayed as a green overlay on the B-mode anatomic images.
Ex Vivo Analysis of Tumor Tissues
Ex vivo analysis of tumor tissue using immunofluorescence and immunoblotting was performed by using standard techniques. Details are provided in Appendix E1 (online).
Statistical Analysis
Data were reported as means ± standard deviations. For flow chamber experiments, a paired Wilcoxon test was used to compare numbers of attached control MBs (MBControl) with those of the three targeted MBs (MBIntegrin, MBEndoglin, and MBVEGFR2), pooled across the two cell lines (SVR and 4T1 cells). A 4 × 2 repeated-measure analysis of variance of log10 was performed on cell attachment rates of MBs, with fixed factors of contrast agents MBIntegrin, MBEndoglin, MBVEGFR2, and MBControl and cell line (SVR and 4T1 cells). Differences in attachment before and after the addition of blocking antibodies were assessed with the paired Wilcoxon test. Spearman rank correlation (ρ values) was determined to correlate levels of marker expression as assessed with flow cytometry with the number of attached MBs obtained from flow chamber experiments. A 4 × 3 × 3 repeated-measure analysis of variance was performed on in vivo US imaging signals in animals imaged with the four types of MBs (MBIntegrin, MBEndoglin, MBVEGFR2, and MBControl), with fixed factors of tumor volume (small, medium, and large), tumor type (breast cancer, ovarian cancer, and pancreatic cancer), and type of MB. Pairwise comparisons among types of MBs were done at each tumor size with the Tukey Honest Significant Difference method to adjust the multiple comparisons for a family-wise error rate of .05. Spearman rank correlation was calculated to correlate in vivo targeted contrast-enhanced US imaging results with ex vivo immunoblotting results for all tumors. All statistical analyses were performed with software (Stata, version 9.2; Stata, College Station, Tex). P < .05 was considered to indicate a statistically significant difference.
Results
Flow Chamber Attachment Experiments
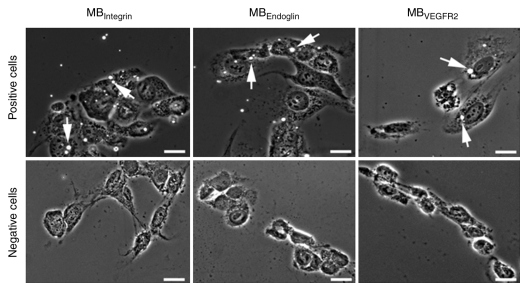
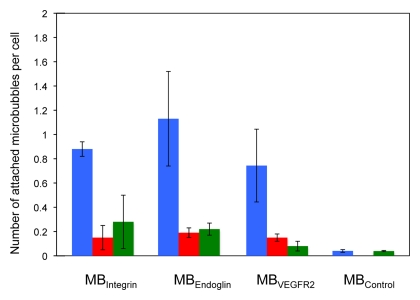
Attachment of all three targeted MBs was significantly (P = .003) higher to positive than to negative control cells (Figs 2, 3). Attachment of MBControl to positive cells was significantly (P = .016) lower compared with the three targeted MBs (Fig 3). Furthermore, preincubating positive cells with respective blocking antibodies resulted in a significant (P = .026) decrease in MB attachment for all three types of targeted MBs (Fig 3), confirming binding specificity of the three types of MBs to their respective molecular targets in cell culture experiments.
Figure 2:
Results of cell culture binding assay of MBs to αvβ3 integrin, endoglin, and VEGFR2 with a parallel plate flow chamber. Phase-contrast bright-field micrographs (original magnification, ×100; scale bars, 20 μm) show binding of MBIntegrin, MBEndoglin, and MBVEGFR2 (arrows) to cells positive for angiogenic marker expression. Note that binding of all three types of targeted MB was substantially higher to positive cells than to negative control cells.
Figure 3:
Bar graph summarizes binding of MBIntegrin, MBEndoglin, MBVEGFR2, and MBControl to positive cells (blue) and negative control cells (red). Binding of targeted MBs to positive cells was substantially decreased following administration of blocking antibodies (green) but did not substantially change for negative control MBControl. Error bars = standard deviations.
In addition, there was a significant overall positive correlation between the number of attached targeted MBs and the expression levels of the angiogenic molecular markers on both cell lines as assessed with flow cytometry (ρ = 0.87, P < .001). This significant positive correlation was also observed individually for each of the three types of targeted MB (MBIntegrin: ρ = 0.87, P = .019; MBEndoglin:ρ = 0.83, P = .042; and MBVEGFR2: ρ = 0.83, P = .042).
Correlation of in Vivo Targeted Contrast-enhanced US Imaging Signal with ex Vivo Expression Levels of αvβ3 Integrin, Endoglin, and VEGFR2
There was good correlation between in vivo US imaging signal and ex vivo expression levels of all three angiogenic markers as assessed with immunoblotting (ρ = 0.65 for αvβ3 integrin [P = .05]; ρ = 0.88 for endoglin [P = .002]; and ρ = 0.63 for VEGFR2 [P = .05]) (Fig 4d). In addition, ex vivo immunofluorescence analysis showed colocalization of all three angiogenic markers with CD31 on tumor endothelial cells (Fig 5), indicating that the in vivo US imaging signal was indeed generated by MBs attaching to angiogenic markers expressed on tumor vascular endothelial cells.
Figure 4d:
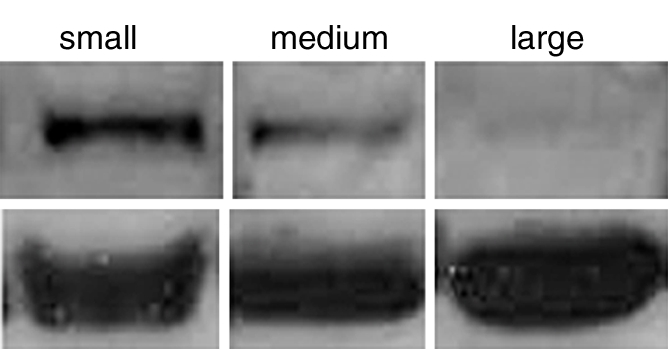
(a–c) Transverse color-coded US images of subcutaneous human ovarian cancer xenograft (scale bar = 1 mm) imaged longitudinally after intravenous administration of MBEndoglin in the same mouse at three tumor stages (a, small; b, medium; c, large). Note that targeted contrast-enhanced US imaging signal (shown as green areas overlaid on B-mode images) was highest in small tumors and decreased as tumors grew larger. (d) Representative immunoblots of ovarian cancer lysates from small, medium, and large tumors show decreasing expression levels as tumors grow larger (upper row). α Tubulin was used as a loading control (lower row).
Figure 5a:
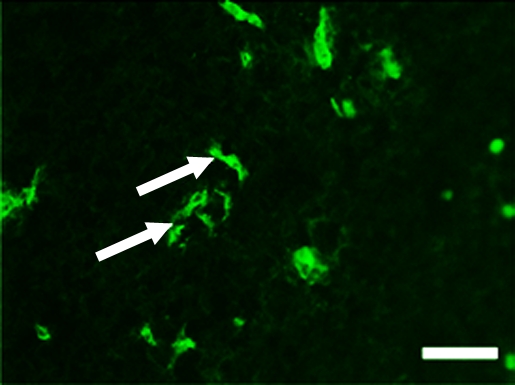
Representative tumor slices from ovarian cancer xenograft confirm endoglin expression on tumor vascular endothelial cells (arrows) by immunofluorescence (scale bar = 100 μm). Tumor slices stained for (a) endothelial cell–specific marker CD31 (green) and (b) endoglin (red). (c) Merged image demonstrates coexpression of endoglin and CD31 (yellow) on tumor endothelial cells.
Figure 4b:
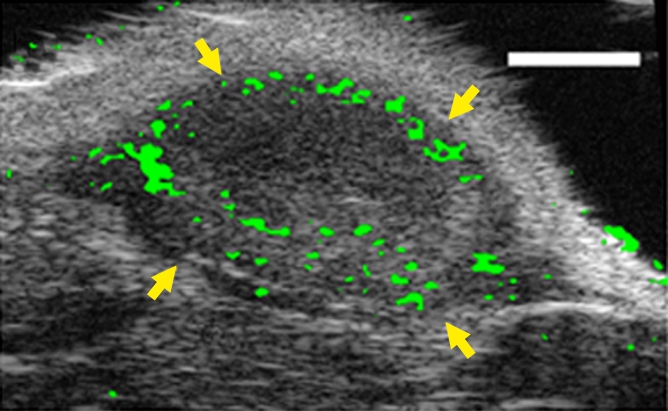
(a–c) Transverse color-coded US images of subcutaneous human ovarian cancer xenograft (scale bar = 1 mm) imaged longitudinally after intravenous administration of MBEndoglin in the same mouse at three tumor stages (a, small; b, medium; c, large). Note that targeted contrast-enhanced US imaging signal (shown as green areas overlaid on B-mode images) was highest in small tumors and decreased as tumors grew larger. (d) Representative immunoblots of ovarian cancer lysates from small, medium, and large tumors show decreasing expression levels as tumors grow larger (upper row). α Tubulin was used as a loading control (lower row).
Figure 5b:
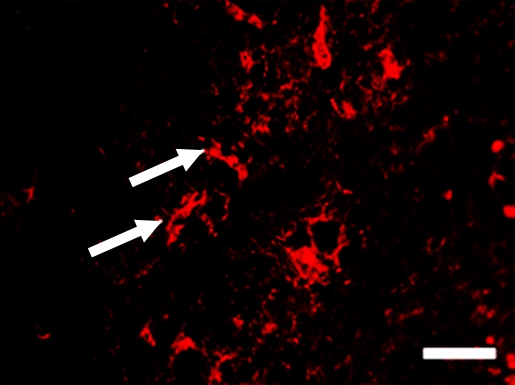
Representative tumor slices from ovarian cancer xenograft confirm endoglin expression on tumor vascular endothelial cells (arrows) by immunofluorescence (scale bar = 100 μm). Tumor slices stained for (a) endothelial cell–specific marker CD31 (green) and (b) endoglin (red). (c) Merged image demonstrates coexpression of endoglin and CD31 (yellow) on tumor endothelial cells.
Figure 5c:
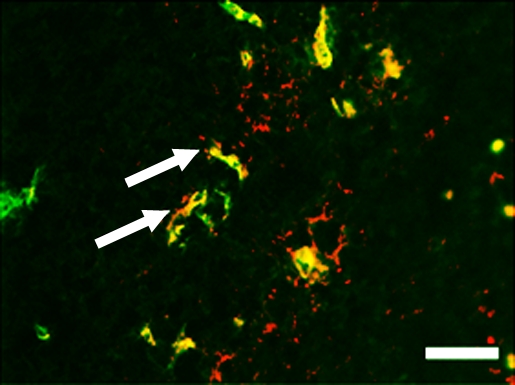
Representative tumor slices from ovarian cancer xenograft confirm endoglin expression on tumor vascular endothelial cells (arrows) by immunofluorescence (scale bar = 100 μm). Tumor slices stained for (a) endothelial cell–specific marker CD31 (green) and (b) endoglin (red). (c) Merged image demonstrates coexpression of endoglin and CD31 (yellow) on tumor endothelial cells.
Longitudinal Assessment of Tumor Angiogenic Marker Expression Levels
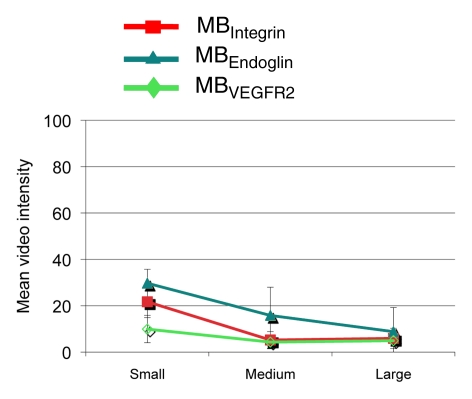
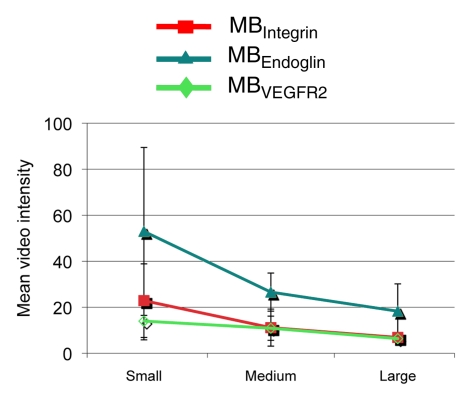
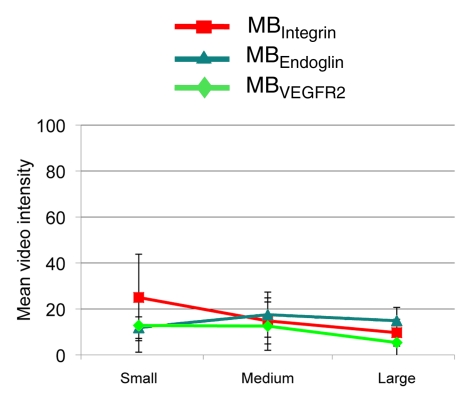
Figure 6 summarizes the intraindividual targeted contrast-enhanced US imaging signals for the three angiogenic markers obtained in breast, ovarian, and pancreatic cancer xenografts in the same mice at three tumor stages (small, medium, and large). Absolute and relative expression levels of the three angiogenic markers varied among the three tumor types and for different tumor stages. The imaging signal following administration of the three types of targeted MB was significantly (P = .002) higher compared with MBControl.
Figure 6a:
(a–c) Line graphs summarize mean targeted contrast-enhanced US imaging signal intensities from longitudinal US scanning experiments in subcutaneous (a) breast, (b) ovarian, and (c) pancreatic cancer xenografts in mice obtained by using MBIntegrin (red), MBEndoglin (teal), and MBVEGFR2 (green). Absolute and relative US imaging signals were different among different tumor types and different MB types. Error bars = standard deviations.
Figure 6b:
(a–c) Line graphs summarize mean targeted contrast-enhanced US imaging signal intensities from longitudinal US scanning experiments in subcutaneous (a) breast, (b) ovarian, and (c) pancreatic cancer xenografts in mice obtained by using MBIntegrin (red), MBEndoglin (teal), and MBVEGFR2 (green). Absolute and relative US imaging signals were different among different tumor types and different MB types. Error bars = standard deviations.
Figure 6c:
(a–c) Line graphs summarize mean targeted contrast-enhanced US imaging signal intensities from longitudinal US scanning experiments in subcutaneous (a) breast, (b) ovarian, and (c) pancreatic cancer xenografts in mice obtained by using MBIntegrin (red), MBEndoglin (teal), and MBVEGFR2 (green). Absolute and relative US imaging signals were different among different tumor types and different MB types. Error bars = standard deviations.
Breast cancer xenografts.—In small and medium breast cancer xenografts, expression of endoglin was significantly higher (P ≤ .04) compared with both αvβ3 integrin and VEGFR2, and expression levels of αvβ3 integrin versus VEGFR2 were not significantly different (P ≥ .07) in small and medium breast cancer tumors (Table). In large tumors, expression of all three markers was not significantly different (P ≥ .80).
P Values from Pairwise Comparisons of Imaging Signals Obtained by Using Three Types of Targeted MBs in Breast, Ovarian, and Pancreatic Cancers at Three Tumor Sizes
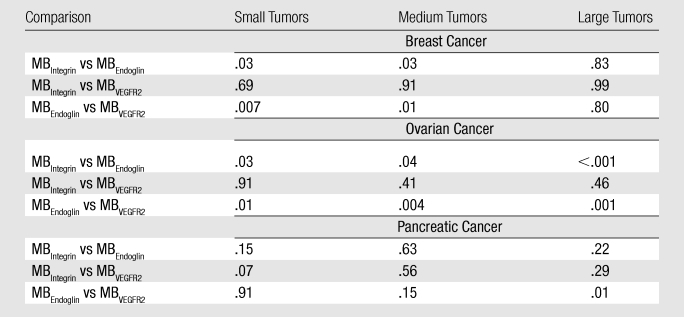
Ovarian cancer xenografts.—Endoglin expression (Fig 4a–4c) was significantly higher (P ≤ .04) than both αvβ3 integrin and VEGFR2 expression in small, medium, and large ovarian cancer xenografts. Expression levels of αvβ3 integrin compared with VEGFR2 were not significantly different (P ≥ .40) for any tumor size (Table).
Figure 4a:
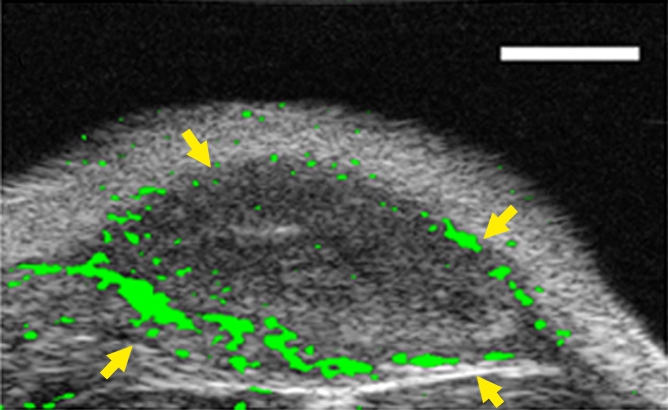
(a–c) Transverse color-coded US images of subcutaneous human ovarian cancer xenograft (scale bar = 1 mm) imaged longitudinally after intravenous administration of MBEndoglin in the same mouse at three tumor stages (a, small; b, medium; c, large). Note that targeted contrast-enhanced US imaging signal (shown as green areas overlaid on B-mode images) was highest in small tumors and decreased as tumors grew larger. (d) Representative immunoblots of ovarian cancer lysates from small, medium, and large tumors show decreasing expression levels as tumors grow larger (upper row). α Tubulin was used as a loading control (lower row).
Figure 4c:
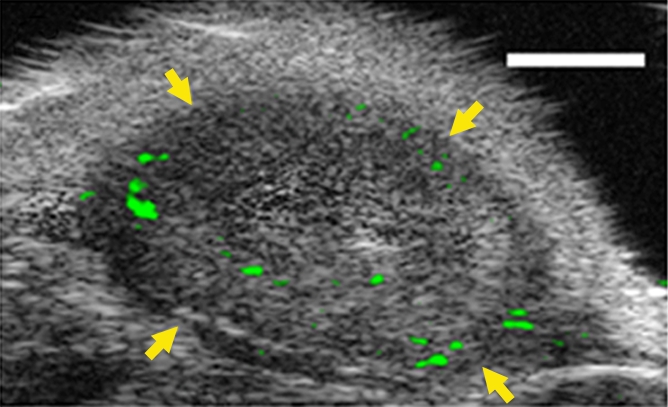
(a–c) Transverse color-coded US images of subcutaneous human ovarian cancer xenograft (scale bar = 1 mm) imaged longitudinally after intravenous administration of MBEndoglin in the same mouse at three tumor stages (a, small; b, medium; c, large). Note that targeted contrast-enhanced US imaging signal (shown as green areas overlaid on B-mode images) was highest in small tumors and decreased as tumors grew larger. (d) Representative immunoblots of ovarian cancer lysates from small, medium, and large tumors show decreasing expression levels as tumors grow larger (upper row). α Tubulin was used as a loading control (lower row).
Pancreatic cancer xenografts.—In pancreatic cancer xenografts, average expression of αvβ3 integrin was highest in small tumors but did not reach statistical significance compared with endoglin (P = .15) and VEGFR2 expression (P = .07). Expression of the three angiogenic markers was also not significantly different in medium-size pancreatic xenografts (Table). At large tumor sizes, endoglin expression was significantly higher (P = .01) compared with VEGFR2 but not compared with αvβ3 integrin (P = .23).
Discussion
Tumor angiogenesis is one of the hallmarks of cancer and is present early during the development and growth of different solid tumors, including breast, ovarian, and pancreatic cancers (6–10). Imaging the presence of tumor angiogenesis in early cancer by using highly sensitive and specific molecular imaging is a promising approach under investigation for early cancer detection. Targeted contrast-enhanced US is particularly attractive for this purpose, because it is relatively inexpensive (eg, compared with magnetic resonance imaging or positron emission tomography [PET]); it offers real-time contrast imaging; it allows relatively deep tissue penetration (eg, compared with optical imaging approaches); and it does not involve the use of ionizing irradiation, thus allowing multiple repetitive imaging examinations (eg, compared with computed tomography, PET, or single photon emission computed tomography). Furthermore, it is a widely available imaging technology worldwide. Since current contrast MBs used for targeted contrast-enhanced US imaging bind only to molecular markers that are present on vascular endothelial cells, this imaging approach has great potential for detection of early cancer tumor angiogenesis without confounding (background) imaging signals from MBs possibly binding to targets outside the tumor vasculature. The imaging signal and thus the conspicuity of small early stage tumors that just switched from the dormant to the angiogenic phase strongly depends on the number of contrast MBs that actually attach to the molecular targets following intravenous administration. Conversely, the number of attached MBs depends on various factors, including the extent of tumor vascularization, physical forces that translate the freely circulating contrast MBs to the vessel wall, and the affinity of the binding ligand to the molecular target, as well as the expression level of the molecular targets on tumor vessels (25). Therefore, knowing the temporal expression levels of different angiogenic markers that could be used as possible targets for contrast-enhanced US imaging is of great importance in both choosing the most promising molecular imaging target(s) and designing contrast agents to be used for early detection. The goal of this proof-of-principle study, therefore, was to evaluate the expression levels of three well-described tumor angiogenic markers during the growth of three solid tumors—breast, ovarian, and pancreatic cancer—and to evaluate whether targeted contrast-enhanced US allows assessment of the three markers noninvasively.
In our study, cell culture experiments performed under flow shear stress conditions, using negative control cells and blocking antibodies, confirmed binding specificity of all three targeted contrast MBs to their respective targets, including αvβ3 integrin, endoglin, and VEGFR2. Furthermore, the attachment of the different targeted MBs under flow shear stress conditions substantially correlated with the expression levels of the respective targets on the surface of the cells in cell culture experiments. Similarly, in vivo binding of the three targeted MBs was substantially higher compared with control MBs, suggesting that the contrast MBs prepared for the purpose of our study can be used for imaging expression levels of tumor angiogenic markers.
We then tested whether targeted contrast-enhanced US imaging allows assessment of varying tumor angiogenic marker expression levels by correlating in vivo US imaging signals of the injected targeted MBs with results from ex vivo immunoblotting analysis. Substantial positive correlation between the two suggested that targeted contrast-enhanced US imaging may be used to monitor expression levels of angiogenic markers noninvasively. This was further explored in our intraindividual longitudinal imaging experiments, demonstrating that expression levels of the three angiogenic markers under consideration substantially varied in the three tumor types and at different stages of tumor growth.
It is well accepted that survival and morbidity of patients with breast, ovarian, or pancreatic cancer largely depends on the tumor stage, with patients receiving a diagnosis at earlier tumor stages showing substantially higher 5-year survival rates than patients diagnosed at later time points during cancer development. For example, in patients with pancreatic adenocarcinoma, 5-year survival rates improve from approximately 1% to about 37% when the cancer is detected at stage I instead of stage IV (26). Similarly, survival of patients with ovarian or breast cancer substantially improves when the cancer is detected at earlier stages. Since US is among the first-line imaging modalities in patients suspected of having breast, ovarian, or pancreatic cancer, our study lays the foundation for developing targeted contrast-enhanced US imaging strategies that are targeted to molecular markers specifically expressed at early stages of tumor development. Our results suggest that endoglin appears to be a promising target for early stage breast and ovarian cancer imaging, whereas all markers could be potential targets for imaging early pancreatic cancer in our animal models. We acknowledge, however, that the expression profiles may vary substantially in different tumor animal models. Also, the use of matrigel as a medium to dissolve tumor cells before injection into mice may have stimulated tumor angiogenesis in our experiments and influenced the expression levels of the three markers in our cancer models. Furthermore, expression levels of molecular angiogenic markers may be different in other animal models of cancer such as orthotopic or transgenic models and may show different profiles in patients with cancer.
The following limitations of our study need to be addressed. First, the small-animal Vevo770 US system for dedicated small-animal imaging available for our study operates on B-mode imaging for contrast agent detection, and tissue-echo cancellation is accomplished by subtracting the baseline tissue image signal from the image signal obtained after administration of contrast MBs. Therefore, only a marginal MB signal differential over the baseline images may be observed in our study in case of attachment of a small amount of MBs, and a fraction of the MBs might not have been detected with this US system. Furthermore, the dedicated US imaging system used in our study operates on B-mode images generated after log compression, resulting in a contrast signal that cannot be quantified in a linear manner. These technical shortcomings limit quantitative values obtained in this study. Since our study has been completed, a newer generation linear array–based dedicated small-animal US system has become available (Vevo 2100) that is capable of operating in a contrast-specific imaging mode with image signals that are not compressed for quantification. This system utilizes nonlinear properties of MBs for segmenting them from tissue by using a pulse-sequencing approach based on amplitude modulation. This results in improved detection of small quantities of MBs and image signals that are linearly proportional to MB concentration (27). Future studies are needed to test targeted contrast-enhanced US for longitudinal profiling of angiogenic marker expressions using this last-generation dedicated small-animal US system. Finally, we measured molecular marker expression only in the limited field of view of the two-dimensional US beam elevation, which may not take into account possible asymmetric molecular marker expression along the entire tumor volume (eg, parts of viable vs necrotic tumor tissue). Although we made every effort to approximately image tumors in similar imaging planes in longitudinal imaging experiments, three-dimensional targeted contrast-enhanced US imaging approaches are needed to aid in reproducible longitudinal quantification of molecular marker expression.
In conclusion, the results of our study suggest that expression levels of different tumor angiogenic markers vary during tumor growth in subcutaneous human breast, ovarian, and pancreatic cancer xenografts in mice and that targeted contrast-enhanced US imaging allows longitudinal noninvasive assessment of the temporal tumor angiogenic molecular marker expression levels in vivo. The results provide further insights into the biology of tumor angiogenesis and may help in defining promising imaging targets for both early cancer detection and treatment monitoring of cancer using targeted contrast-enhanced US imaging.
Advances in Knowledge.
Targeted contrast-enhanced US imaging allows longitudinal assessment and monitoring of expression levels of αvβ3 integrin, endoglin, and vascular endothelial growth factor receptor (VEGFR) 2 during tumor growth of subcutaneous breast, ovarian, and pancreatic cancer xenografts in mice.
There is good correlation between in vivo targeted contrast-enhanced US imaging signal and ex vivo immunoblotting regarding expression levels of αvβ3 integrin (ρ = 0.65), endoglin (ρ = 0.88), and VEGFR2 (ρ = 0.63).
Expression levels of different molecular angiogenic markers vary among subcutaneous breast, ovarian, and pancreatic cancer xenografts in mice and change at different tumor stages (small, medium, and large).
Disclosures of Potential Conflicts of Interest: N.D. No potential conflicts of interest to disclose. Y.R. No potential conflicts of interest to disclose. K.F. No potential conflicts of interest to disclose. J.R. No potential conflicts of interest to disclose. J.K.W. No potential conflicts of interest to disclose.
Received May 28, 2010; revision requested July 9; revision received August 18; accepted September 8; final version accepted September 28.
Funding: This research was supported by the National Institutes of Health (grant NIH R21 CA139279).
J.K.W. supported by the RSNA Seed Grant RSD0809, the Howard S. Stern Research Grant of the Society of Gastrointestinal Radiologists, the National Pancreas Foundation, and the Canary Foundation.
See also Science to Practice in this issue.
Abbreviations:
- MB
- microbubble
- VEGF
- vascular endothelial growth factor
- VEGFR
- VEGF receptor
References
- 1.Bergers G, Benjamin LE. Tumorigenesis and the angiogenic switch. Nat Rev Cancer 2003;3(6):401–410 [DOI] [PubMed] [Google Scholar]
- 2.Palmowski M, Huppert J, Ladewig G, et al. Molecular profiling of angiogenesis with targeted ultrasound imaging: early assessment of antiangiogenic therapy effects. Mol Cancer Ther 2008;7(1):101–109 [DOI] [PubMed] [Google Scholar]
- 3.Hodivala-Dilke K. alphavbeta3 integrin and angiogenesis: a moody integrin in a changing environment. Curr Opin Cell Biol 2008;20(5):514–519 [DOI] [PubMed] [Google Scholar]
- 4.ten Dijke P, Goumans MJ, Pardali E. Endoglin in angiogenesis and vascular diseases. Angiogenesis 2008;11(1):79–89 [DOI] [PubMed] [Google Scholar]
- 5.Ferrara N. Vascular endothelial growth factor: basic science and clinical progress. Endocr Rev 2004;25(4):581–611 [DOI] [PubMed] [Google Scholar]
- 6.Sledge GW, Jr, Rugo HS, Burstein HJ. The role of angiogenesis inhibition in the treatment of breast cancer. Clin Adv Hematol Oncol 2006;4(10 suppl 21):1–10; quiz 11–12 [PubMed] [Google Scholar]
- 7.Khosravi Shahi P, Soria Lovelle A, Pérez Manga G. Tumoral angiogenesis and breast cancer. Clin Transl Oncol 2009;11(3):138–142 [DOI] [PubMed] [Google Scholar]
- 8.Gómez-Raposo C, Mendiola M, Barriuso J, Casado E, Hardisson D, Redondo A. Angiogenesis and ovarian cancer. Clin Transl Oncol 2009;11(9):564–571 [DOI] [PubMed] [Google Scholar]
- 9.Bednarek W, Mazurek M, Cwiklińska A, Barczyński B. Expression of selected angiogenesis markers and modulators in pre-, peri- and postmenopausal women with ovarian cancer [in Polish]. Ginekol Pol 2009;80(2):93–98 [PubMed] [Google Scholar]
- 10.Saif MW. Anti-angiogenesis therapy in pancreatic carcinoma. JOP 2006;7(2):163–173 [PubMed] [Google Scholar]
- 11.Hood JD, Cheresh DA. Role of integrins in cell invasion and migration. Nat Rev Cancer 2002;2(2):91–100 [DOI] [PubMed] [Google Scholar]
- 12.van der Flier A, Sonnenberg A. Function and interactions of integrins. Cell Tissue Res 2001;305(3):285–298 [DOI] [PubMed] [Google Scholar]
- 13.Fonsatti E, Altomonte M, Arslan P, Maio M. Endoglin (CD105): a target for anti-angiogenetic cancer therapy. Curr Drug Targets 2003;4(4):291–296 [DOI] [PubMed] [Google Scholar]
- 14.Bernabeu C, Lopez-Novoa JM, Quintanilla M. The emerging role of TGF-beta superfamily coreceptors in cancer. Biochim Biophys Acta 2009;1792(10):954–973 [DOI] [PubMed] [Google Scholar]
- 15.Hicklin DJ, Ellis LM. Role of the vascular endothelial growth factor pathway in tumor growth and angiogenesis. J Clin Oncol 2005;23(5):1011–1027 [DOI] [PubMed] [Google Scholar]
- 16.Lindner JR. Microbubbles in medical imaging: current applications and future directions. Nat Rev Drug Discov 2004;3(6):527–532 [DOI] [PubMed] [Google Scholar]
- 17.Willmann JK, van Bruggen N, Dinkelborg LM, Gambhir SS. Molecular imaging in drug development. Nat Rev Drug Discov 2008;7(7):591–607 [DOI] [PubMed] [Google Scholar]
- 18.Pysz MA, Foygel K, Rosenberg J, Gambhir SS, Schneider M, Willmann JK. Antiangiogenic cancer therapy: monitoring with molecular US and a clinically translatable contrast agent (BR55). Radiology 2010;256(2):519–527 [DOI] [PMC free article] [PubMed] [Google Scholar]
- 19.Klibanov AL. Ligand-carrying gas-filled microbubbles: ultrasound contrast agents for targeted molecular imaging. Bioconjug Chem 2005;16(1):9–17 [DOI] [PubMed] [Google Scholar]
- 20.Willmann JK, Cheng Z, Davis C, et al. Targeted microbubbles for imaging tumor angiogenesis: assessment of whole-body biodistribution with dynamic micro-PET in mice. Radiology 2008;249(1):212–219 [DOI] [PMC free article] [PubMed] [Google Scholar]
- 21.Ellegala DB, Leong-Poi H, Carpenter JE, et al. Imaging tumor angiogenesis with contrast ultrasound and microbubbles targeted to alpha(v)beta3. Circulation 2003;108(3):336–341 [DOI] [PubMed] [Google Scholar]
- 22.Rychak JJ, Graba J, Cheung AM, et al. Microultrasound molecular imaging of vascular endothelial growth factor receptor 2 in a mouse model of tumor angiogenesis. Mol Imaging 2007;6(5):289–296 [PubMed] [Google Scholar]
- 23.Willmann JK, Paulmurugan R, Chen K, et al. US imaging of tumor angiogenesis with microbubbles targeted to vascular endothelial growth factor receptor type 2 in mice. Radiology 2008;246(2):508–518 [DOI] [PMC free article] [PubMed] [Google Scholar]
- 24.Willmann JK, Lutz AM, Paulmurugan R, et al. Dual-targeted contrast agent for US assessment of tumor angiogenesis in vivo. Radiology 2008;248(3):936–944 [DOI] [PMC free article] [PubMed] [Google Scholar]
- 25.Willmann JK, Kimura RH, Deshpande N, Lutz AM, Cochran JR, Gambhir SS. Targeted contrast-enhanced ultrasound imaging of tumor angiogenesis with contrast microbubbles conjugated to integrin-binding knottin peptides. J Nucl Med 2010;51(3):433–440 [DOI] [PMC free article] [PubMed] [Google Scholar]
- 26.Smeenk HG, Tran TC, Erdmann J, van Eijck CH, Jeekel J. Survival after surgical management of pancreatic adenocarcinoma: does curative and radical surgery truly exist? Langenbecks Arch Surg 2005;390(2):94–103 [DOI] [PubMed] [Google Scholar]
- 27.Needles A, Mehi J, Bilan C, et al. Nonlinear molecular imaging with a linear array based micro-ultrasound system. Presented at the 2009 World Molecular Imaging Conference, Montreal, Canada, 2009 [Google Scholar]


