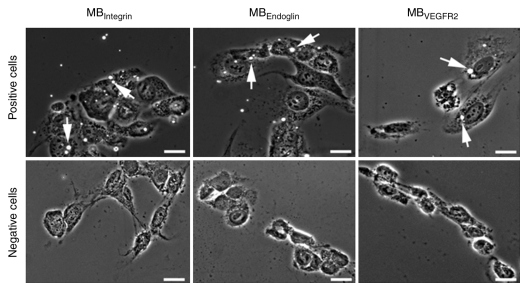
Figure 2:
Results of cell culture binding assay of MBs to αvβ3 integrin, endoglin, and VEGFR2 with a parallel plate flow chamber. Phase-contrast bright-field micrographs (original magnification, ×100; scale bars, 20 μm) show binding of MBIntegrin, MBEndoglin, and MBVEGFR2 (arrows) to cells positive for angiogenic marker expression. Note that binding of all three types of targeted MB was substantially higher to positive cells than to negative control cells.

