

Abstract
We assessed a pilot project by UNICEF and Hindustan Unilever Limited to improve the quality of drinking water for children in schools through adoption of improved drinking water practices among households in southern India. The intervention consisted of providing classrooms of 200 schools a commercial water purifier, and providing basic hygiene and water treatment information to students, parents, and teachers. We found no evidence that the intervention was effective in improving awareness or uptake of effective water treatment practices at home. A similar proportion of household members in the intervention and control groups boiled their water (P = 0.60), used a ceramic filtration system (P = 0.33), and used a cloth filter (P = 0.89). One year after the launch of the campaign, household ownership of the commercial purifier promoted at schools was higher in the intervention group (26%) than the control group (19%), but this difference was not statistically significant (P = 0.53).
Introduction
The World Health Organization (WHO) estimates that improving water, sanitation, and hygiene could prevent at least 9.1% of the global burden of disease and 6.3% of all deaths.1 Diarrhea represents a significant share of this burden, causing an estimated 4 billion cases and 1.9 million deaths each year of children < 5 years of age, or 19% of all such deaths in developing countries.2 With over 386,000 deaths attributable to diarrheal diseases per year, India ranks first among countries contributing to this worldwide disease burden.
Although 84% of Indians have access to improved water supply, only 22% have household taps, so that most of the population must collect, transport, and store water in the home.3 Even water that is safe at the point of distribution is subject to frequent and substantial contamination during collection, transport, and storage.4 Point-of-use (POU) water treatment, combined with safe storage, is one option for improving the quality of drinking water and reducing the burden of diarrheal disease burden.5 The WHO and United Nations Children's Fund (UNICEF) recommend POU water treatment as part of an overall strategy for the prevention of diarrheal disease among young children.6,7
Promotion of POU products in schools has shown success in reducing diarrheal disease8 and absenteeism9,10 among school children in rural Western Kenya. In countries with free primary education, schools may be a way to reach poorer and more marginalized populations with health messages. Children can be effective promoters of health messages, specifically water, sanitation, and hygiene messages,11 but like all promotional campaigns, success may depend on effective messaging and the appeal of the product to be promoted.12 However, promotion in schools should be tailored to children with specific tasks to promote peer-to-peer learning and diffusion to households.13–15
In September 2007, UNICEF and Hindustan Lever Limited (HUL) collaborated in a pilot study among 200 schools in Krishnigiri District of Tamil Nadu, India designed to provide safe drinking water to children in school while increasing awareness and adoption of effective POU water treatment at home. The intervention consisted of 1) placing a Pureit brand water purification system (HUL) in classrooms, and 2) providing basic instruction to students, parents, and teachers on waterborne diseases and generic information on effective POU water treatment (boiling, chlorination, filtration, solar disinfection, and safe storage). By providing the device to schools, it was hoped that parents would be exposed to the intervention without having to commit to purchasing the device, drawing on key aspects of diffusion of innovations theory, particularly by increasing the visibility of the innovation and allowing it to be experimented with before adoption.12 We were engaged to assess the pilot.
Methods
Setting.
The pilot was undertaken among 200 primary and middle schools and anganwadis (nurseries) in the Krishnigiri and Bargur Administrative Blocks of Krishnigiri District, Tamil Nadu, India. UNICEF selected the catchment area, in part because of concerns about safe drinking water and other environmental risks of diarrheal diseases.16 In addition to the pilot program described below, the study setting was exposed to commercial activities, including radio and billboard advertising and a microfinance campaign described below, undertaken in India to promote awareness and adoption of the filter used in the intervention.
Pilot program.
Over a period of 12 days between December 2007 and January 2008, HUL technicians visited each of the intervention schools to install the purifiers in or just outside the classrooms, with a distribution of 1 device per 50 students. The purifier, which has been described elsewhere,17 is a gravity-based water treatment system designed for use in settings without reliable water pressure or electric power. The purifier includes a “battery” of consumables (pre-filter, carbon block, chlorine, and granular activated chlorine) designed to be replaced after treating 1,500 L. The device was supplied with one replacement set of consumables, and classrooms were responsible to organize parents to purchase additional sets. Teachers at each intervention school and Panchayat (town) Presidents from surrounding communities attended a one-day training conducted by UNICEF on water treatment and handling practices. Head teachers at each school were asked to promote safe water messages among teachers and students, organize a rally to promote awareness of the program, and supervise use of the filters at the school. As part of the training, each teacher was provided generic safe water materials to introduce the concept of safe water treatment and handling practices. Topics covered in the training and safe water booklet include causes of fecal contamination of water, diseases spread because of contaminated water, and safe water handling methods. Methods of water disinfection discussed included boiling, chlorination, and solar disinfection as well as advantages and disadvantages for each method.
Integrated village development project (IDVP) campaign.
Independent from the pilot, HUL undertook a separate program to support the distribution of purifiers in the study community by IVDP, a microfinance institution (MFI). Under this program, IDVP extends credit to women's self-help groups that can be used, among other things, to acquire purifiers at subsidized prices. The IDVP campaign was extended only to women who were members of the IVDP self-help groups. These trainings were provided to members at self-help group meetings by HUL staff and included education on the benefits of safe water, discussion of Pureit, and a product demonstration. Individual members were free to use their loans to purchase the product. Through September 2009, IVDP had sold 46,000 units throughout the study area, though promotion was not homogeneous in all villages. HUL also began promotion of branded purifiers through radio advertising and billboards.
Assessment design and participant selection.
Seventy-two middle and primary schools, stratified evenly between Krishnigiri and Bargur Administrative Blocks, were included in a trial to assess the pilot program. Primary schools from each block were randomly selected to be intervention schools. To control for potential confounding associated with socio-economic status (SES), climate, and unknown confounders, control schools within the same administrative location were randomly selected as controls. There were 56 primary schools and 16 middle schools included in the baseline sample. Although a baseline survey was attempted by a professional data collection agency, there were irreparable problems with linking cluster-level identifiers at baseline; as such, we are relying here on randomization to render the study arms equivalent in all material respects.18 Surveys were conducted during a follow-up conducted in February 2009, 12 months after the intervention. To avoid misclassification, 11 (15%) of the schools initially enrolled in the study were not included in the followed up end-line survey because they either were intervention schools that did not receive the intervention or control schools that did receive the intervention (Figure 1).
Figure 1.
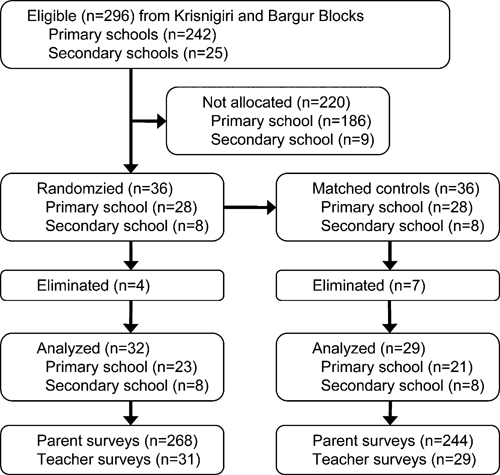
School selection.
Sample size.
The sample size was calculated assuming a 15% acquisition of filters in the unexposed communities (from a negligible amount at baseline) and expected a difference of 10%. We assumed an intra-cluster correlation of 0.05. At each school, pupils were randomly selected from class rosters. Parents of selected pupils were visited at their homes to be interviewed, with preference given to the female head of household. A total of 517 parents were interviewed.
Data collection.
Interviews consisted of completing prescribed surveys in which questions were read to the interviewees in Tamil by the data collector. Question topics included knowledge, attitudes, and practices relating to water supply, water treatment, sanitation, and hygiene at school and home. Surveys were originally developed in English, piloted and reverse translated for quality control purposes. Survey data was collected on paper surveys, entered into an electronic database using Microsoft Excel 2007 (Redmond, WA), and analyzed using SAS version 9.2 (SAS Institute, Cary, NC) and STATA version 10 (College Station, TX).
Data analysis.
SES was calculated using principal component analysis (PCA) based on indicators taken from the 1999 India Demographic and Health Survey.19–21 Water and sanitation variables were excluded from the asset index so that they could be modeled individually. Using the factor score generated from PCA, the population was put into wealth terciles. The first principal analysis explained 16.8% of the variance. Education levels were categorized using at least some secondary school and some/completed primary school, using no education as the referent. Statistical significance for univariate and bivariate data was calculated using a chi-square (χ2) test with one degree of freedom unless otherwise noted. The Cochran-Armitage test for trend and Fisher's exact test were used as appropriate. Significance was assessed at the α = 0.05 level and incorporated variance estimations accounting for the clustered study design. For multivariable analysis, outcomes of interest were assessed using mixed effects models generated using the xtlogit procedure in STATA; standard errors are adjusted to account for clustering at the school level.22 The design variables included in the model were intervention status and school type (middle versus primary schools). Covariates of interest and confounding variables—SES, membership in a self-help group, education status of female head of household, male head of household education status, having children < 5 years of age in the household, and toilet in compound—were determined a priori to data analysis and modeled with intervention status. Potential interaction and effect modification were assessed for all covariates. Because of issues of compatibility between tools and data collection protocols, baseline data were used only for descriptive purposes and were not included in the multivariable models.
Ethics.
Prospective study participants were provided details about the study, advised that their participation was completely voluntary and anonymous, and asked to consent to the study before undertaking the surveys. Although the study was an evaluation of a government-authorized program and therefore exempt from Indian ethics approval, the investigators applied for and obtained approval for the study by the ethics committee of the London School of Hygiene and Tropical Medicine and institutional ethics committee of HUL.
Results
Demographics, water, and sanitation facilities.
Table 1 provides information on the participating schools, households, and students at follow-up. None of the differences between intervention and control groups was significant at the α = 0.05 level. Households from the control and intervention group were statistically similar on key demographic variables such as SES, education level, and household size.
Table 1.
School and household demographics
| School variables* | Intervention | Control |
|---|---|---|
| N = 32 | N = 29 | |
| Number of schools (primary/middle) | 24/8 | 21/8 |
| Mean number of pupils (SD) | 120 (85) | 144 (130) |
| Water source is protected (%) | 32 (100) | 28 (97) |
| Water is avail throughout year (%) | 28 (87) | 20 (83) |
| Mean liters provided per child per day (SD) | 1.0 (0.9) | 1.1 (0.7) |
| Mean number of latrines (SD) | 1.9 (1.5) | 1.8 (1.5) |
| Mean number of urinals (SD) | 2.4 (2.3) | 1.8 (1.8) |
| Use purifier (%) | 31 (97) | 0 (0) |
| Median number of filters (range) | 2 (0–8) | – |
| Median number with water (range) | 2 (0–4) | – |
| Median number broken filters (range) | 2 (0–4) | – |
| Number of filters working (%) | 26 (81) | – |
| Number of schools purchased replacement batteries (%) | 23 (71) | – |
| Mean replacement batteries purchased (SD) | 1.6 (1.7) | – |
| Household variables* | N = 258 | N = 244 |
| Age of respondent (mean) | 32 (7) | 32 (6) |
| Respondent is female head of household (%) | 231 (86) | 215 (88) |
| In lowest socio-economic tercile (%) | 91 (34) | 78 (32) |
| In highest socio-economic tercile (%) | 89 (33) | 83 (34) |
| Male head of household at least some education (%) | 196 (73) | 170 (70) |
| Female head of household at least some education (%) | 165 (62) | 132 (54) |
| Mean family size (SD) | 4.9 (1.4) | 5.1 (1.5) |
| At least one child < 5 years of age (%) | 61 (23) | 132 (54) |
| Mean number of children < 5 (%) | 0.3 (0.5) | 0.3 (0.6) |
| Main water source is protected (%) | 266 (99) | 64 (26) |
| Mean no. liters of water used yesterday (SD) | 25 (11) | 25 (8) |
Data are presented either as the number (%) of responses or the mean (standard deviation) unless otherwise indicated.
World Bank and World Health Organization Joint Monitoring Program definitions: www.jmp.org.
Purifier use and battery replacement in schools.
Intervention schools were provided a mean of 3.6 purifiers (range 1–8). On the basis of observation at the school, 84 (88%) of the filters provided were still working at the time of follow-up and 74 (78%) were filled with water at the time of the site visit (Table 1). Assuming that each student drinks 500 mL to 1 L during the 5 hours/day in school,6 and the school year is 180 days, then the consumables in each purifier would need to be replaced three to six times per year based on the student population. We found that in the 12 months before our survey, just 71% of schools had replaced their consumables after the initial set supplied with the purifier and no school had replaced the batteries more than once.
Safe water awareness.
We assessed the knowledge of safe water by asking respondents to list the factors they associate with safe water (Table 2). Over 95% of respondents said that safe water looked clear. More households in the intervention group listed safe water as being free from germs (89% versus 80%, P = 0.07) and that it would not make people sick (61% versus 50%, P = 0.23) as compared with the control communities. Alternatively, respondents in control communities were more likely to say that safe water does not have a smell (12% versus 22% P = 0.14) or tastes good (6% versus 19%, P = 0.04) as compared with intervention households. However, only the difference in taste was significant at the α = 0.05 level.
Table 2.
Adoption, awareness, and affinity of point-of-use (POU) water treatment
| Intervention (%) N = 271 | Control (%) N = 246 | P | |
|---|---|---|---|
| Households treat water for drinking | 122 (45) | 115 (47) | |
| Boil | 60 (22) | 61 (25) | 0.60 |
| Use cloth filter (at source or home) | 59 (22) | 49 (20) | 0.33 |
| Use other filters (candle, ceramic, Pureit) | 64 (24) | 39 (16) | 0.89 |
| What do you understand by “safe water” | |||
| Water looks clear | 258 (95) | 236 (96) | 0.46 |
| Water is free of germs | 240 (89) | 197 (80) | 0.07 |
| Will not make people sick | 164 (61) | 123 (50) | 0.23 |
| There is no dirt in water | 97 (36) | 110 (45) | 0.59 |
| Water does not smell | 33 (12) | 54 (22) | 0.14 |
| Water tastes good | 17 (6) | 46 (19) | 0.04 |
| There are no chemicals | 4 (2) | 8 (3) | 0.76 |
| Pureit | |||
| Heard of Pureit | 244 (90) | 216 (88) | 0.71 |
| From child | 61 (22) | 18 (7) | 0.002 |
| From child's teacher | 141 (52) | 23 (9) | < 0.001 |
| From self-help group | 195 (72) | 177 (72) | 0.84 |
| Family or friends | 141 (52) | 168 (68) | 0.001 |
| Radio | 6 (2) | 25 (10) | 0.60 |
| Primary message from child or teacher | 59 (25) | 7 (3) | < 0.001 |
| Pureit Ownership | 59 (26) | 46 (19) | 0.53 |
| Purchased from MFI/SHG (among adopters) | 59 (100) | 42 (91) | 0.03 |
| Among non-adopters | N = 182 | N = 168 | |
| Likelihood you will purchase Pureit within the next 6 months | |||
| Very/somewhat likely | 83 (46) | 111 (66) | 0.04 |
| Unlikely/very unlikely | 79 (44) | 18 (11) | < 0.001 |
| Primary reason you didn't purchase Pureit | |||
| Too expensive | 56 (31) | 46 (27) | 0.63 |
| Not enough money | 109 (60) | 115 (68) | 0.96 |
Purifier awareness.
Purifier awareness was high among all respondents, with no statistical difference between intervention and control groups (90% versus 88%, P = 0.71) (Table 2). The most common source of information for both adopters and non-adopters about the purifier came from the self-help group (72%). Those in the intervention group were statistically more likely to hear about the purifier from their children's teacher (52% versus 9%, P < 0.001) and from their child (22% versus 7%, P = 0.002). Those in the control group were significantly more likely to have heard of the purifier from family or friends than those in the intervention group (52% versus 68%, P = 0.001). Twenty-five percent of respondents in the intervention group got their primary message about the purifier from their children or teachers at school, as opposed to 3% in the control communities (P < 0.001).
Adoption of water treatment methods.
Forty-five percent of households reported treating their water to make it safe to drink. The most commonly reported techniques included boiling (24%), using a cloth filter (21%), and using a candle, ceramic, or chlorine-based filter or the purifier (19%) (Table 2). A similar proportion of household members in the intervention and control groups reported boiling (22% versus 25%, P = 0.60), using a filtration or purification system (22% versus 20%, P = 0.33), and using a cloth filter at the source or at home (24% versus 16%, P = 0.89). Ninety-five of the purifiers and filter systems observed in homes were chlorination-based purifiers promoted by the program and self-help groups in the area. The difference in ownership of the purifiers at the end of the year (26% versus 19%, P = 0.53) was not statistically significant. Reported reasons for not purchasing the purifier were consistent between the intervention and control groups, with affordability being the major reason given; only 3% of non-adopters reported that they didn't believe they needed a purifier.
Multivariable analysis-awareness.
Assessing the effect of the school-based intervention only—while controlling for school type—households in the intervention community had a 1.2 (95% confidence interval [CI] = 0.4–3.1) times greater odds of hearing about the purifier, though the difference was not significant (data not shown). When controlling for confounders (Table 3), awareness among intervention households was not significant. Those in the least poor SES tercile had a 3.6 times greater odds of awareness of a purifier (95% CI = 1.2–10.8) compared with the households in the poorest tercile; the difference between the middle SES tercile and poorest was not significant. Respondents who were members of a self-help group had a 9.7 (95% CI = 4.3–22.1) times greater odds of hearing about the purifier; respondents with children < 5 years of age (odds ratio [OR] = 2.6, 95% CI = 0.9–7.8) and households with toilets in their compound (OR = 8.8, 95% CI = 0.9–89.4) had increased awareness, though only to the α = 0.1 level.
Table 3.
Multivariable model of purifier awareness among household respondents
| OR | 95% CI | P | |
|---|---|---|---|
| Invention status | 1.2 | 0.4–3.6 | |
| School type (middle vs. primary) | 0.4 | 0.1–1.3 | |
| SES tercile | |||
| Middle vs. poorest | 1.7 | 0.7–4.2 | |
| Least poor vs. poorest | 3.6 | 1.2–10.8 | ** |
| Toilet | 8.8 | 0.9–89.4 | * |
| Female head education | |||
| Some/completed primary vs. none | 1.9 | 0.8–5.3 | |
| At least some secondary vs. none | 2.5 | 0.8–7.9 | |
| Male head education | |||
| Some/completed primary vs. none | 1.3 | 0.5–3.3 | |
| At least some secondary vs. none | 0.7 | 0.3–2.0 | |
| Household size | 1.1 | 0.8–1.5 | |
| Child under 5 years in household | 2.6 | 0.9–7.8 | * |
| Female member of self-help group vs. non-member | 9.7 | 4.3–22.1 | *** |
Significant at P < 0.1.
Significant at P < 0.05.
Significant at P < 0.001.
OR = odds ratio; CI = confidence interval; SES = socio-economic status.
Determinants of purifier adoption.
Bivariate Associations.
Key covariates assumed a priori to data analysis to be associated with purifier adoption are found in Table 4. Unadjusted bivariate associations showed no relationship between intervention and purifier adoption. Socio-economic status, presence of a toilet in the compound, high maternal education, and having some or many friends who own a purifier were all significant predictors of purifier adoption. Adopters were statistically more likely than non-adopters to have heard of a purifier from their self-help group (97% versus 66%, P < 0.001) and television (70% versus 44%, P = 0.001). Among households in the intervention group, 88% of adopters had seen a purifier at their child's school, as opposed to 76% of non-adopters (P = 0.05). Similarly, 7% of adopters had children that brought water home from school, as opposed to 0% of non-adopters (P < 0.001). The difference between adopters and non-adopters who had spoken to a teacher or tasted water at the child's school was non-significant.
Table 4.
Bivariate associations based on adoption of Pureit
| Pureit adopt (%) | Non-adopt (%) | P | |
|---|---|---|---|
| Demographic and design variables | N = 105 | N = 407 | |
| Intervention | 59 (56) | 209 (51) | 0.54 |
| Self-help group membership | 102 (97) | 241 (59) | < 0.001 |
| SES tercile | |||
| Middle | 39 (37) | 132 (32) | 0.004 |
| Least poor | 46 (44) | 126 (31) | 0.004 |
| Toilet in compound | 28 (27) | 40 (10) | < 0.001 |
| Maternal education | |||
| Some/completed primary | 27 (26) | 124 (30) | 0.43 |
| At least some secondary | 46 (44) | 100 (25) | < 0.001 |
| Paternal education | |||
| Some/completed primary | 34 (32) | 150 (37) | 0.53 |
| At least some secondary | 49 (47) | 133 (33) | 0.007 |
| Friends own | |||
| Few | 32 (30) | 187 (46) | < 0.001 |
| Some/most | 65 (62) | 128 (31) | < 0.001 |
| Message drivers of adoption | |||
| Children | 19 (18) | 55 (14) | 0.83 |
| Teachers | 31 (30) | 111 (27) | 0.60 |
| Self-help group | 101 (97) | 270 (66) | < 0.001 |
| Family/friends | 75 (71) | 225 (55) | 0.02 |
| TV | 73 (70) | 180 (44) | 0.001 |
| Radio | 1 (1) | 32 (8) | 0.08 |
| Sales stalls and kiosks | 13 (13) | 28 (7) | 0.01 |
| School-based drivers of adoption among intervention communities (intervention schools only) | N = 59 | N = 209 | |
| Seen Pureit at school | 50 (88) | 159 (76) | 0.05 |
| Spoken to teacher at school | 11 (19) | 28 (13) | 0.31 |
| Tasted water from Pureit at school | 10 (17) | 26 (12) | 0.37 |
| Child brought water home | 4 (7) | 0 (0) | < 0.001 |
SES = socio-economic status.
Multivariate analysis-adoption.
Households whose children attended the intervention schools were not more likely to purchase a purifier (Table 5) as determined either by the model adjusting for design variables (OR = 1.3, 95% CI = 0.6–2.6) or with the parsimonious fully adjusted model (OR = 1.2, 95% CI = 0.5–2.7). Those in the middle SES tercile were twice as likely as those in the poorest to own a purifier (OR = 2.3, 95% CI = 1.1–5.2), as were those in the least poor (OR = 2.2, 95% CI = 1.0–4.7). Owning a toilet was also a positive predictor of purifier adoption (OR = 4.4, 95% CI = 1.6–12.2). Similar associations were found in models of awareness: households with female heads belonging to a self-help group were more likely (OR = 34.7, 95% CI = 9.3–130.5) to own a purifier as compared with non-members. The intra-cluster variance (ρ) was 0.26, representing a high degree of the variation explained by the school clusters.
Table 5.
Multivariable models of safe water practices (chlorine purifier, cloth filtration, and boiling) among households
| Variable | Model 1 – purifier | Model 2 – purifier | Model 2 – cloth filter | Model 2 – boiling | ||||||||
|---|---|---|---|---|---|---|---|---|---|---|---|---|
| OR | 95% CI | P | OR | 95% CI | P | OR | 95% CI | P | OR | 95% CI | P | |
| Invention status | 1.3 | 0.6–2.6 | 1.2 | 0.5–2.7 | 0.6 | 0.2–2.4 | 0.4 | 0.1–1.2 | ||||
| School type (middle vs. primary) | 0.9 | 0.4–2.1 | 1.2 | 0.5–3.1 | 1.1 | 0.2–4.5 | 1.6 | 0.5–5.4 | ||||
| SES tercile | ||||||||||||
| Middle vs. poorest | 2.3 | 1.1–5.2 | ** | 1.3 | 0.6–3.0 | 1.5 | 0.7–3.2 | |||||
| Least poor vs. poorest | 2.2 | 1.0–4.7 | ** | 2.6 | 1.1–6.0 | ** | 1.7 | 0.8–3.6 | ||||
| Toilet | 4.4 | 1.6–12.2 | *** | 3.7 | 1.2–11.5 | ** | 3.0 | 1.1–8.3 | ** | |||
| Female head education | ||||||||||||
| Some/completed primary vs. none | 0.8 | 0.4–1.6 | 1.2 | 0.5–2.9 | 1.6 | 0.8–3.3 | ||||||
| At least some secondary vs. none | 1.7 | 0.8–3.7 | 1.4 | 0.6–3.3 | 0.9 | 0.4–1.9 | ||||||
| Male head education | ||||||||||||
| Some/completed primary vs. none | 1.0 | 0.5–2.2 | 0.5 | 0.2–1.2 | 1.2 | 0.6–2.5 | ||||||
| At least some secondary vs. none | 1.2 | 0.5–2.6 | 0.4 | 0.2–0.9 | ** | 1.1 | 0.5–2.3 | |||||
| Household size | 0.8 | 0.7–1.0 | * | 1.0 | 0.8–1.3 | 1.0 | 0.8–1.2 | * | ||||
| Child < 5 years of age in household | 1.2 | 0.6–2.4 | 1.2 | 0.6–2.5 | 1.2 | 0.6–2.3 | ||||||
| Female member of self-help group | 34.8 | 9.3–130.5 | *** | 0.6 | 0.3–1.2 | 0.7 | 0.4–1.3 | |||||
| Friends own (most/some vs. few/none) | 2.8 | 1.4–5.6 | *** | |||||||||
Significant at P < 0.1.
Significant at P < 0.05.
Significant at P < 0.001.
OR = odds ratio; CI = confidence interval; SES = socio-economic status.
There was no association with the intervention and increased reported use of cloth filtration at the home or water source (model 2: OR = 0.6, CI = 0.2–2.4) or boiling (model 3: OR = 0.4, CI = 0.1–1.2). Increased wealth (OR = 2.6, CI = 1.1–6.0) and toilet use (OR = 3.7, CI = 1.2–11.5) were associated with use of cloth filtration. At least some secondary education among male heads of household was associated with reduced use of cloth filters (OR = 0.4, CI = 0.2–0.9). Having a toilet was also associated with increased boiling (OR = 3.0, CI = 1.1–8.3).
Discussion
There has been increased attention in recent years on promotion of water, sanitation, and hygiene (WASH) in schools.23 However, most of the work to date has involved implementing organizations assembling lessons learned and best practices.24,25 To our knowledge, this is the first study using an experimental design to assess the impact of school-based water quality interventions to increase the awareness and uptake of effective POU water treatment in the home.
Although our study was not designed to assess the effectiveness of the pilot in providing safe drinking water in schools, our results provide mixed evidence on this issue. A high proportion of the purifiers was functioning and observed to be in use at the time of the site visit. However, it is not clear that the output of the purifier—9 L in 2–3 hours—would be sufficient to meet the needs of 50 students in school for 5 hours. Moreover, as with many school-based WASH programs, sustainability and meeting the recurrent costs of purchasing consumables is a challenge.26 None of the broken purifiers were replaced and the rate of repurchase of consumables was well below what would be necessary to provide safe water to children during the time of the program implementation.
This study provides no evidence that the intervention was successful in increasing awareness or adoption of boiling, improved storage, or other potentially effective water management practices in homes, including the purifier that was placed in classrooms within the context of the non-experimental promotion through microfinance organizations and using commercial media. Households in the intervention group reported hearing messages about effective water treatment in the home from children and teachers, and the source of messages about the purifier was associated, sometimes strongly, with adoption. However, messages from pupils or teachers in this study were not associated with adoption. The fact that the program did not increase awareness of any of these POU water treatment methods suggests that either the communication strategy was not effective or that other mechanisms were far more influential. High levels of awareness in the control group underscore this finding. As prior research has shown, and teachers know well, the mere delivery of hygiene or any other instruction in a school-based setting is no guarantee of changes in knowledge, much less behavior.13,14
There is evidence that the purifier that was used in the pilot could not be adopted by this target population without economic support or without a more targeted marketing approach. Membership in a self-help group was critical to increasing awareness and uptake of the purifier. Self-help groups not only provide credit to members but also to other critical aspects for diffusion through exposure to product demonstrations, early adopters, or changing social norms through exposure with peer influence.12 It is not clear in this case whether the key mechanism of action for self-help group membership was through promotion, reducing financial barriers to adoption, or creating an enabling social norm, or all of the above. The fact that nearly all respondents who purchased the purifier did so through the self-help group underscores that likelihood that the upfront cost of the product is an important barrier; and the evidence suggests that this barrier is not overcome solely through a school-based intervention aimed at increasing awareness. It is also possible that the success of the self-help group model diluted the potential impact of the pilot program by enhancing the awareness and availability of the specific filter products promoted. These approaches could be seen as complementary, because the self-help groups provided financing and access to the product, whereas the school program provided education and the opportunity to see and test the product.
SES plays a substantial role in which households are aware of the purifier, which households purchased the product and which used cloth filtration. Social marketing typically fails to reach the poorest households and the hypothesis is that promotion in schools will level the disparity typically found in socially marketed durable goods; though promotion of POU products by self-help groups may reach populations typically missed by social marketing.27 Although those in the lowest tercile in this study were able to access safe water products, the study design did not allow for us to determine if promotion through self-help groups reduced disparity of access over traditional commercial mechanisms. That the interaction between intervention status and SES was not significant in the multivariable model indicates that promotion of the purifier in the school did not reduce the disparity of adoption.
Reaching the poorest and most vulnerable households is critical for a successful safe water intervention, because those most impacted by diarrheal disease mortality are the poorest households with lack of access to health support. We did not find that the intervention had any effect in reducing disparity with respect to awareness or adoption of safe water treatment. Owning a toilet was strongly associated with purifier adoption (and awareness in the case of toilets). Toilet ownership may be an additional proxy for wealth status not captured in the SES factor score. Though, it may also serve as a proxy for hygiene awareness or health seeking behavior.
Those with children < 5 years of age were more likely to have heard about, but not to adopt the commercial filter. On the basis of the association between SES and adoption discussed previously, to reach those at greatest risk of diarrheal diseases, there is a need to either finance the product to reduce front-end cost or find ways to cross-subsidize the product. Cost was the most significant factor identified by non-adopters as a reason they did not purchase the product. Without a means to finance the product—such as through a micro-loan—acquisition is unlikely. In this study, the role of microfinance institutions and self-help groups in providing product access was evident. However, from these data, we are unable to isolate the role of self-help group membership in adoption, whether it was provision of a supply, knowledge about the importance of safe water, financing, or an enabling social norm for treatment of water. Additional research is needed to better understand the drivers of adoption to facilitate promotion of the purifier through self-help groups.
Knowledge of a risk associated with unsafe water is thought to be critical though not sufficient for driving adoption of safe water practices.28 We did not attempt to identify drivers of adoption, only understand if we increased knowledge in the community. We found limited evidence of correlations that biological and health-based drivers of water treatment (germs cause illness) were more prevalent in intervention communities, and sensory-based beliefs (smell, taste) were more prevalent in control areas. Typically, though acceptability (taste, smell) is often critical in adoption of POU water treatment products,28 health is often not identified as a key driver of behavior change relating to safe water practices.29
We expected that message channels from reliable sources and social norms would play a significant role in behavior change.12 Although intervention households were more likely to have heard about the product from children and teachers, this did not lead to greater uptake across the program area. Adopters were more likely to have seen the filter at school and have children bring water home; however, the lack of difference between the intervention arms in overall adoption raises questions about influence and causality of these influences. Awareness of the filter product increased dramatically throughout the study area, but it is clear that awareness alone was insufficient to drive acquisition.
The relationship between having friends that own a purifier and adoption underscores the influence of social norms on behavior change. However, having friends that own a purifier may be a proxy for wealth, because those that can afford a purifier also have friends that can afford it, thus helping explain some of the disparity relating to SES. Prestige and status may be a critical driver of filter acquisition, like with other WASH interventions such as hygiene30 and sanitation.31 There is need for additional research to understand the role that individual drivers and messages play in POU behavior change and product adoption.
This study had several limitations. First, because the baseline data were unreliable, we were unable to calculate double differences. Because the purifier was largely unavailable before the intervention, we believe that the random selection and matching process mitigated potential imbalance between intervention and control communities. Second, in accordance with the study protocol, we excluded 11 schools from the data analysis that were intended to be included in the study (and therefore part of the allocation of the intervention) but were not actually included in the intervention or the data collection. While this minimizes the risk of misclassification, it prevents a strict intention-to-treat analysis of the results. However, insofar as we found the intervention to be ineffective even among the schools that actually received the intervention, the exclusion of these schools would not impact the results because their inclusion would likely move the point estimate to the null. Third, although these schools were excluded only because UNICEF did not actually reach them when conducting the project, we cannot rule out the possibility that this exclusion was not random, therefore impacting the equivalency of the intervention and control groups in all material respects. Fourth, the parallel promotion activities and the microfinance campaign through self-help groups may have diluted any potential effect of the school-based pilot in terms of both awareness and adoption. Isolation of this pilot from these other commercial activities may have increased the impact of the intervention but would have represented an artificial setting; both UNICEF and HUL sought to examine the additional and targeted contribution the pilot would have in a real world context. The low level of adoption among non-self-help group members underscores the need to pair any promotional campaign for higher-end filters with a mechanism for financing acquisition. A POU water treatment solution with a lower front-end cost may not face the same barriers to adoption and could result in higher uptake by a school-based campaign. Finally, we cannot rule out the possibility that students and parents of control schools were exposed to the purifier through intervention schools, thus resulting in an underestimate of the effect of the intervention.
Conclusion
Schools and school children can play an effective role in increasing awareness and adoption of healthful practices and products at home. However, our results, like those in prior studies, show that delivering a WASH intervention at the school level does not guarantee its effectiveness. Interventions at schools require deliberate messaging and activities for children and technologies developed for home use may be inappropriate for use at schools.32 Although other studies have suggested that schools and children can play a role in securing uptake of healthful interventions at home, our results suggest that at least for household-based water treatment devices with a comparatively high upfront cost, economic status or the availability of credit may be more fundamental to their uptake.
Although the impact of the pilot on uptake may have been diluted because of other promotional activities within the study population, such as promotion by IVDP and commercial advertising, the evidence suggests that in this context and with a relatively high-cost filter the communication/behavior change strategy (software) was insufficient to increase uptake of effective POU methods at home and that the commercial purifier (hardware) required economic support for adoption that was not included in the intervention. Our results suggest that the school-based intervention in Krishnigiri did not add to the effectiveness of the secular commercial activities undertaken to promote the purifier in India, and that access to a microfinance organization was a more effective vehicle for overcoming the barriers to adoption of effective POU at home, at least in the case of options such as the purifier with a comparatively high upfront cost.
ACKNOWLEDGMENTS
This study would not have been possible without the work of a number of people. First, we thank Mr. Ganeshmoorthi and Mr. Deveraj of UNICEF, the main implementers of the project, for their tireless work and dedication. Our partners at AC Nielson—specifically, Shruti Ramaswamy, Rohini Sundar, and Ajay Macaden—were a pleasure to work with and provided invaluable support in survey design and data collection. The formative work of Mary Pat Clasen, Helen Tipper, and Mari Watanabe were critical for the study design. Of course, the work would not have been possible without the participation of teachers and community members in the program schools. Finally, we would like to thank HUL for providing funding for the assessment and Shailesh Gupta for his support during program evaluation.
Footnotes
Financial support: Matthew Freeman and Thomas Clasen are members of the staff of the London School of Hygiene and Tropical Medicine, which receives funding for research from both UNICEF and HUL. The cost of this assessment was paid by HUL, though the sponsoring agency did not play a role in data collection or analysis.
Authors' addresses: Matthew C. Freeman, Center for Global Safe Water, Rollins School of Public Health, Emory University, Atlanta, GA, E-mail: mcfreem@emory.edu. Thomas Clasen, Department of Disease Control, Environmental Health Group, Faculty of Infectious and Tropical Diseases, London School of Hygiene and Tropical Medicine, London, United Kingdom, E-mail: Thomas.clasen@lshtm.ac.uk.
References
- 1.Pruss-Ustun A, Bonjour S, Corvalan C. The impact of the environment on health by country: a meta-synthesis. Environ Health. 2008;7:7. doi: 10.1186/1476-069X-7-7. [DOI] [PMC free article] [PubMed] [Google Scholar]
- 2.Boschi-Pinto C, Velebit L, Shibuya K. Estimating child mortality due to diarrhoea in developing countries. Bull World Health Organ. 2008;86:710–717. doi: 10.2471/BLT.07.050054. [DOI] [PMC free article] [PubMed] [Google Scholar]
- 3.UNICEF, World Health Organization (WHO) Progress on Drinking Water and Sanitation: 2010 Update. New York: UNICEF; 2010. Geneva: WHO. [Google Scholar]
- 4.Wright J, Gundry S, Conroy R. Household drinking water in developing countries: a systematic review of microbiological contamination between source and point-of-use. Trop Med Int Health. 2004;9:106–117. doi: 10.1046/j.1365-3156.2003.01160.x. [DOI] [PubMed] [Google Scholar]
- 5.Clasen T, Schmidt WP, Rabie T, Roberts I, Cairncross S. Interventions to improve water quality for preventing diarrhoea: systematic review and meta-analysis. BMJ. 2007;334:782. doi: 10.1136/bmj.39118.489931.BE. [DOI] [PMC free article] [PubMed] [Google Scholar]
- 6.World Health Organisation (WHO) Water, Sanitation and Hygiene Standards for Schools in Low-cost Settings. Geneva: WHO; 2009. [Google Scholar]
- 7.World Health Organisation (WHO) Guidelines for Drinking Water Quality. Geneva: World Health Organization; 2008. [Google Scholar]
- 8.Migele J, Ombeki S, Ayalo M, Biggerstaff M, Quick R. Diarrhea prevention in a Kenyan school through the use of a simple safe water and hygiene intervention. Am J Trop Med Hyg. 2007;76:351–353. [PubMed] [Google Scholar]
- 9.Blanton E, Ombeki S, Oluoch G, Mwaki A, Wannemuehler K, Quick R. Evaluation of the role of school children in the promotion of point-of-use water treatment and handwashing in schools and households–Nyanza Province, Western Kenya, 2007. Am J Trop Med Hyg. 2010;82:664–671. doi: 10.4269/ajtmh.2010.09-0422. [DOI] [PMC free article] [PubMed] [Google Scholar]
- 10.O'Reilly CE, Freeman MC, Ravani M, Migele J, Mwaki A, Ayalo M, Ombeki S, Hoekstra RM, Quick R. The impact of a school-based safe water and hygiene programme on knowledge and practices of students and their parents: Nyanza Province, western Kenya, 2006. Epidemiol Infect. 2008;136:80–91. doi: 10.1017/S0950268807008060. [DOI] [PMC free article] [PubMed] [Google Scholar]
- 11.Snel M, Ganguly S, Shordt K. School Sanitation and Hygiene Education–India: Handbook for Teachers. Delft, The Netherlands: International Water and Sanitation Centre; 2002. Technical Paper Series no. 39. [Google Scholar]
- 12.Rogers EM. Diffusion of Innovation. New York: The Free Press; 2003. [Google Scholar]
- 13.Onyango-Ouma W, Aagaard-Hansen J, Jensen BB. The potential of schoolchildren as health change agents in rural western Kenya. Soc Sci Med. 2005;61:1711–1722. doi: 10.1016/j.socscimed.2005.03.041. [DOI] [PubMed] [Google Scholar]
- 14.Bowen A, Ma H, Ou J, Billhimer W, Long T, Mintz E, Hoekstra M, Luby SP. A cluster-randomized controlled trial evaluating the effect of a handwashing-promotion program in Chinese primary schools. Am J Trop Med Hyg. 2007;76:1166–1173. [PubMed] [Google Scholar]
- 15.Hunter PR. Household water treatment in developing countries: comparing different intervention types using meta-regression. Environ Sci Technol. 2009;43:8991–8997. doi: 10.1021/es9028217. [DOI] [PubMed] [Google Scholar]
- 16.Banda K, Sarkar R, Gopal S, Govindarajan J, Harijan BB, Jeyakumar MB, Mitta P, Sadanala ME, Selwyn T, Suresh CR, Thomas VA, Devadason P, Kumar R, Selvapandian D, Kang G, Balraj V. Water handling, sanitation and defecation practices in rural southern India: a knowledge, attitudes and practices study. Trans R Soc Trop Med Hyg. 2007;101:1124–1130. doi: 10.1016/j.trstmh.2007.05.004. [DOI] [PubMed] [Google Scholar]
- 17.Clasen T, Nadakatti S, Menon S. Microbiological performance of a water treatment unit designed for household use in developing countries. Trop Med Int Health. 2006;11:1399–1405. doi: 10.1111/j.1365-3156.2006.01699.x. [DOI] [PubMed] [Google Scholar]
- 18.Rothman K, Greenland S, Lash T. Modern Epidemiology. Philadephia, PA: Lippincott, Williams & Wilkins; 2008. [Google Scholar]
- 19.Gwatkin DR, Rutstein S, Johnson K, Suliman E, Wagstaff A, Amouzou A. India: Socio-Economic Differences in Health, Nutrition, and Population. New York: World Bank; 2007. [PubMed] [Google Scholar]
- 20.Vyas S, Kumaranayake L. Constructing socio-economic status indices: how to use principal components analysis. Health Policy Plan. 2006;21:459–468. doi: 10.1093/heapol/czl029. [DOI] [PubMed] [Google Scholar]
- 21.Gwatkin DR, Rutstein S, Johnson K, Suliman E, Wagstaff A, Amouzou A. Socio-Economic Differences in Health, Nutrition, and Population. Washington, DC: World Bank; 2007. (Socio-economic differences in health, nutrition, and population: India). [PubMed] [Google Scholar]
- 22.Rabe-Hesketh S, Skrondal A. Multilevel and Longitudinal Modeling Using Stata. College Station, TX: Stata Press; 2008. [Google Scholar]
- 23.UNICEF . Raising Clean Hands: Advancing Learning, Health, and Participation through WASH in Schools. New York: UNICEF; 2010. [Google Scholar]
- 24.Snel M. The Worth of School Sanitation and Hygiene Education. Delft, Netherlands: International Water and Sanitation Centre (IRC); 2004. [Google Scholar]
- 25.UNICEF, International Water and Sanitation Centre (IRC) Roundtable Proceedings and Framework for Action. Oxford; UK: 2005. (Water, sanitation and hygiene education for schools roundtable meeting). [Google Scholar]
- 26.Saboori S, Freeman M, Odhiambo M, Kimo S, Mwaki A, Okech B, Rheingans R. 137th American Public Health Association Annual Meeting and Exposition. Philidelphia, PA: 2009. (Sustaining school-based point-of-use water treatment in Western Kenya). [Google Scholar]
- 27.Freeman M, Quick R, Abbott D, Ogutu P, Rheingans R. Removing barriers to point-of-use water treatment products through social marketing and entrepreneurship: a case study in Western Kenya. J Water Health. 2009;7:527–534. doi: 10.2166/wh.2009.063. [DOI] [PubMed] [Google Scholar]
- 28.Figueroa M, Kincaid D. Geneva: World Health Organization; 2007. (Social, cultural and behavioral correlates of household water treatment and storage). [Google Scholar]
- 29.Pinfold JV. Analysis of different communication channels for promoting hygiene behaviour. Health Educ Res. 1999;14:629–635. doi: 10.1093/her/14.5.629. [DOI] [PubMed] [Google Scholar]
- 30.Curtis V, Kanki B, Cousens S, Diallo I, Kpozehouen A, Sangare M, Nikiema M. Evidence of behaviour change following a hygiene promotion programme in Burkina Faso. Bull World Health Organ. 2001;79:518–527. [PMC free article] [PubMed] [Google Scholar]
- 31.Jenkins MW, Scott B. Behavioral indicators of household decision-making and demand for sanitation and potential gains from social marketing in Ghana. Soc Sci Med. 2007;64:2427–2442. doi: 10.1016/j.socscimed.2007.03.010. [DOI] [PubMed] [Google Scholar]
- 32.Sidibe MA. Can hygiene be cool and fun? Understanding school children's motivations to use their school toilets and wash their hands with soap in Dakar, Senegal. London, UK: London School of Hygiene and Tropical Medicine; 2007. [Google Scholar]