

Abstract
In the United States, tickborne diseases occur focally. Missouri represents a major focus of several tickborne diseases that includes spotted fever rickettsiosis, tularemia, and ehrlichiosis. Our study sought to determine the potential risk of human exposure to human-biting vector ticks in this area. We collected ticks in 79 sites in southern Missouri during June 7–10, 2009, which yielded 1,047 adult and 3,585 nymphal Amblyomma americanum, 5 adult Amblyomma maculatum, 19 adult Dermacentor variabilis, and 5 nymphal Ixodes brunneus. Logistic regression analysis showed that areas posing an elevated risk of exposure to A. americanum nymphs or adults were more likely to be classified as forested than grassland, and the probability of being classified as elevated risk increased with increasing relative humidity during the month of June (30-year average). Overall accuracy of each of the two models was greater than 70% and showed that 20% and 30% of the state were classified as elevated risk for human exposure to nymphs and adults, respectively. We also found a significant positive association between heightened acarologic risk and counties reporting tularemia cases. Our study provides an updated distribution map for A. americanum in Missouri and suggests a wide-spread risk of human exposure to A. americanum and their associated pathogens in this region.
Introduction
Tickborne diseases are passed between hosts by ticks (Arachnida Ixodida), primarily of the Ixodidae (hard tick) or Argasidae (soft tick) families. Of the 878 identified tick species, 222 are known to feed on humans; 28 of which are known to transmit human pathogens.1
Despite prevention and control efforts, reported tickborne disease incidence has continued to increase in the United States over the past decade. Based on the 2007 Summary of Notifiable Diseases, human monocytic ehrlichiosis and anaplasmosis have increased by more than 100% since 2003.2 The number of Lyme disease cases increased in 2006–2007, and the incidence is now 15% higher than the previous maximum in 2002. With respect to spotted fever rickettsiosis, the 3% decrease in incidence in 2007 followed a 103% increase over the previous five years.2
Tickborne diseases occur focally in the United States that is in a clustered or focused geographic area. For example, of the 19,931 cases of Lyme disease reported to the Centers for Disease Control and Prevention in 2006, 93% came from just 10 states in the northeast or the upper midwest.3 Moreover, within coarse geographic boundaries, risk is heterogeneous and often associated with environmental factors related to vector distributions.4 For example, tick distribution maps based on environmental correlates of tick habitat suitability closely matched areas of increased Lyme disease incidence in the eastern5 and far western6 United States. Tick distribution models do not identify disease risk areas without ancillary data such as vector competence and host behavior or activity, but they do serve as a foundation for identifying areas of elevated risk for human exposure to potential disease vectors and for understanding disease transmission cycles.4,7
One tickborne disease for which key facets of the transmission cycle are unknown is tularemia.8 Approximately 125 (range = 86–193) human cases of tularemia are reported in the United States each year.9 The disease is caused by the bacterium Francisella tularensis, which can be transmitted to humans through a variety of routes including tick or insect bite; handling of infected animals; contact with or ingestion of infected water, food, or soil; and inhalation of infectious aerosol.10,11
Case reports indicate that Arkansas and Missouri represent a major tularemia focus in the United States.9,10 In this region, most human cases appear to be caused by F. tularensis (type A), and exposure is believed to be primarily tickborne.12–16 This assertion is supported by the recent geographic information systems–based model of human risk of exposure to F. tularensis that identified environmental factors associated with tick habitat as significant predictors of risk.17 However, it is largely unknown which tick species or life stages serve as the primary vector(s) of F. tularensis to humans in this region.8
Defining the current distribution of tick species will improve our understanding of human risk of exposure to F. tularensis by tick bites in this endemic area. We report the results of a temporally constrained, spatially intensive tick sampling effort conducted in southern Missouri in early June 2009. Most tularemia cases in the United States are reported during May–August.9 Because of the short incubation period for F. tularensis infection (2–4 days, range = 1–14 days)18 and the timing of host-seeking of key tick species,8 early June represents a period of elevated risk of human exposure to F. tularensis by tick bite. On the basis of field-derived abundance estimates, we sought to 1) identify environmental predictors of areas of elevated risk of tick exposure, 2) extrapolate the tick risk model across the state of Missouri in a geographic information system framework, and 3) compare areas of expected acarologic risk by county to reported incidence of tularemia during 1990–2009.
Materials and Methods
Study site.
Because we were interested in maximizing coverage in high risk areas, we limited sampling to the southern part of the state (south of 38°56′54²N) where most tickborne disease (e.g., tularemia, spotted fever rickettsiosis, and ehrlichiosis) cases occur.19,20 This region includes the Ozark Mountains and Western Plains. The Ozarks rise to an elevation of 540 meters and are primarily hardwood forests (oak, hickory, and sugar maple). Coniferous species of the genera Pinus (pine) and Juniperus (cedar) are also common. With lower elevations in the western plains (approximately 150 meters), the landscape is peppered with lakes and streams and more than 300 native species of grasses and forbs. Much of this area is rural; the mean (SD) Euclidean distance from all sites to the nearest major city was 121 (35) km.
The climate is generally humid, almost sub-tropical, in the southern part of state (http://www.city-data.com/states/Missouri-Climate.html). Precipitation is heaviest in the southeast (122 cm/year) (http://www.city-data.com/states/Missouri-Climate.html). Spring and fall are marked by sudden changes in temperature and precipitation (http://climate.missouri.edu/climate.php). Our spring sampling period coincided with the peak seasonal activity of Amblyomma americanum nymphs and adults and Dermacentor variabilis adults.21–24
Site selection.
Using the 1996 Missouri Gap Analysis Program land classification maps (http://msdis.missouri.edu/mogap.htm), we randomly selected sampling sites on public property among eight vegetation classes (bottomland deciduous forest, deciduous woodland, dry coniferous forest, pine-oak forest, red cedar forest, upland deciduous forest, cool season grassland, and warm grassland) to diversify vegetation types sampled and bias sampling toward A. americanum and D. variabilis habitat.17,25 Once in the field, inaccessible sites (caused by flooding, impassible roads, and misclassified land cover) were moved to a more accessible location of the same habitat type and four were dropped. During June 7–10, 2009, seven teams of 2–3 persons sampled 79 sites (Figure 1).
Figure 1.
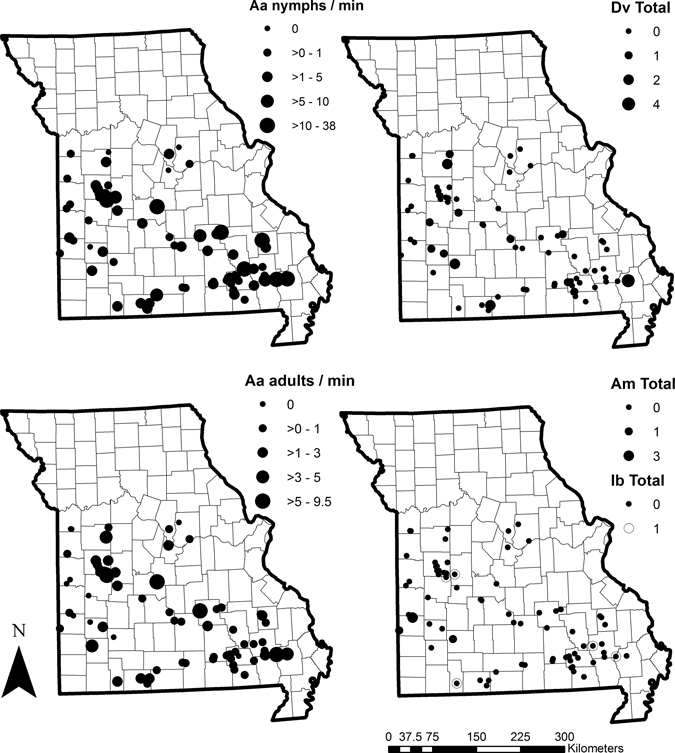
Number of ticks collected from southern Missouri sampling sites by tick species (Aa = Amblyomma americanum; Dv = Dermacentor variabilis, Am = A. maculatum, and Ib – Ixodes brunneus). Markers for Aa are standardized to number of nymphs or adults collected per minute of sampling and increase in size as abundance at site increases. Nymphal abundance for Dv and Am are not shown because only adults were collected. No adult Ib were collected and only total counts per site for Ib nymphs are shown. For species displayed as total counts per site (Am, Dv, and Ib), sites were sampled for 15 minutes.
Tick collections.
To closely resemble the risk incurred by a person walking through vegetation, ticks were collected by drag sampling.26,27 Drags were made from white, rubber-lined flannel infant crib sheets (The William Carter Co., Atlanta, GA). Completed drags were approximately 25 inches wide by 43.5 inches long (63.5 × 110.5 cm) with three 5/8 inch (2 cm) washers sewn in the bottom to weight the material.
Collectors pulled the drag using a nylon rope secured to a 3 foot (0.9 meters) wooden dowel with the goal of maximizing ground contact. Occasionally, flagging by sweeping the cloth across and within dense vegetation was used to supplement the collection. Drags were examined every 15 seconds to minimize tick detachment. Sites were sampled for 15 minutes (sixty 15-second drag samples) without repeat of the same area. Six sites with excessively high tick abundance (> 13 ticks per minute) were sampled for 7.5 minutes. Ticks from each 15-second sample were collectively placed in 2.0-mL microcentrifuge tubes and frozen on dry ice before transfer to a –70°C freezer.
Site locations were documented relative to the World Geodetic System 1984 datum by using Magellan Meridian Platinum global positioning system units (MiTAC International Corporation, Fremont, CA) with a position accuracy of ≥ 3 meters. Temperature and relative humidity at the site were recorded using a digital weather meter (Kestrel 3000; Nielsen Kellerman, Boothwyn, PA). This information was obtained to screen for extreme temperature or relative humidity and standardize sampling, but no sites were excluded based on these measurements.
Ticks were identified to species and life stage by using dissecting microscopes and nymphal and adult taxonomic keys.28–30
Predictive variables.
Because vegetation type has been shown to influence tick abundance in this region,13 we included classified land-use category and measures of vegetation derived from satellite imagery as potential independent variables in our model. Land-use categories were extracted from the 2005 Land-use Classification Map developed by the Missouri Resource Assessment Partnership (available from the University of Missouri, Columbia, MO). Classification categories were derived from spring, summer, and fall 30-meter resolution Landsat 7 satellite imagery and other ancillary data (e.g., population density, aerial photography, previous land cover maps). This more recent classification map was not available at the time of site selection but was used for the analysis.
The eight vegetation classes described above were in the 2005 Land-use Classification Map. However, because of discordance between what was extracted to the points and what was observed in the field and the limited ability of field workers to consistently distinguish between habitat types we were not confident to use the specific habitat types. As a result, the data were dichotomized into more general habitat types: grassland (warm and cool grassland) and forest (deciduous forest, deciduous woody/herbaceous, evergreen woody/herbaceous, herbaceous dominated wetland, low intense urban, woody dominated wetland). Aside from mixed forest that was included as forest, only those classes for which data were obtained were used in regression modeling and subsequent predictions (i.e., high intensity urban, impervious surface, barren or sparsely vegetated, cropland, open water were excluded).
As an alternative to classified imagery, we acquired and mosaiced nine cloud-free (< 10% of image) June Landsat 5 TM tiles for full coverage of the sampling area (U.S. Geological Survey [USGS] GLOVIS; http://glovis.usgs.gov). Three years were necessary for full cloud-free coverage with most tiles from 2005 (n = 6) and 2006 (n = 2; one in 2003). Landsat 5 TM has a reflective band resolution of 30 meters. Normalized difference vegetation index (NDVI) and tasseled cap transformations were performed for surface measures of soil content (brightness), vegetation (NDVI and greenness), and moisture (wetness).31,32 These transformations are part of the standard tools in ENVI versions 4.5 software package (ITT Visual Information Solutions, Boulder, CO) and use surface reflectance in the visible, near infrared, and middle infrared portions of the electromagnetic spectrum.
Thirty-year average (1961–1990) meteorological data were acquired from The Climate Source (Corvallis, OR). These 2-km resolution meteorological surfaces were derived from elevation weighted interpolated weather station data. Because of the importance of moisture to tick survival,1,13,33 we tested the average relative humidity for the year (range for this area was 65–71%), the month of sampling (June) and the month prior (May), and total annual precipitation as possible independent variables. Five measures of temperature (annual maximum, minimum, average, cooling degree days [number of days > 18.3°C], and growing degree days [number of days > 10°C]) were tested in the model because tick host-seeking behavior, most likely caused by desiccating effects, is shown to be sensitive to temperature in Missouri.23 Because our relative abundance data are derived from sampling on four days from a single year, for modeling purposes we limited the meteorological predictors to the 30-year average data to assess general trends.
Climatic and land cover variables often vary with elevation. Thus, elevation was extracted from a 30 × 30 meter resolution digital elevation map from the USGS for testing in the logistic regression model.
Epidemiologic data.
Although dropped from the list of nationally notifiable diseases during 1994–1999, tularemia is currently a nationally notifiable disease and cases must be reported to the CDC. During 1990–2009, 474 probable or confirmed human cases were reported from Missouri to CDC through the National Notifiable Diseases Surveillance System. A confirmed case was defined as clinically compatible illness with isolation of F. tularensis from a clinical specimen or a ≥ 4-fold change in antibody titer.34 A probable case was defined as clinically compatible illness with elevated serum antibody titer(s) to F. tularensis or the detection of the bacteria in a clinical specimen by fluorescence assay.34 A total of 92 counties reported at least one case during this period from the 115 counties in Missouri (Figure 2); (median incidence per county among counties reporting cases: 0.76/100,000 person years, range = 0.06–4.82).
Figure 2.
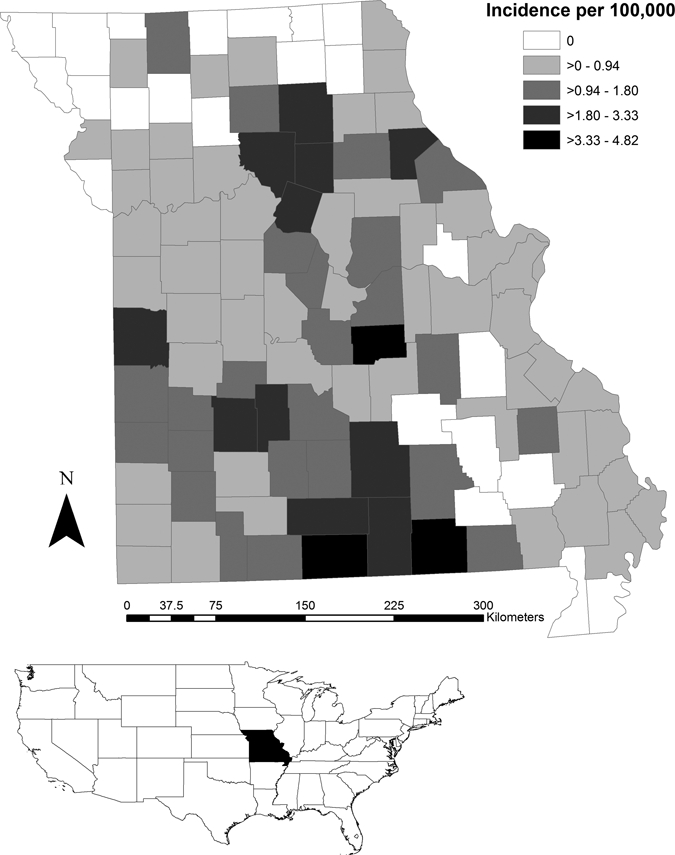
Map of the United States showing the state of Missouri (shaded). Map of Missouri shows tularemia incidence/100,000 persons for cases reported during 1990–2009 for each county.
For privacy protection, human disease data are commonly aggregated at the county level. Thus, we limited our evaluation of the association between acarologic risk and human case occurrence to the county spatial scale. Incidence by county and percentage of counties identified as high risk were not normally distributed and transformation could not make them normally distributed. Therefore, we limited our analysis to seeking an association between the percentage of a county classified by our model as elevated risk and whether the county had reported a human tularemia case during 1990–2009. As described elsewhere,4 epidemiologic data can inadvertently obfuscate trends in vector-borne diseases data because cases are reported based on the location of residence rather than exposure site and because milder vector-borne infections are often underreported. These factors limit our ability to discern direct associations between human infection and acarologic risk and should be considered when analyzing and interpreting human vector-borne disease incidence data.
Data analysis.
Species specific differences in abundance by vegetation type were contrasted by using the non-parametric two-sample Wilcoxon rank-sum (Mann-Whitney) tests. This test compares the underlying distribution for two populations (forest and grassland abundance) on the basis of ranked sums. Only A. americanum nymph and adult collections were sufficient to enable habitat-based distribution modeling. Nymphs and adults were analyzed independently as habitat associations and transmission efficiencies of various tick-borne pathogens may vary by life stage.
For modeling purposes, we tested whether tick abundances were more similar between closer sites than those farther apart by using Moran's I statistic. An association by spatial location could indicate that proximity, rather than environmental factors, explains the tick distribution observed.
We dichotomized the tick abundance data to ameliorate sampling effects. Within specific vegetation types, ticks may aggregate in optimal host-seeking habitat or specific microhabitats, which may potentially skew the abundance data.13,21 Dichotomizing the data helps to control for these effects and preserves the core trends of the data.
Models were built using forward stepwise logistic regression. All 15 potential variables were tested by univariate logistic regression and selected for inclusion in multivariate models on the basis of statistical significance. Variables were added by significance until additional variables no longer improved the model as measured by the difference in Akaike Information Criterion (ΔAIC). The AIC is a measure of model fit and parsimony; models with ΔAIC values less than two units apart were considered equivalent and the more parsimonious model was selected.35
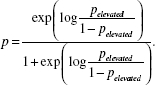
Logistic regression provides the log-odds, but we were interested in the probability of elevated abundance. We first derived the log-odds from the logistic regression 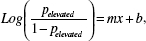 where p is the probability of elevated abundance, b is the intercept, and m is the coefficient for each predictor variable, x. This log-odds was converted into the probability of elevated abundance, p, by exponentiation of the log odds divided by 1 + the odds
 |
This transformation enables us to generate risk maps showing areas of elevated abundance by using the Raster Calculator module of the Spatial Analyst Extension in ArcGIS (ESRI, Redlands, CA).
Using the receiver operating characteristic (ROC), we determined threshold probabilities for A. americanum nymphs and adults at which we simultaneously optimized sensitivity (the number of correctly identified elevated sites) and specificity (the number of correctly identified non-elevated sites). For both life stages, we report sensitivity, specificity, positive predictive value (PPV; the percent of sites the model predicted to be elevated that were elevated), negative predictive value (NPV; the percent of sites the model predicted to be non-elevated risk that were non-elevated), accuracy (number correctly classified) of our probability threshold, and the area under the ROC curve (AUC; a summary statistic of the overall diagnostic accuracy). All analyses were performed in Stata version 10 (StataCorp LP, College Station, TX).
Comparison of the acarologic risk model to epidemiologic data.
We evaluated whether occurrence of tularemia cases was related to acarologic risk. Using the threshold where sensitivity and specificity were optimized simultaneously, we dichotomized the risk map into elevated or non-elevated risk. Next, we totaled the number of pixels per county defined as elevated risk for nymphs or adults and divided by the total number of pixels per county and multiplied by 100 to derive the percentage of the county classified as elevated risk. Finally, we compared the percent of county with elevated risk between counties reporting tularemia and counties not reporting tularemia by using the two-sample Wilcoxon rank-sum (Mann-Whitney) test.
Results
Overview of collections.
For all 79 sites sampled during June 7–10, 2009, 1,071 adults and 3,590 nymphs of four species were collected. All species had been previously reported in this region.22,23,36,37 Species collected included A. americanum (97.8% of adults, n = 1,047) and 99.9% of nymphal collections, n = 3,585), A. maculatum (n = 5), D. variabilis (n = 19), and Ixodes brunneus (n = 5) (Figure 1).
All 19 adult D. variabilis ticks were recovered from 13 sites. The largest number collected from any one site was four collected from a single deciduous woodland site. Six ticks were found in five grassland sites. The remaining nine ticks were collected from deciduous woodland or conifer sites. The five A. maculatum ticks collected were all adults and all collected from four grassland sites. Five I. brunneus nymphs were collected from forested sites.
The most abundant species was A. americanum (the lone star tick), which is the focus of our modeling efforts. From all 79 sites, 548 female, 499 male, and 3,585 nymphs were collected. Ninety-four percent of sites (n = 74) yielded A. americanum. No ticks of any species were collected from the remaining five sites. Per minute of dragging, the median number of nymphs was 0.9 (range = 0–38.3), and the median number of adults was 0.4 (range = 0–9.5). Both life stages were more common in forested sites than grassland sites. The median number of A. americanum nymphs collected from forested sites was 1.7 per minute of sampling (range = 0–34.7), and the median number collected from grassland sites was 0.3 per minute (range = 0–38.3) (z = 2.64, P < 0.01, by Wilcoxon rank-sum test). For adults, the median number collected per minute in forested sites was 0.5 (range = 0–9.5), and the median number collected in grassland sites was 0.13 (range = 0–7.5) (z = 2.92, P < 0.01, by Wilcoxon rank-sum test).
Anecdotally, there was a tendency for greater tick abundance in mixed cedar forests. The two most heavily infested sites were mixed cedar, which yielded 38.3 A. americanum nymphs and 7.5 adults and 34.7 A. americanum nymphs and 9.5 adults per minute of sampling.
Habitat model (A. americanum nymphs).
No effect of spatial proximity was found among the nymphal A. americanum data (Moran's I = 0.16, z = 0.34, P = 0.37). The data were dichotomized at the median as elevated (≥ 0.9 nymphs per minute, n = 39) and non-elevated (< 0.9 nymphs per minute, n = 40). Of 15 variables considered in the stepwise logistic regression, habitat type (forest or grassland) and 30-year average June relative humidity were significant predictors of A. americanum nymphal abundance above or below the median (likelihood ratio χ2 = 22.1, degrees of freedom = 2, P < 0.001) (model comparison in Table 1).
Table 1.
Comparison of logistic regression models for A, elevated Amblyomma americanum nymphal abundance (≥ 0.9 nymphs per minute of sampling) and B, A. americanum adult abundance (≥ 0.4 adults per minute of sampling), Missouri*
| A | Log-odds | OR | χ2 | P value | AIC | ΔAIC |
|---|---|---|---|---|---|---|
| Model 1 | 12.61 | < 0.001 | 100.89 | 7.49 | ||
| Forest | 1.97 | 7.2 | < 0.01 | |||
| Constant | −1.50 | – | 0.01 | |||
| Model 2 | 22.11 | < 0.001 | 93.40 | 0 | ||
| Forest | 2.67 | 14.4 | < 0.001 | |||
| June RH | 0.62 | 1.9 | 0.01 | |||
| Constant | −44.3 | – | < 0.01 | |||
| B | Log-odds | OR | χ2 | P value | AIC | ΔAIC |
| Model 1 | 11.75 | < 0.001 | 101.45 | 3.80 | ||
| Forest | 1.84 | 6.3 | < 0.01 | |||
| Constant | −1.22 | – | 0.02 | |||
| Model 2 | 17.55 | < 0.001 | 97.65 | 0 | ||
| Forest | 2.32 | 10.2 | < 0.001 | |||
| June RH | 0.47 | 1.6 | 0.02 | |||
| Constant | −33.4 | – | 0.02 |
OR = odds ratio; AIC – Akaike information coefficient; ΔAIC = AIC difference between model and the most parsimonious model; RH = relative humidity. The coefficients and the odds ratio are provided for the independent variables. The likelihood ratio χ2 test, its probability, and the AIC are provided as summary statistics for each competing model. Models were selected on the basis of the change in AIC between the models and the most parsimonious model (ΔAIC).
Being in forest compared with grassland increased the odds of the site being classified as elevated nymphal abundance (compared with non-elevated nymphal abundance) by a factor of 14.4, and for every percent increase in 30-year average June relative humidity, the odds increased by a factor of 1.9. Using ROC curves, we selected a probability cut-off that optimized sensitivity and specificity. For the nymphs, this threshold was selected where the probability of elevated abundance was ≥ 0.55 (sensitivity 79.5%, specificity 65.0%, PPV 68.9%, NPV 76.5%, accuracy 72.2%, and AUC 79.1%; Table 2).
Table 2.
Summary for the accuracy of predictions on the basis of logistic regression models developed for nymphal and adult Amyblyomma americanum (probability ≥ 0.55 and ≥ 0.60 for nymphs and adults, respectively), Missouri*
| Predicted | Observed, nymph | Observed, adult | ||
|---|---|---|---|---|
| Elevated | Non-elevated | Elevated | Non-elevated | |
| Elevated | 31 | 14 | 32 | 13 |
| Non-Elevated | 8 | 26 | 10 | 24 |
| Sn | 79.5% (31/39) | 76.2% (32/42) | ||
| Sp | 65.0% (26/40) | 64.9% (24/37) | ||
| PPV | 68.9% (31/45) | 71.1% (32/45) | ||
| NPV | 76.5% (26/34) | 70.6% (24/34) | ||
| Accuracy | 72.2% (57/79) | 70.9% (56/79) | ||
| AUC | 79.1% | 77.7% | ||
Sn = sensitivity; Sp = specificity; PPV = positive predictive value; NPV = negative predictive value; Accuracy = overall accuracy; AUC = area under the curve.
We mapped the probability predictions by converting the logit function to a probability of risk of encountering elevated abundance of A. americanum nymphs using the expression log oddsnymph = –44.3 + 2.67 × Forest + 0.62 × RHJune. After extrapolation of this equation across the surface of Missouri, we identified 20.4% of the state as posing an elevated risk of encountering A. americanum nymphs with the highest probabilities occurring in south-central Missouri (Figure 3A).
Figure 3.
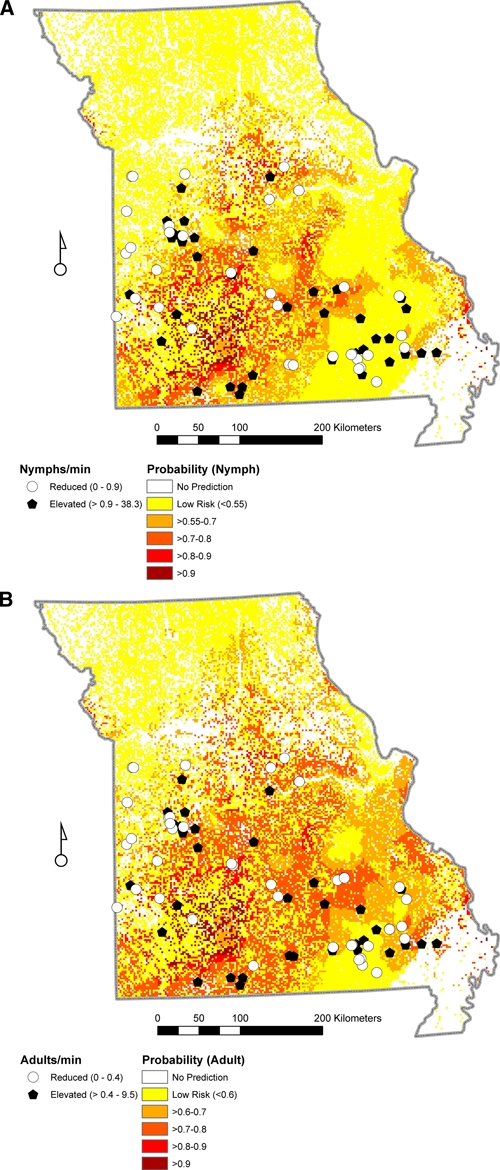
Predicted probability of elevated Amblyomma americanum abundance in Missouri based on forest and June relative humidity. The white areas are areas for which no prediction was made because no field data were collected for the habitat type. A, Nymph: dark circles indicate elevated abundance (≥ 0.9 nymphal ticks per minute) and open circles indicate non-elevated abundance based on field sampling. B, Adult: dark circles indicate elevated abundance (≥ 0.4 adult ticks per minute) and open circles indicate non-elevated abundance based on field sampling.
Habitat model (A. americanum adults).
No effect of spatial proximity was found among the adult A. americanum data (Moran's I = 0.12, z = 0.25, P = 0.40). The data were dichotomized at the median into elevated (≥ 0.4 adult ticks per minute n = 42) and non-elevated (< 0.4 adult tick per minute n = 37) sites. As with the nymphal model, habitat type (forest or grassland) and 30-year average June relative humidity were significant to predict A. americanum adult abundance above or below the median (likelihood ratio χ2 = 17.55, degrees of freedom = 2, P < 0.001) (model comparison in Table 1).
Being in forest compared with grassland increased the odds of being classified as elevated abundance (versus. non-elevated abundance) by a factor of 10.2, and for every percent increase in relative humidity, the odds increased by a factor of 1.6. Again using the ROC, we identified a probability threshold for elevated adult abundance at ≥ 0.60 (sensitivity 76.2%, specificity 64.9%, PPV 71.1%, NPV 70.6%, overall accuracy 70.9%, and AUC 77.7%; Table 2).
We mapped these prediction probabilities by converting the logit function to a probability where the risk of encountering elevated abundance of A. americanum adults was defined as log oddsadult = –33.4 + 2.32 × forest + 0.47 × RHJune.
After extrapolation of this equation across the surface of Missouri, we identified 30.0% of the state as posing an elevated risk of encountering A. americanum adults with the highest probabilities occurring in south and central Missouri (Figure 3A).
Comparison of the acarologic risk model to epidemiologic data.
We compared the percent of the total county area classified as elevated risk between counties that reported at least one case of tularemia during 1990–2009 and counties that reported no cases. For nymphs, counties reporting tularemia cases had significantly higher percentages of coverage classified as elevated risk (median = 21.1%, range = 0–66.1%) compared with counties reporting no tularemia (median = 0%, range = 0–64.4%; z = −4.29, P < 0.001, by Wilcoxon rank-sum test). For adults, a similar trend was seen. For counties reporting tularemia, the median percent of area identified as elevated risk was 30.8% (range = 0–79.2%) and for counties with no tularemia recorded the median risk area was 0.01% (range = 0–72.7%; z = −3.62, P < 0.001, by Wilcoxon rank-sum test).
Discussion
Our temporally constrained and spatially intensive sampling of ticks in southern Missouri serves as a foundation for a description of the distribution of host-seeking ticks in early June in this region. During this period, which coincided with when many tularemia patients would have been exposed to infectious ticks, A. americanum was by far the most abundant host-seeking tick. Two environmental variables were used to generate distribution maps for A. americanum across unsampled areas of Missouri and, when compared with county reports of tularemia cases during 1990–2009, counties that reported tularemia had higher percentages of the county classified by our model as elevated risk for exposure to A. americanum. Given laboratory demonstration of the vector competence of A. americanum for F. tularensis38 and evidence of natural infections with the etiologic agent of tularemia,39 our findings support previous deductions that, from an acarologic risk standpoint, implicate A. americanum as a prominent tularemia vector in Missouri.14
We found a disproportionate abundance of A. americanum compared with D. variabilis. The relative abundance of each may have been influenced by the timing and locations of our samples. Nonetheless, similar to our study, collections from Arkansas in the 1950s found 99.6% of ticks collected from drag sampling were A. americanum compared with 0.1% D. variabilis.40 More recently, as part of a surveillance of ixodid ticks in deciduous cover in the eastern half of the United States, a similar predominance of A. americanum over D. variabilis in spring and summer collections was detected in the three of Missouri sampling sites.5
Only for A. americanum were our sample sizes sufficient for acarologic risk modeling. Forest and relative humidity emerged as significant predictors for nymphs and adults, although to varying degrees. The differences between nymphal and adult models in the weighting of each predictor variable and the probability thresholds selected that optimized sensitivity and specificity for each life stage resulted in slight differences in the predicted distributions generated for nymphs and adults (Figure 3).
The proclivity for A. americanum to be collected from forests in this region is well-documented.13,33 This proclivity has been partially explained by the key host of this species, the white-tailed deer (Odocoileus virginianus), which is present in forested habitat types.22 White-tailed deer are the principal host for A. americanum and help maintain the abundance of this tick.41,42 Moreover, the expansion of white-tailed deer is reported to have considerable influence on the spread of A. americanum-borne diseases, such as ehrlichiosis and southern tick–associated rash illness.43,44 Higher relative humidity is likely important because moisture retention is necessary for tick survival.1,13,25,33
Although we included several dependent variables that would have provided a finer differentiation among habitat types (e.g., Landsat-derived brightness, greenness, wetness and NDVI) than the forest/grassland dichotomy used in our final model, none of these variables was significant. This finding is in contrast to other tick species, for which satellite-derived ground cover indices were found to be important in the identification of acarologic risk areas within dense woodland in California.45–47 Similarly, in Wisconsin, Kitron and Kazmierczak48 identified greater risk based on NDVI where higher values indicative of more densely forested areas coincided with increased acarologic risk for I. scapularis. Even when limiting our data to the 57 forested sites, only relative humidity was significant for both life stages. One explanation for the lack of significance using satellite-derived predictors for A. americanum compared with other ixodid ticks may be that A. americanum is a generalist tick with respect to forest type. This finding may also explain the broad predicted and observed distributions of this tick within our study.
The broad geographic distribution and high abundance of A. americanum,13,33 its affinity at all life stages to bite humans,13,43,49 the recovery of F. tularensis from field caught specimens in Arkansas,39,50 its vector competence,38 and the observation that host-seeking phenology coincides with the seasonal occurrence of human tularemia cases8,14,43 supports a role for A. americanum in F. tularensis transmission in this region. Our study showed that counties that reported tularemia cases over a 20-year period had higher proportions of the county classified by our model as elevated risk for exposure to A. americanum nymphs and adults. However, because cases were reported based on county of residence, rather than county of exposure, and the route of exposure was not reported in our surveillance system, future studies are required to determine how frequently tularemia cases are acquired through tick-borne exposure. Furthermore, extensive laboratory studies are required to evaluate how efficiently A. americanum transmits F. tularensis.
Our acarologic risk maps indicate that the area of risk for A. americanum nymphs and adults overlap in time and space, thus facilitating unification of disease prevention initiatives and vector control efforts. In addition, the variables used to model the distribution, forested land cover and higher relative humidity, are easily understood and identified. To a Missouri resident or visitor, these maps indicate the need for repellents and protective clothing prior to and tick checks subsequent to being in the woods. Personal protective activities and vector control activities would be similar regardless of life stage. Thus, a single message can be generated to reduce the burden of A. americanum-associated diseases in this area.
ACKNOWLEDGMENTS
In addition to the co-authors, field collections were performed by personnel from the CDC, Fort Collins (Michael Buhnerkempe, Anna Winters), CDC, Atlanta (Aubree Roche), Missouri Department of Health and Senior Services (Jeff Wenzel), U.S. Air Force, Brooks City-Base Entomology Unit (Paul Martin, Karon Rizner), the U.S. Geological Survey in Rolla, Missouri (Dave Shaver), and graduate students working on tick-borne disease from the University of Missouri (Jennifer McClure) and the University of Arkansas (Rebecca Trout). We appreciated the logistic support from Michael Buhnerkempe and Anna Winters with construction of collecting materials and labeling collection tubes. We thank the following organizations for permission to sample on their properties: Stockton Lake U.S. Army Corps of Engineers (USACOE), Smithville Lake USACOE, Harry S Truman Reservoir USACOE, Mingo National Wildlife Refuge, Squaw Creek National Wildlife Refuge, Mark Twain Lake USACOE, Table Rock Lake USACOE, Wappapello Lake USACOE, Mark Twain National Forest- Eleven Point Ranger District, U.S. Fish and Wildlife Service National Wildlife Refuge, Ozark National Scenic Riverways, Bull Shoals Reservoir, Long Branch Lake, Swan Lake National Wildlife Refuge, and the Missouri Department of Conservation.
Footnotes
Financial support: This study was supported in part by the appointment of Heidi E. Brown to the Research Participation Program at the National Center for Zoonotic, Vector-Borne, and Enteric Diseases, Division of Vector-Borne Diseases, CDC administered by the Oak Ridge Institute for Science and Education through an interagency agreement between the U.S. Department of Energy and CDC. Partial support for this project was provided through the internal funding under the CDC National Center for Environmental Health.
Authors' addresses: Heidi E. Brown, The University of Arizona School of Geography and Development, Tucson, AZ, E-mail: heidibrown@email.arizona.edu. Karen F. Yates, Vector-Borne Disease Program, Missouri Department of Health and Senior Services, Jefferson City, MO, E-mail: karen.yates@dhss.mo.gov. Gabrielle Dietrich, Katherine MacMillan, Christine B. Graham, Paul S. Mead, and Rebecca J. Eisen, National Center for Zoonotic, Vector-Borne and Enteric Diseases, Division of Vector-Borne Infectious Diseases, Centers for Disease Control and Prevention, Foothills Campus, Fort Collins, CO, E-mails: edietrich@cdc.gov, kmacmillan@cdc.gov, cgraham@cdc.gov, pfm0@cdc.gov, and rjeisen@cdc.gov. Sara M. Reese, Health Facilities and Emergency Medical Services, Division Colorado Department of Public Health and Environment, South Denver, CO, E-mail: sreese@smtpgate.dphe.state.co.us. Wm. Steve Helterbrand, U.S. Geological Survey, National Geospatial Technical Operations Center, Center of Excellence for Geospatial Information Science, Rolla MO, E-mail: vwhelterbrand@usgs.gov. William L. Nicholson, Disease Assessment Team, Rickettsial Zoonoses Branch, National Center for Zoonotic, Vector-Borne, and Enteric Diseases, Centers for Disease Control and Prevention, Atlanta, GA, E-mail: wnicholson@cdc.gov. Keith Blount, Department of Biology, U.S. Air Force Academy, CO, E-mail: keith.blount@us.af.mil. Sarah L. Patrick, Section of Epidemiology and Public Health Practice, Division of Community and Public Health, Missouri Department of Health and Senior Services, Jefferson City, MO, E-mail: sarah.patrick@dhss.mo.gov.
References
- 1.Anderson JF, Magnarelli LA. Biology of ticks. Infect Dis Clin North Am. 2008;22:195–215. doi: 10.1016/j.idc.2007.12.006. [DOI] [PubMed] [Google Scholar]
- 2.Hall-Baker PA, Enrique Nieves J, Jajosky RA, Adams DA, Sharp P, Anderson WJ, Aponte JJ, Jones GF, Aranas AE, Rey A, Lane B, Wodajo MS. Summary of notifiable diseases—United States, 2007. MMWR Morbid Mortal Wkly Rep. 2009;56:1–94. [Google Scholar]
- 3.Bacon RM, Kugeler KJ, Mead PS. Surveillance for Lyme disease—United States, 1992–2006. MMWR Morb Mortal Wkly Rep. 2008;57:1–9. [PubMed] [Google Scholar]
- 4.Eisen RJ, Eisen L. Spatial modeling of human risk of exposure to vector-borne pathogens based on epidemiological versus arthropod vector data. J Med Entomol. 2008;45:181–192. doi: 10.1603/0022-2585(2008)45[181:smohro]2.0.co;2. [DOI] [PubMed] [Google Scholar]
- 5.Diuk-Wasser MA, Gatewood AG, Cortinas MR, Yaremych-Hamer S, Tsao J, Kitron U, Hickling G, Brownstein JS, Walker E, Piesman J, Fish D. Spatiotemporal patterns of host-seeking Ixodes scapularis nymphs (Acari: Iodidae) in the United States. J Med Entomol. 2006;43:166–176. doi: 10.1603/0022-2585(2006)043[0166:spohis]2.0.co;2. [DOI] [PubMed] [Google Scholar]
- 6.Eisen RJ, Lane RS, Fritz CL, Eisen L. Spatial patterns of Lyme disease risk in California based on disease incidence data and modeling of vector-tick exposure. Am J Trop Med Hyg. 2006;75:669–676. [PubMed] [Google Scholar]
- 7.Randolph SE. Tick ecology: processes and patterns behind the epidemiological risk posed by ixodid ticks as vectors. Parasitology. 2004;129:S37–S65. doi: 10.1017/s0031182004004925. [DOI] [PubMed] [Google Scholar]
- 8.Eisen L. A call for renewed research on tick-borne Francisella tularensis in the Arkansas-Missouri primary national focus of tularemia in humans. J Med Entomol. 2007;44:389–397. doi: 10.1603/0022-2585(2007)44[389:acfrro]2.0.co;2. [DOI] [PubMed] [Google Scholar]
- 9.Centers for Disease Control and Prevention Tularemia–United States, 1990–2000. MMWR Morb Mortal Wkly Rep. 2002;51:181–184. [PubMed] [Google Scholar]
- 10.Petersen JM, Mead PS, Schriefer ME. Francisella tularensis: an arthropod-borne pathogen. Vet Res. 2009;40:7. doi: 10.1051/vetres:2008045. [DOI] [PMC free article] [PubMed] [Google Scholar]
- 11.Spach DH, Liles WC, Campbell GL, Quick RE, Anderson DE, Fritsche TR. Tick-borne diseases in the United-States. N Engl J Med. 1993;329:936–947. doi: 10.1056/NEJM199309233291308. [DOI] [PubMed] [Google Scholar]
- 12.Farlow J, Wagner DM, Dukerich M, Stanley M, Chu M, Kubota K, Petersen J, Keim P. Francisella tularensis in the United States. Emerg Infect Dis. 2005;11:1835–1841. doi: 10.3201/eid1112.050728. [DOI] [PMC free article] [PubMed] [Google Scholar]
- 13.Hair JA, Howell DE. Lone star ticks: their biology and control in Ozark recreation areas. Oklahoma State University Agricultural Experiment Station Bulletin. 1970;B-679:3–47. [Google Scholar]
- 14.Hopla CE. The transmission of tularemia organisms by ticks in the southern states. South Med J. 1960;53:92–97. doi: 10.1097/00007611-196001000-00020. [DOI] [PubMed] [Google Scholar]
- 15.Taylor JP, Istre GR, Mcchesney TC, Satalowich FT, Parker RL, Mcfarland LM. Epidemiologic characteristics of human tularemia in the southwest-central states, 1981–1987. Am J Epidemiol. 1991;133:1032–1038. doi: 10.1093/oxfordjournals.aje.a115812. [DOI] [PubMed] [Google Scholar]
- 16.Washburn AM, Tuohy JH. The changing picture of tularemia transmission in Arkansas; a study of 704 case histories. South Med J. 1949;42:60–62. doi: 10.1097/00007611-194901000-00012. [DOI] [PubMed] [Google Scholar]
- 17.Eisen RJ, Mead PS, Meyer AM, Pfaff LE, Bradley KK, Eisen L. Ecoepidemiology of tularemia in the southcentral United States. Am J Trop Med Hyg. 2008;78:847–847. [PubMed] [Google Scholar]
- 18.Dennis DT. In: Major Tropical Syndromes by Body System: Systemic Infections. Cohen J, Powderly W, editors. London: Mosby; 2003. pp. 1649–1653. (Tularemia). [Google Scholar]
- 19.Hardin LE, Satalowich FT. Tick-borne disease summary—1997. Missouri Epidemiologist. 1998;20:6–9. [Google Scholar]
- 20.Assal N, Blenden DC, Price ER. Epidemiologic study of human tularemia reported in Missouri, 1949–65. Public Health Rep. 1967;82:627–632. [PMC free article] [PubMed] [Google Scholar]
- 21.Burg JG. Seasonal activity and spatial distribution of host-seeking adults of the tick Dermacentor variabilis. Med Vet Entomol. 2001;15:413–421. doi: 10.1046/j.0269-283x.2001.00329.x. [DOI] [PubMed] [Google Scholar]
- 22.Kollars TM, Oliver JH, Durden LA, Kollars PG. Host associations and seasonal activity of Amblyomma americanum (Acari: Ixodidae) in Missouri. J Parasitol. 2000;86:1156–1159. doi: 10.1645/0022-3395(2000)086[1156:HAASAO]2.0.CO;2. [DOI] [PubMed] [Google Scholar]
- 23.Kollars TM, Oliver JH, Masters EJ, Kollars PG, Durden LA. Host utilization and seasonal occurrence of Dermacentor species (Acari: Ixodidae) in Missouri, USA. Exp Appl Acarol. 2000;24:631–643. doi: 10.1023/a:1026566301325. [DOI] [PubMed] [Google Scholar]
- 24.Zimmerman RH, Mcwherter GR, Bloemer SR. Role of small mammals in population-dynamics and dissemination of Amblyomma americanum and Dermacentor variabilis (Acari, Ixodidae) at Land-Between-the-Lakes, Tennessee. J Med Entomol. 1987;24:370–375. doi: 10.1093/jmedent/24.3.370. [DOI] [PubMed] [Google Scholar]
- 25.Koch HG. Survival of the lone star tick, Amblyomma americanum (Acari, Ixodidae), in contrasting habitats and different years in southeastern Oklahoma. J Med Entomol. 1984;21:69–79. [Google Scholar]
- 26.Ginsberg HS, Ewing CP. Comparison of flagging, walking, trapping, and collecting from hosts as sampling methods for northern deer ticks, Ixodes dammini, and lone-star ticks, Amblyomma americanum (Acari, Ixodidae) Exp Appl Acarol. 1989;7:313–322. doi: 10.1007/BF01197925. [DOI] [PubMed] [Google Scholar]
- 27.Lane RS. Risk of human exposure to vector ticks (Acari: Ixodidae) in a heavily used recreational area in northern California. Am J Trop Med Hyg. 1996;55:165–173. [PubMed] [Google Scholar]
- 28.Durden LA, Keirans JE. Nymphs of the Genus Ixodes (Acari: Ixodidae) of the United States: Taxonomy, Identification Key, Distribution, Hosts, and Medical/Veterinary Importance. Lanham, MD: Entomological Society of America; 1996. [Google Scholar]
- 29.Keirans JE, Durden LA. Illustrated key to nymphs of the tick genus Amblyomma (Acari: Ixodidae) found in the United States. J Med Entomol. 1998;35:489–495. doi: 10.1093/jmedent/35.4.489. [DOI] [PubMed] [Google Scholar]
- 30.Keirans JE, Litwak TR. Pictorial key to the adults of hard ticks, family Ixodidae (Ixodida, Ixodoidea), east of the Mississippi River. J Med Entomol. 1989;26:435–448. doi: 10.1093/jmedent/26.5.435. [DOI] [PubMed] [Google Scholar]
- 31.Lillesand TM, Kiefer RW. Remote Sensing and Image Interpretation. New York: Wiley; 1994. [Google Scholar]
- 32.Crist EP, Kauth RJ. The tasseled cap de-mystified. Photogramm Eng Remote Sensing. 1986;52:81–86. [Google Scholar]
- 33.Lancaster JL. Control of the lone star tick. Arkansas Agricultural Experiment Station Report Series. 1957;67:1–16. [Google Scholar]
- 34.Centers for Disease Control and Prevention Case definitions for infectious conditions under public health surveillance. MMWR Recomm Rep. 1997;46:1–55. [PubMed] [Google Scholar]
- 35.Burnham KP, Anderson DR. Model Selection and Multi-Model Inference: A Practical Information—Theoretic Approach. New York: Springer-Verlag; 2002. [Google Scholar]
- 36.Kollars TM, Durden LA, Keirans JE, Oliver JH. First records of Haemaphysalis (Aboimisalis) chordeilis, Ixodes (Ixodes) brunneus, and Ixodes (Pholeoixodes) banksi (Acari, Ixodidae) from Missouri. J Entomol Sci. 1995;30:511–512. [Google Scholar]
- 37.Kollars TM, Oliver JH. Host associations and seasonal occurrence of Haemaphysalis leporispalustris, Ixodes brunneus, I. cookie, I. dentatus, and I. texanus (Acari: Ixodidae) in southeastern Missouri. J Med Entomol. 2003;40:103–107. doi: 10.1603/0022-2585-40.1.103. [DOI] [PubMed] [Google Scholar]
- 38.Hopla CE. Experimental studies on tick transmission of tularemia organisms. Am J Hyg. 1953;53:101–118. doi: 10.1093/oxfordjournals.aje.a119585. [DOI] [PubMed] [Google Scholar]
- 39.Calhoun EL, Alford HI., Jr Incidence of tularemia and Rocky Mountain spotted fever among common ticks of Arkansas. Am J Trop Med Hyg. 1955;4:310–317. doi: 10.4269/ajtmh.1955.4.310. [DOI] [PubMed] [Google Scholar]
- 40.Calhoun EL. Natural occurrence of tularemia in the lone star tick, Amblyomma americanum (Linn.), and in dogs in Arkansas. Am J Trop Med Hyg. 1954;3:360–366. doi: 10.4269/ajtmh.1954.3.360. [DOI] [PubMed] [Google Scholar]
- 41.Koch HG. Suitability of white-tailed deer, cattle, and goats as hosts for the lone star tick, Amblyomma americanum (Acari, Ixodidae) J Kans Entomol Soc. 1988;61:251–257. [Google Scholar]
- 42.Koch KR, Burg JG. Relative abundance and survival of the tick Amblyomma americanum collected from sunlit and shaded habitats. Med Vet Entomol. 2006;20:173–176. doi: 10.1111/j.1365-2915.2006.00617.x. [DOI] [PubMed] [Google Scholar]
- 43.Childs JE, Paddock CD. The ascendancy of Amblyomma americanum as a vector of pathogens affecting humans in the United States. Annu Rev Entomol. 2003;48:307–337. doi: 10.1146/annurev.ento.48.091801.112728. [DOI] [PubMed] [Google Scholar]
- 44.Paddock CD, Yabsley MJ. Ecological havoc, the rise of white-tailed deer, and the emergence of Amblyomma americanum-associated zoonoses in the United States. Curr Top Microbiol Immunol. 2007;315:289–324. doi: 10.1007/978-3-540-70962-6_12. [DOI] [PubMed] [Google Scholar]
- 45.Eisen RJ, Eisen L, Girard YA, Fedorova N, Mun J, Slikas B, Leonhard S, Kitron U, Lane RS. A spatially-explicit model of acarological risk of exposure to Borrelia burgdorferi-infected Ixodes pacificus nymphs in northwestern California based on woodland type, temperature, and water vapor. Ticks Tick Borne Dis. 2010;1:35–43. doi: 10.1016/j.ttbdis.2009.12.002. [DOI] [PMC free article] [PubMed] [Google Scholar]
- 46.Eisen RJ, Eisen L, Lane RS. Predicting density of Ixodes pacificus nymphs in dense woodlands in Mendocino County, California, based on geographic information systems and remote sensing versus field-derived data. Am J Trop Med Hyg. 2006;74:632–640. [PubMed] [Google Scholar]
- 47.Eisen L, Eisen RJ, Lane RS. Geographical distribution patterns and habitat suitability models for presence of host-seeking ixodid ticks in dense woodlands of Mendocino County, California. J Med Entomol. 2006;43:415–427. doi: 10.1603/0022-2585(2006)043[0415:gdpahs]2.0.co;2. [DOI] [PubMed] [Google Scholar]
- 48.Kitron U, Kazmierczak JJ. Spatial analysis of the distribution of Lyme disease in Wisconsin. Am J Epidemiol. 1997;145:558–566. doi: 10.1093/oxfordjournals.aje.a009145. [DOI] [PubMed] [Google Scholar]
- 49.Merten HA, Durden LA. A state-by-state survey of ticks recorded from humans in the United States. J Vector Ecol. 2000;25:102–113. [PubMed] [Google Scholar]
- 50.Hopla CE, Downs CM. The isolation of Bacterium tularense from the tick, Amblyomma americanum. J Kans Entomol Soc. 1953;26:72–73. [Google Scholar]