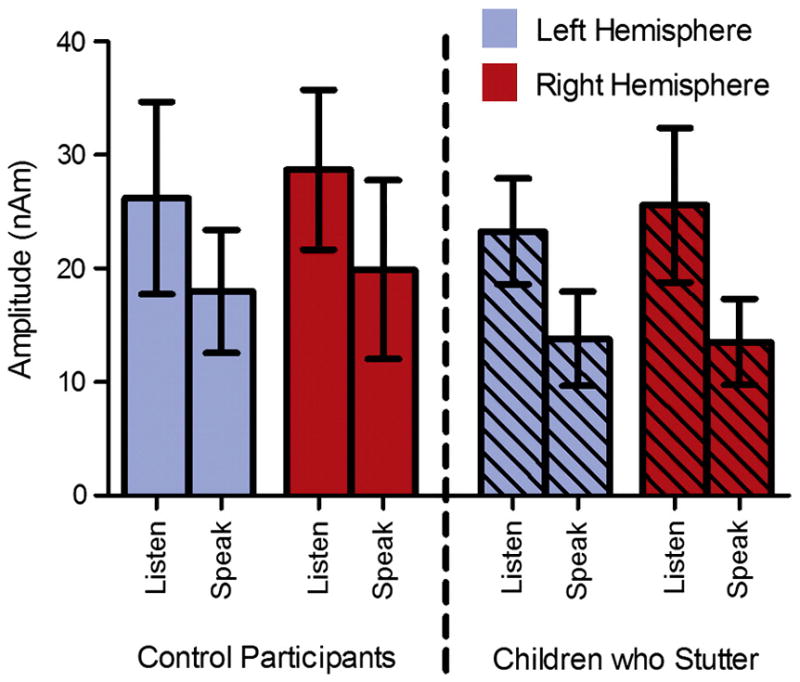
Figure 5.

The results of the listen vowel and speak vowel amplitude analysis. On average, the control participants and children who stutter demonstrated a 59% reduction in M50 amplitude for the speak vowel condition relative to the listen vowel condition. Error bars represent the 95% confidence interval.
