

Abstract
This study evaluated the interrelations among cognitive precursors across quantitative, linguistic, and spatial attention domains that have been implicated for math achievement in young children. The dimensionality of the quantity precursors was evaluated in 286 Kindergarteners via latent variable techniques, and the contribution of precursors from each domain was established for small sums addition. Results showed a five factor structure for the quantity precursors with the major distinction between nonsymbolic and symbolic tasks. The overall model demonstrated good fit, and strong predictive power (R2 = 55%) for addition number combinations. Linguistic and spatial attention domains showed indirect relationships with outcomes, with their effects mediated by symbolic quantity measures. These results have implications for the measurement of mathematical precursors, and yield promise for predicting future math performance.
Keywords: Mathematics, Number Sense, Cognitive, Precursors, Kindergarten, Latent Variable Modeling
Previous efforts have evaluated several potential predictors of mathematical performance in children at the kindergarten level (Geary, Hoard, & Hamson, 1999; Geary, Hamson, & Hoard, 2000; Gersten, Jordan, & Flojo, 2005; Jordan, Kaplan, Olah & Locuniak, 2006; Jordan, Kaplan, Locuniak & Ramineni, 2007; Koponen, Aunola, Ahonen, & Nurmi, 2007; Stock, Desoete, & Roeyers, 2007). Predictors that involve an understanding of quantity, that utilize counting, or that in some way tap “number sense” have recently received much attention, although subdivisions within this area are not always clear. In contrast to such number or quantitative predictors, there is also a large body of research that implicates non-quantitative cognitive skills, particularly domain general skills such as working memory, in the expression of math skill (e.g., Bull, Espy, & Wiebe, 2008; Geary, 2004; Swanson, 2006; Swanson, Jerman, & Zheng, 2008). Language and reading skills are also frequently implicated in discussions of math ability and disability in general (Jordan & Hanich, 2003; Jordan, Kaplan, & Hanich, 2002; Geary, 1993; Gersten et al., 2005), with several studies specifically assessing the role of phonological skills or other reading related skills such as rapid naming as predictors of mathematical outcomes (Geary, Hoard, Byrd-Craven, Nugent, & Numtee, 2007; Hecht, Torgesen, Wagner, & Rashotte, 2001; Krajewski & Schneider, 2009).
While many studies evaluate the relationships of the above types of precursors to math, there are a much smaller number that evaluate them in a multivariate context, and still fewer that do so in the context of a comprehensive model. Thus, little is known about how these sets of precursors relate to one another, which has implications for the extent to which they may have unique contributions to math performance. Recently, however, LeFevre and colleagues (LeFevre, Fast, Skwarchuck, Smith-Chant, Bisanz et al., in press) have proposed a model (the “pathways” model) relating the three types of precursors described above to mathematical achievement, and this serves as a framework for the present study. The current study contributes to existing research by: (a) evaluating the three pathways of LeFevre et al. (in press) at the level of latent rather than observed variables; (b) assessing the quantity domain comprehensively and distinguishing between core and mediating precursors therein; (c) establishing the relationship of these latent variables to a measure of small sums addition; and (d) examining performance in a relatively large and diverse sample at the kindergarten level, after students have been exposed to a formal learning environment, but have not yet completed development of their procedural arithmetic skills. Understanding what predicts early mathematical performance is crucial given the importance of these skills for more complex mathematical skill many years later (Duncan et al., 2007).
The Pathways Model
The pathways model (LeFevre et al., in press) builds on prior work of early cognitive predictors of mathematics, and on neuroanatomical models of how numerical information is processed in the brain (e.g., Dehaene, Piazza, Pinel, & Cohen, 2003). The pathways themselves are cognitive systems important for mathematical competency. The first is specific to number (e.g., quantity) and can be assessed with tasks that involve estimation or magnitude (e.g., comparison tasks, subitizing). The second pathway is through linguistic skill, which is important for representing the symbolic number system and is related to reading. The third pathway is through spatial attention, which has implications for math, but is also important for other outcomes, and which could be operationalized with measures of spatial skills per se, but also could be represented by measures of visuospatial working memory.
LeFevre et al. (in press) evaluated whether these pathways (quantitative, linguistic, spatial) are independent, and whether they contribute differentially to early number skills depending on whether the nature of the task is symbolic (e.g., number naming, where linguistic features are more important) vs. a nonlinguistic arithmetic task (where quantitative features are more important). Results showed that linguistic precursors (vocabulary and phonological awareness) were predictive of number naming but not nonlinguistic arithmetic, whereas quantity (subitizing latency) showed the opposite pattern, and spatial attention (spatial span) was predictive of both. For more complex/conventional measures of mathematics, all pathways were hypothesized to be variably relevant for each outcome, with linguistic/symbolic features especially important. Linguistic and spatial precursors were each significantly related to all conventional mathematics tests, with large beta weights for linguistic precursors; in contrast, quantity precursors showed unique prediction for measures of numeration and calculation, but not geometry and measurement (LeFevre et al., in press). The LeFevre et al. model also suggests that basic precursors may act indirectly on outcomes via magnitude skills and elements of the symbolic number system, consistent with other evidence of mediated effects of cognitive or number-based effects on mathematical outcomes (Koponen et al., 2007; Krajewski & Schneider, 2009).
The present study conceptualizes the three types of precursors described by LeFevre (in press), and makes predictions regarding their relationship to small sums addition. In doing so, the term precursor in the present study is defined as a cognitive skill important for computational skill or word problems but which does not itself involve direct arithmetic, although such precursors vary in their degree of similarity to the criterion (e.g., whether or not symbolic numerals are utilized), and thus may be considered more or less elemental. The analogy in the reading domain is where precursors focus on specific oral language skills (e.g., phonological awareness) that do not involve the child specifically reading words (e.g., Schatschneider, Fletcher, Francis, Carlson, & Foorman, 2004). However, the range of potential quantity precursors is quite varied, and across studies such measures have been considered at different points along the precursor-to-outcome continuum.
Quantity Precursors
In the LeFevre et al. (in press) study, quantity as a precursor was operationalized as subitizing, though magnitude or quantity estimation or comparison are other important methods of assessing quantity (Butterworth, 2005; Dehaene, 2001; Halberda, Feigenson, & Mazzocco, 2008), which in part reflects the distinction between number systems that are of approximate versus exact magnitude (e.g., Feigenson, Dehaene, & Spelke, 2004). In young school aged children, tasks include those of symbolic and nonsymbolic comparison, or tasks that require mapping between the two (e.g., Hollaway & Ansari, 2009; Iuculano, Tang, Hall, & Butterworth, 2008; Mundy & Gilmore, 2009; Rouselle & Noël, 2007). Quantity precursors have been related to the term number sense, although the difficulty in defining this term has been echoed in previous work (e.g., Greeno, 1991; Gersten & Chard, 1999; Gersten et al., 2005). In most cases, number sense is less defined than it is operationalized (see Berch, 2005 for a compilation), though some definitions do appear (e.g., “general facility with using and understanding the meaning of numbers”; Robinson, Menchetti, & Torgesen, 2002). Beyond subitizing and comparisons, additional measures included in studies of number sense include oral counting skills, number identification, sequencing measures, knowledge of counting principles, and more recently, number line representation and set processing (Clarke, Baker, Smolkowski, & Chard, 2008; Clarke & Shinn, 2004; Geary, Bailey, & Hoard, 2009; Geary et al., 1999; Geary et al., 2000; Gelmen & Gallistel, 1978; Gersten et al., 2005; Jordan et al., 2006; Jordan et al., 2007; Koponen et al., 2007; Siegler & Booth, 2004).
Most (but not all) of the measures utilized in the above studies use numeric stimuli, but they vary in the extent to which computation is required, which may be in the form of nonverbal arithmetic, story problems, or number combinations (Ginsburg & Baroody, 2003; Jordan et al., 2006). A key feature of the present study is to focus on predictors which do not require computation in any manner, thus drawing a clearer distinction between predictor and their outcome. Jordan et al. (2006) found their number sense battery to represent two factors using an exploratory factor analytic approach (representing basic number skills and conventional arithmetic), but the present study extends this work by more in-depth assessment of the more basic of these skills, reflecting a wide sampling of how number sense is represented in the literature. Thus, prior to assessing how the quantity pathway relates to other precursors and to math skills, the present study first evaluates a confirmatory factor analytic model that distinguishes among these quantity skills. In terms of the LeFevre et al. (in press), measures which were defined in that study as quantity precursors (e.g., subitizing), early numeracy (e.g., number naming), or as mathematical outcomes (e.g., magnitude comparison) would all be considered potential precursors here, with subitizing and nonsymbolic magnitude comparison considered the most elemental; the remaining precursors could be considered “symbolic mediators” of more complex mathematical skill.
Linguistic Precursors
The linguistic pathway of LeFevre et al. (in press) included measures of vocabulary and phonological awareness. Such measures are most well known with regards to the development of later reading proficiency (Stanovich & Seigel, 1994; Wagner, Torgesen, & Rashotte, 1994; Wolf, Bowers, & Biddle, 2000). In the area of reading, the precursors most extensively investigated are phonological awareness (Anthony, Lonigan, Burgess, Driscoll Bacon, Phillips, & Cantor, 2002; Schatschneider, Francis, Foorman, Fletcher, & Mehta, 1999) and rapid automatized naming (Denckla & Rudel, 1976; Wolf et al., 2000; Wolf, Godberg O’Rourke, Gidney, Lovett, Cirino, & Morris, 2002). Both relate uniquely to untimed decoding skills in children (e.g., Ackerman & Dykman, 1993; Cornwall, 1992; Wolf et al., 2002), particularly at younger ages. For example, Schatschneider et al. (2004) found that these and other Kindergarten precursors of reading accounted for 43% and 56% of the variance in Grade 1 decoding and fluency, respectively. Similar skills have also been shown to be related to math outcomes at young ages (e.g., Koponen et al., 2007; Krajewski & Schneider, 2009). While several language skills are likely to be related to both reading and math, the present study is focused on specific academic precursors, and the use of the most well-known reading precursors provides a clear contrast to the more specific quantity skills thought to be important for math. Information about the interrelationship of these linguistic and quantitative precursors is critical, given the robust correlations between standardized reading and math outcomes (r ≈ .60; McGrew & Woodcock, 2001; Psychological Corporation, 1992; Wilkinson, 1993), and the overlap of difficulties in these academic areas (Badian; 1999; Barbaresi, Katusic, Colligan, Weaver, & Jacobsen, 2005; Silver, Pennett, Black, Fair, & Balise, 1999).
Spatial Attention Precursors
LeFevre et al. (in press) evaluated their final pathway of spatial attention with an adapted spatial span measure where children recall a specific sequence shown to them by the examiner. This and similar measures (e.g., Corsi Blocks forward or backward, and Counting Span) do assess spatial attention, but more typically they are regarded as a component of working memory (WM; Gathercole & Pickering, 2000; Alloway, Gathercole, & Pickering, 2006). In terms of Baddeley and Hitch’s (1974; 1994) influential model, the components assessed would be the visual-spatial sketch pad, or the central executive, depending on specific task parameters, although a close relationship between visuospatial short-term and visuospatial working memory measures have been noted, and show similar relations to measures of executive functioning (Miyake, Friedman, Rettinger, Shah, & Hegarty, 2001). WM is broadly implicated in math task performance (Bull & Scerif, 2001; Gathercole & Pickering, 2000; McLean & Hitch, 1999; Passolunghi & Siegel, 2001; Swanson, 2006; Swanson et al., 2008), where it is viewed as a rate-limiting component for manipulating operational components, for counting, or for the facilitation of retrieval of math facts. Stronger working memory capacity thus increases resources for more complex computation or problem solving. Despite the frequency with which WM is examined in the math literature, there remain inconsistencies with regard to how it is conceptualized and operationalized, and much work remains (see Berch, 2008; Raghubar, Barnes, & Hecht, 2010). In this study, a measure of visuospatial working memory is utilized, consistent with LeFevre et al. (in press).
The Present Study
The present study first demarcates relationships among measures commonly used as number sense (e.g., quantity precursors), but which do not require computation. The corpus of such skills include: subitizing, symbolic comparison/estimation, nonsymbolic comparison/estimation, symbolic labeling/sequencing, rote counting, number line representation, and counting knowledge. In this study, all but subitizing and number line are evaluated. The first hypothesis is that in a confirmatory factor analytic framework, measures loading on these five latent factors are expected to show a good model fit, and specifically better than a unidimensional model, or other alternate models. The distinction among such skills is consistent with that made by LeFevre et al. (in press) in terms of symbolic vs. comparative early number skills, although here there are other nonsymbolic, and a wider range of symbolic measures. However, correlations among these latent variables are expected to be at least of moderate strength, with nonsymbolic comparison/estimation expected to show the weakest relationships with others as it is likely the most distinct.
The next step (Hypothesis 2) uses measures of the above domains to compose non-quantity latent variables of linguistic and spatial attention precursors from measures of phonological awareness, rapid naming, and visuospatial working memory, and also evaluates a larger measurement model containing all three types of precursors from the LeFevre et al. (in press) framework (with strong overlap in terms of how these other precursors are defined). This model is expect to also show good fit, and the strongest relationships are expected between the two linguistic precursors and the four quantity precursors which use symbolic information (symbolic labeling, symbolic comparison, rote counting, and counting knowledge).
Hypothesis 3 relates the three types of precursors (quantity, linguistic, and spatial attention) to small sum number combinations, which represents developing computational skill in kindergartners. Number combinations (and number competence in general) assessed in Kindergarten have been shown to be strongly predictive of later math skill through at least the third grade (Jordan, Kaplan, Ramineni, & Locuniak, 2009), and so understanding the determinants of number combinations can help support the development of early interventions or instruction. Latent variables from each of the precursor domains are expected to relate to this outcome, when they are the only predictors, consistent with the results of LeFevre for their calculations measure. However, in the context of the latent variables of symbolic quantity manipulation, these direct effects of the primary precursors on the outcome would be lessened. In terms of the LeFevre et al. (in press) pathways model then, nonsymbolic comparison is a quantity precursor, and linguistic and spatial factors are also precursors, while other numeric predictors (e.g., labeling, counting) are measures of early numeracy, which in this case function more precisely as symbolic mediators of math skill.
For students beginning to learn formal mathematics, socioeconomic status (often indexed by free lunch receipt) is also related to outcomes (e.g., Jordan et al., 2009), probably as a marker for more informal exposure to and support for number and counting concepts (Clements & Samara, 2008). This may be especially true for verbal/symbolic experiences; for example, Jordan and colleagues found differences between preschoolers of different incomes on verbal, but not nonverbal, arithmetic (Jordan, Huttenlocher, & Levine, 1992; Huttenlocher, Jordan, & Levine, 1994). Jordan et al. (2006) found that the effects of income were predominantly in terms of intercepts rather than slopes, while other recent work however suggests that such differences may be addressable through interventions focused around the number line (e.g., Ramani & Siegler, 2008; Siegler & Ramani, 2008). In this study, differences between income groups on latent variables in the full measurement model were evaluated in the context of Hypotheses 2 and 3; although performance differences in income are expected to occur, these are not expected to alter the relationships of precursors or mediators to the outcome.
Method
Participants
Characteristics of the sample are provided in Table 1. Two-hundred eighty-seven kindergarten students from a single large urban district were originally evaluated, though one child was unavailable for most testing, and so was excluded. Students were from eight schools and 37 classrooms across two consecutive cohorts. However, both cohorts were from the same district, and four schools and eight teachers had students represented in both cohorts. Students were diverse in terms of sex, ethnicity and socioeconomic status, and the nonverbal IQ estimate was normally distributed and average overall. All students were recruited from classrooms where English was the language of instruction, though the language backgrounds of the children were also diverse.
Table 1.
Descriptive Characteristics (N = 286)
| MEASURE | SCORE (SD)/PERCENT |
|---|---|
| Age (Years) | 6.13 (0.3) |
| K-BIT 2 Matrices (Standard Score) | 99.4 (13.8) |
| Sex (% Female) | 48.60 |
| Ethnicity (%) | |
| African American | 50.00 |
| Hispanic | 21.33 |
| Caucasian | 19.58 |
| Asian | 6.64 |
| Lunch Status (% Free/Reduced) | 60.84 |
| Gifted (%) | 13.64 |
| Repeating Kindergarten (%) | 8.74 |
| English Second Language (%) | 10.14 |
| Special Education | 1.40 |
| Parent Education (%) | |
| HS or Lower | 25.52 |
| Above HS Without 4 Year Degree | 20.63 |
| College Degree or Higher | 33.57 |
Note. K-BIT 2 = Kaufman Brief Intelligence Test (2nd Edition). Ethnicities were reported as mixed for 7 children, so percents here do not total to 100. Data was also missing for 15 children regarding Preschool attendance, 1 child for Gifted Status, 18 children for K Repetition, and 58 children for Parent Education.
Measures and Procedures
Students were assessed in their schools on all of the measures at times during the school day convenient to their teachers. Individual session administration time was collected for most students (N = 276), and averaged 34 minutes (SD = 3.3). Examiners were trained on the battery in a fixed order for each 30-minute session that intermixed auditory vs. visual or number vs. non-number stimuli, and verbal vs. manual responses. In most cases, tasks were given in this order within each session, though session (1 vs. 2) varied across students (e.g., to minimize interference where multiple students were assessed in the same large room). Students were assessed in Spring of their Kindergarten year, with assessments ranging over an approximate six- week interval (April and May). Where possible, students were assessed on consecutive days; the mean (and median) interval was 2 days (SD = 5.0).
For purposes of this study, 20 variables were utilized. The measures from which these variables were derived are described below according to the broad pathway they represent, and subdivided by the latent variable they comprise. Table 2 lists these variables and their descriptive characteristics, and Table 3 provides correlations among the observed variables.
Table 2.
Performance on Precursor Measures
| Latent Variable | Measure | Metric | Max Score/ Possible Items |
N | Mean | SD |
|---|---|---|---|---|---|---|
| NONSYMBOLIC COMPARISON |
Dots Compare | Raw/Time (Compare Per Second) | 9 items | 284 | 0.15 | 0.06 |
| Volume Compare | Raw/Time (Compare Per Second) | 9 items | 284 | 0.21 | 0.07 | |
|
| ||||||
| SYMBOLIC COMPARISON |
Number Compare | Raw/Time (Compare Per Second) | 6 items | 284 | 0.16 | 0.08 |
| Quantity Discrimination |
Raw/Time (Correct-Incorrect) | 28 items/60 secs | 283 | 18.1 | 11.4 | |
|
| ||||||
| SYMBOLIC LABELING |
Number Identification | Raw | 15 | 284 | 11.0 | 3.20 |
| Missing Number | Raw/Time (Correct-Incorrect) | 21 items/60 secs | 283 | 8.44 | 5.90 | |
| Sequencing | Raw | 10 | 285 | 5.76 | 2.83 | |
|
| ||||||
| ROTE COUNTING | Oral Counting | Raw/Time (Correct Per Second) | 100/60 secs | 282 | 1.23 | 0.35 |
| Counting Down 10-1 | Raw/Time (Correct Per Second) | 10 items | 282 | 1.67 | 1.26 | |
| Counting Down 20-1 | Raw/Time (Correct Per Second) | 20 items | 280 | 0.63 | 0.61 | |
|
| ||||||
| COUNTING KNOWLEDGE |
Count Out Objects | Raw Errors | 20 possible | 284 | 1.64 | 1.97 |
| Puppet Count Error Detect |
Raw | 3 items | 282 | 1.11 | 1.22 | |
|
| ||||||
| VISUOSPATIAL WORKING MEMORY |
Spatial Working Memory |
Raw Score | 12 | 283 | 2.88 | 2.23 |
| Spatial Working Memory |
Order Invariant Raw Score | 12 | 283 | 5.29 | 3.12 | |
|
| ||||||
| PHONOLOGICAL AWARENESS |
Blending Phonemes Into Words |
Scaled Score | 20 | 282 | 11.5 | 2.81 |
| Phoneme Elision | Scaled Score | 20 | 275 | 9.69 | 2.90 | |
|
| ||||||
| RAPID AUTOMATIZED NAMING |
Rapid Digit Naming | Raw/Time (Correct Per Second) | 36 items | 278 | 1.66 | 0.38 |
| Rapid Letter Naming | Raw/Time (Correct Per Second) | 36 items | 274 | 1.01 | 0.37 | |
| Rapid Object Naming | Raw/Time (Correct Per Second) | 36 items | 282 | 0.80 | 0.23 | |
|
| ||||||
| N/A (OUTCOME) | Small Sums | Raw/Time (Correct-Incorrect) | 55 items/120 secs | 282 | 4.28 | 13.9 |
Note. Nonsymbolic Comparison is the quantity precursor, Visuospatial Working Memory is the spatial precursor, and Phonological Awareness and Rapid Automatized Naming are the linguistic precursors. Other latent variables also assess quantity, but are mediators in the models.
Table 3.
Correlations Among Observed Variables
| NSC | SC | SL | RC | CK | VSWM | PA | RAN | ||||||||||||
|---|---|---|---|---|---|---|---|---|---|---|---|---|---|---|---|---|---|---|---|
| Variable | 1. | 2. | 3. | 4. | 5. | 6. | 7. | 8. | 9. | 10. | 11. | 12. | 13. | 14. | 15. | 16. | 17. | 18. | 19. |
| NonSymbolic Comparison (NSC) | |||||||||||||||||||
| 1. Dots Compare | -- | ||||||||||||||||||
| 2. Volume Compare | .47 | -- | |||||||||||||||||
| Symbolic Comparison (SC) | |||||||||||||||||||
| 3. Number Compare | .36 | .35 | -- | ||||||||||||||||
| 4. Quantity Discrimination | .24 | .30 | .53 | -- | |||||||||||||||
| Symbolic Labeling (SL) | |||||||||||||||||||
| 5.Number Identification | .11 | .21 | .38 | .51 | -- | ||||||||||||||
| 6. Missing Number | .15 | .24 | .40 | .57 | .61 | -- | |||||||||||||
| 7. Sequencing | .11 | .18 | .27 | .48 | .72 | .53 | -- | ||||||||||||
| Rote Counting (RC) | |||||||||||||||||||
| 8.Oral Counting | .16 | .29 | .29 | .52 | .55 | .46 | .46 | -- | |||||||||||
| 9. Counting Down 10-1 | .13 | .16 | .24 | .42 | .47 | .38 | .43 | .60 | -- | ||||||||||
| 10.Counting Down 20-1 | .10 | .14 | .41 | .44 | .59 | .49 | .54 | .56 | .60 | -- | |||||||||
| Counting Knowledge (CK) | |||||||||||||||||||
| 11. Count Out Objects | −.10 | −.13 | −.18 | −.36 | −.32 | −.29 | −.26 | −.29 | −.23 | −.28 | -- | ||||||||
| 12. Puppet Count Errors | −.15 | −.17 | −.24 | −.37 | −.24 | −.29 | −.36 | −.25 | −.25 | −.29 | .22 | -- | |||||||
| Working Memory (WM) | |||||||||||||||||||
| 13. Spatial WM Total | .11 | .21 | .26 | .34 | .38 | .38 | .33 | .32 | .29 | .34 | −.27 | −.34 | -- | ||||||
| 14. Spatial WM Order | .16 | .19 | .22 | .36 | .39 | .42 | .33 | .30 | .26 | .33 | −.23 | −.35 | .85 | -- | |||||
| Phonological Awareness (PA) | |||||||||||||||||||
| 15. Blending Words | .14 | .11 | .21 | .37 | .49 | .30 | .38 | .38 | .38 | .37 | −.22 | −.12 | .21 | .19 | -- | ||||
| 16. Phoneme Elision | .14 | .11 | .30 | .43 | .47 | .34 | .37 | .42 | .42 | .38 | −.28 | −.22 | .32 | .29 | .65 | -- | |||
| Rapid Automatized Naming (RAN) | |||||||||||||||||||
| 17. Rapid Digits | .12 | .26 | .35 | .45 | .58 | .48 | .40 | .50 | .35 | .46 | −.26 | −.17 | .28 | .28 | .49 | .34 | -- | ||
| 18. Rapid Letters | .12 | .21 | .30 | .40 | .55 | .38 | .42 | .44 | .33 | .44 | −.31 | −.14 | .26 | .26 | .45 | .39 | .79 | -- | |
| 19. Rapid Objects Addition |
.23 | .23 | .36 | .38 | .40 | .41 | .28 | .35 | .25 | .36 | −.19 | −.20 | .25 | .28 | .31 | .29 | .72 | .64 | -- |
| 20. Small Sums | .09 | .18 | .35 | .55 | .60 | .57 | .54 | .45 | .42 | .50 | −.33 | −.33 | .40 | .37 | .34 | .40 | .47 | .43 | .41 |
Note. N = 285, pairwise n = 272-285, depending on missing value combinations. Correlations of approximately r = |.12| are significant at p < .05, of r = |.15| at p < .01, and of r = |.22| at p < .0001. See Table 2 and text for further variable descriptions.
Quantity Precursors
Non-Symbolic Comparison
Students were required to make comparison judgments for sets of random dots (9 items) or volumes (9 items). For each, students are shown a pair of stimuli, and while pointing to the individual stimuli, asked “which side (is) shows more, this one, this one, or are they both the same?” Example dot items included: 5 v. 3, 7 v. 7, and 19 v. 15. Example volume items included: L fuller than R but below halfway mark, and R much fuller than L, with R above halfway mark, and L below. After a practice item, students are asked to respond as quickly as possible. Items are not individually timed, but time for each subsection is recorded, and examiners note if the student attempted to actually count (the dots). The variable used from each measure was an index of the number of comparisons per second. This combined variable correlated r = .34 and .59 with the number correct variables for dots and volumes, respectively, and r = −.71 and −.78 with time in seconds for these respective variables; the two variables correlated r = .48 with one another.
Symbolic Comparison
In addition to dot sets and volumes, children were also asked to compare numbers. After a practice trial, six pairs of digits were presented (17 v. 23, 19 v. 18, 32 v. 28, 7 v. 41, 11 v. 9, and 72 v. 59); otherwise administration mirrored that of dots and volumes. The utilized variable was again number of comparisons per second; this variable correlated r = .78 with accuracy, r = −.73 with time. Quantity Discrimination is from AIMSweb (Clarke & Shinn, 2002) and involves 28 sets of two single digit numbers (or the number 10); students are asked to circle the number of each pair that is larger, for as many sets as they are able within a one-minute time limit. Reported alternate form and test-retest reliability is good, ranging from .85 to .93, with strong relations to criterion measures (Clarke & Shinn, 2004; Lembke & Foegen, 2009). Both correct responses and errors are recorded (r = −.60), and the measure used was the total correct-minus incorrect, because the test is time-limited and guessing is possible. In addition, some students (22%) completed all items early, and scores for this measure were prorated, though the original and prorated scores were equivalent (r = .95), and correlations with Simple Sums (below) was virtually unchanged.
Symbolic Labeling
Number Identification has 15 numbers (4, 8, 3, 7, 6, 84, 17, 25, 33, 12, 79, 100, 150, 264, 333). Sample internal consistency for this measure was α = .86. The measure used was total score. Missing Number is from AIMSweb (Clarke & Shinn, 2002) and involves sets of three single digit numbers (or the number 10), with one number missing in the first, second, or third position; students are asked to write in as many missing numbers as they are able within a one-minute time limit. Reported alternate form and test-retest reliability is good, and ranges from .78 to .83, with strong correlations with criterion measures (Clarke & Shinn, 2004; Lembke & Foegen, 2009). Correct responses and errors were recorded (r = −.54), and the dependent measure was a correct minus incorrect score. Sequencing shows 10 sets of three numbers, and students are asked to “read the numbers that you see here, and then tell me the number that goes in the blank space” (that would continue the sequence). Sequences included were: (1) 1,2,3; (2) 33,34,35; (3) 8,7,6; (4) 12, 13, 14; (5) 2,4,6; (6) 17,18,19; (7) 7,6,5; (8) 10,20,30; (9) 8,10,12; and (10) 90,80,70. Internal consistency for this sample was α = .83.
Rote Counting
Oral Counting is adapted from AIMSweb (Clarke & Shinn, 2002) and involves asking a student to count aloud from ‘1’ until told to stop. Reported test-retest values are .78 to .80, with strong criterion correlations (Clarke & Shinn, 2004). Both the total of correctly identified numbers in one minute, and errors, are recorded (r = −.50), which were converted to a numbers-per-second metric, consistent with other measures in the battery; all the measures considered correlated similarly with Small Sums. Counting Down asks the student to count down to 1 from 10 or 20, respectively. The dependent measures are the times taken to say all of the numbers for each subsection (or as many as the student is able), converted to a numbers-per-second metric. In this sample, the median intercorrelation of these three counting speed measures was r = .59, and all three measures correlate similarly with Small Sums.
Counting Knowledge
For Count Out Objects, children see pictures of boxes and cars randomly arrayed on a page, and are told to “count out loud, ALL of the things on this page”. After counting, the child was immediately asked “how many are there altogether”? The five items showed: 9 objects (5 boxes, 4 cars); 13 objects (6 boxes, 7 cars); 15 objects (8 boxes, 7 cars); 14 objects (7 boxes, 7 cars); and 8 objects (4 boxes, 4 cars). Specific attention was paid to errors in counting principles (Gelman & Gallistel, 1978). Abstraction errors were noted when only one type of object (e.g., cars) was counted. Double counting an object was scored as a one-to-one correspondence error. Stable order errors were noted when the child counted out of sequence. Cardinal count errors were noted when the child’s response to the “how many” question did not match the last number of their count. The measure used was the total number of errors committed across these error types (one-to-one, stable order, abstraction, cardinal). Internal consistency in this sample was α = .68. A 10-item version of Puppet Counting follows the general procedure of Geary (Geary, Brown, & Samaranayake, 1991; Geary et. 1999; Geary et al., 2000), in which an array of alternating red and green dots is counted by a puppet, when the puppet counts (a) correctly in typical left-to-right fashion (three trials); (b) correctly though by counting all the red dots and then all the green dots (psuedoerrors, 4 trials); or (c) incorrectly by violating a counting rule (double counting the first dot, 3 trials). Sample internal consistencies were α = .61 (correct), α = .89 (psuedoerrors), and α = .80 (errors). Most students (N = 235) were able to correctly identify correct counting; and given the focus on counting errors in this study, only the error count trials were included for further analyses.
Spatial Attention Precursor
Visuospatial Working Memory was assessed with Spatial Working Memory (adapted from Cirino, 2002) that balances process and storage demands. A series of non-nameable shapes, or a star, are presented one at a time in one of four quadrants of a page. The processing component requires the student to identify (yes or no) whether the shape is a star for each stimuli shown. The storage component involved recalling the position of all the shapes in a series, in sequential order. After two practice trials, where items were taught if necessary, students received three trials within blocks of systematically increasing series lengths (blocks) of 2, 3, 4, and 5. To avoid undue frustration, if students did not correctly recall the order of any of the three trials within a block, the measure was discontinued. Reliability from the original task in a sample of college students was good (α = .84), and the measure was related to math computation (Cirino, 2002). For this sample, internal consistency for the individual trial items was α = .73; also, raw scores across blocks for Trial 1, Trial 2, and Trial 3 were computed separately, and consistency among these three items was α = .76. Two methods of scoring were chosen from among a variety of possibilities (e.g., Conway, Kane, Bunting, Hambrick, Wilhelm, & Engle, 2005). The first is the arguably the most common, a total raw score where a point is awarded for each correct sequence recalled. This measure requires the participant to recall all the correct locations, no incorrect locations, and the exact order. The second, order-free total, score relaxes the final condition (of exact order) but maintains the others. The two variables correlated r = .85. Alternative scoring procedures were explored and these produced similar model results. The processing component was effective (students were 97% accurate at identifying the star), so this score was not further considered.
Linguistic Precursors
Phonological Awareness
This was assessed with two subtests of the Comprehensive Test of Phonological Processing (C-TOPP; Wagner, Torgesen, & Rashotte, 1999), Blending Phonemes into Words and Phoneme Elision. The first task involves the student hearing individual sounds of words, and the student is required to identify the word that results from the blending of these sounds. Elision involves the student hearing a whole word, after which they are asked to remove a sound from the beginning, middle, or end, of the word, and state the result, which is always a new word. Good reliability has been evidenced in this age range (range r = .82 to .93; Wagner et al., 1999), and these measures have good discriminatory power at the end of Kindergarten (Schatschneider et al., 1999). Sample internal consistency was α = .88 for both measures. The measures used were the standard scores from these measures.
Rapid Automatized Naming was also assessed with subtests of the C-TOPP (Wagner et al., 1999). Specifically, Rapid Letter Naming, Rapid Digit Naming, and Rapid Object Naming were utilized. Students see a small set of stimuli that are intermixed and repeated; time taken to identify all the stimuli is recorded. In a dominance study, Rapid Letter Naming was found to be a strong predictor of reading skills at the end of Kindergarten (Schatschneider et al., 2004). Rapid Objects has similar administration properties, and requires retrieval of semantic information known to be important for math (Geary, 1993); also, it does not use alphanumeric stimuli, and is the only measure normed at the age level of this study. These subtests have strong reliability and validity; test-retest reliabilities range from r = .72 to .97 (Wagner et al., 1999). The measure used for each subtest was the time taken to read all stimuli, converted to an item-per-second metric; the median intercorrelation of these three measures in this sample was r = .71.
Small Sums
The stimuli for this task consisted of all 55 single-digit addition problems that sum to 10 or less; to avoid ceiling effects, some slightly larger sums were added to the end of the sheet (though these were not needed). Problems were arranged in vertical format with eight rows of five problems per sheet, over two sheets. Students were asked to complete as many problems as they could in two minutes. Because children were observed to guess and errors were common (51% made more than one error), and given the metric of several of the other measures utilized, the dependent measure was the number correct minus the number incorrect within the time limit. The correlation of correct responses and errors correlated r = −.51.
Preliminary Results and Analyses Description
All analyses were conducted in SAS 9.1 (SAS Institute, 2006) or M-PLUS v. 5 (Muthén & Muthén, 2006). Preliminary analyses included assessment of distributions via graphical and statistical means, and exploration of demographic variables. Most variables had acceptable distributional properties. Of the 20 variables used in the primary structural model, only two had absolute skew values greater than |1|, and five had absolute kurtosis values greater than |1|, and none exceeded |2.5|. Structural equation modeling emphasizes multivariate normality, with excessive kurtosis more problematic (Schumacker & Lomax, 2010). Exploration of univariate distributions, bivariate scatter plots, and regression-based diagnostics revealed one multivariate outlier who was excluded from further analyses (though the conclusions from the results was not altered). In the present case, multivariate kurtosis (Mardia, 1970) was significant (3.09, p < .0005), and therefore models were evaluated with both standard maximum likelihood (ML), and with ML estimation with robust standard errors (MLR). With the MLR estimator, a scaling correction factor (for the chi-square statistic) is noted and which departs from 1; the correction was .972 (small) for the current study. In the Results below, the more common standard ML estimator results are reported, with comments on differences produced with the MLR estimator.
As expected, free lunch status was the strongest demographic characteristic related to performance on the observed measures described above, where those who received free and/or reduced lunch performed below the level of those who did not receive this assistance on most measures. Also, students enrolled in gifted programs outperformed those who were not across most of these same measures. Age was only modestly related these variables (range |r| = .00 to .27, median r = .15). Performances did not vary greatly according to sex; girls outperformed boys on three measures, although gifted enrollment status accounted for these effects. Where schools were represented in both cohorts, students did not differ by cohort on most of the characteristics of Table 1, though more students in the first cohort had repeated kindergarten (p < .05) and were enrolled in gifted programs, p < .0001. The cohorts did not differ on 18 of the 20 variables used in the structural models; they did differ on the missing number and small sums measure, although these differences were accounted for by the difference in enrollment in gifted programs. Based on these results, and given the specific interest in income, both free lunch status and gifted enrollment were considered as covariates in the analyses.
The primary analyses paralleled the hypotheses. Hypothesis 1 considered the dimensionality of the quantity precursors, and compared the proposed 5-factor model with alternative models. Fit for CFA and the structural models were evaluated with several measures, including the comparative fit index (CFI), root mean square error of approximation (RMSEA), standardized root mean square residual (SRMR), and the Akaike and Bayesian Information Criteria (AIC, BIC); Kline (2005) discusses these and other indices of fit. Hypotheses 2 then extended the above results, by evaluating the fit of the linguistic (Phonological Awareness and Rapid Automatized Naming) and spatial (Visuospatial Working Memory) precursors, and then adding these to the model of Hypothesis 1. It is within this full measurement model that the covariates of free lunch and gifted enrollment were evaluated in the context of a multiple indicator multiple cause (MIMIC) model, which assesses the extent to which the groups formed by the covariates differ in their means on the latent variables, and whether these have additional direct effects on the indicator variables (Schumacker & Lomax, 2010). In the final model, the measure of Small Sums was added, and the structural model included the prediction of the small sums outcome by the primary quantity, spatial, and linguistic precursors, adding the symbolic quantity latent variables as additional predictors, and then evaluating the mediating effect of the symbolic variables on the relationship of the precursors to the small sums outcome. Finally, the covariates were added to determine whether there was change in predictive relationships with or without their inclusion.
Results
Hypothesis 1: Confirmatory Factor Analyses of Quantity Precursors
The 12 quantity measures were subjected to a confirmatory factor analysis, involving up to five latent variables. Table 4 presents model fit indices and model comparisons with the maximum likelihood estimator, although fits were highly similar using robust standard errors. Latent correlations are provided in Table 5. Tables 4 and 5 present analogous information for the other hypotheses as well. Figure 1 shows a diagram of the model for Hypothesis 1. All standardized individual parameter loadings, which indicate the correlation of the indicator with its latent parent variable, were acceptable (range r = .44 to .87, median .74). No modifications (e.g., correlated errors) were included, to enhance replicability. As expected, Nonsymbolic Comparison had the weakest relationships to the other latent variables (range |r| = .31 to .56), whereas all other correlations ranged from |r| = .70 to .91. Counting Knowledge correlates negatively with all other latent variables because it is an index of errors, rather than of correct performance. The first hypothesis is represented by Model 1 under “Quantity Measures Only” in Table 4; as shown, alternative models that specify fewer latent variables evidenced worse fit to the data relative to Model 1 (and to the model prior to it), as indicated by the significantly larger Δχ2 values, indicating that more parsimonious models could not be accepted as better or equivalent to the hypothesized model.
Table 4.
Model Fit Indices and Model Comparisons
| Model | df | χ2 | AIC | BIC | CFI | RMSEA | SRMR | Δχ2 |
|---|---|---|---|---|---|---|---|---|
| Quantity Measures Only | ||||||||
| 1. Five Factor Model: Nonsymbolic Comparison, Symbolic Comparison, Symbolic Labeling, Rote Counting, Counting Knowledge |
44 | 115.34* | 8485.43 | 8653.45 | .944 | .075 | .041 | -- |
| 2. Four Factors: Nonsymbolic Comparison, Symbolic Comparison, Symbolic Labeling, All Counting |
48 | 134.55* | 8496.64 | 8650.05 | .933 | .080 | .048 | 19.21* |
| 3. Three Factors: Nonsymbolic Comparison, All Symbolic, All Count |
51 | 190.64* | 8546.73 | 8689.17 | .891 | .098 | .059 | 75.3* |
| 4. Two Factors: Nonsymbolic Comparison, All Others |
53 | 228.61* | 8580.71 | 8715.85 | .863 | .108 | .060 | 113.27* |
| 5. One Factor Model | 54 | 285.94* | 8636.04 | 8767.53 | .819 | .123 | .072 | 170.6* |
| Linguistic and Spatial Precursors | ||||||||
| Phonological Awareness, Rapid Automatized Naming, Visuospatial Working Memory |
11 | 33.20* | 4481.109 | 4568.685 | .980 | .084 | .032 | -- |
| Measurement Model | ||||||||
| All 8 Latent Variables | 124 | 262.20* | 12745.63 | 13056.10 | .949 | .063 | .041 | -- |
| Structural Models | ||||||||
| 1. Full Model | 135 | 273.75* | 13368.61 | 13715.60 | .952 | .060 | .040 | -- |
| 2. Cognitive Prediction | 139 | 335.83* | 13422.69 | 13755.06 | .932 | .070 | .048 | 62.08* |
| 3. No Direct Effects (Final Model) | 139 | 277.77* | 13364.63 | 13697.01 | .952 | .059 | .040 | 4.02ns |
| 4. No Mediator Relationships | 145 | 343.82* | 13418.68 | 13729.14 | .931 | .069 | .047 | 70.07* |
Note. N = 285. See text, Table 2, and Figure 1 for composition of latent variables. Models under the header “Quantity Measures Only” refer to CFA of combinations of only those observed variables; “Linguistic and Spatial Precursors” refers to the CFA for these non-quantity precursors (Hypothesis 1). “Measurement Model” refers to all predictor variables (Hypothesis 2). Models under the header “Structural Model” add the Small Sums outcome, and are used to evaluate Hypothesis 3. All Counting = indicators of Rote Counting and Counting Knowledge; All Symbol = indicators of Symbolic Comparison and Symbolic Labeling. df = degrees of freedom; χ2 = chi-square value; AIC = Akaike information criteria; BIC = Bayesian information criteria; CFI = Comparative Fit Index; RMSEA = root mean square error of approximation; SRMR = standardized root-mean-square residual; Δχ2 = Change in value of chi-square relative to Model 1; in text, Model 4 is compared to Model 3. All chi-square values, and chi-square change values, are significant, p < .001.
Table 5.
Correlations for Latent Variables (and with Small Sums)
| Variable | NSC | SC | SL | RC | CK | VSWM | PA | RAN | SS |
|---|---|---|---|---|---|---|---|---|---|
| Nonsymbolic Comparison (NSC) |
-- | ||||||||
| Symbolic Comparison (SC) |
.54 | -- | |||||||
| Symbolic Labeling (SL) | .31 | .73 | -- | ||||||
| Rote Counting (RC) | .33 | .70 | .80 | -- | |||||
| Counting Knowledge (CK) |
−.45 | −.91 | −.76 | −.76 | -- | ||||
| Visuospatial Working Memory (VSWM) |
.27 | .45 | .49 | .44 | −.72 | -- | |||
| Phonological Awareness (PA) |
.22 | .57 | .65 | .64 | −.59 | .35 | -- | ||
| Rapid Automatized Naming (RAN) |
.34 | .60 | .68 | .63 | −.54 | .35 | .57 | -- | |
| Small Sums | .22 | .64 | .71 | .60 | .74 | .42 | .48 | .52 | -- |
Figure 1.
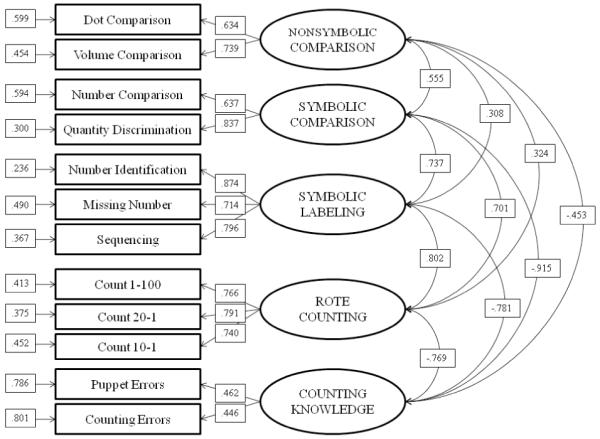
Confirmatory Factor Analysis of Quantity Measures
See Tables 2 and 3 for description of measures, and Table 4 for model fit. Parameter estimates are from the completely standardized solution. Rectangular boxes represent observed variables, and ovals latent variables. Double-headed arrows to the right are factor correlations (cf. with Table 5). Numbers along the outside of the boxes are residual variances (e.g., .300 is the residual variance for the Quantity Discrimination measure). Paths from ovals to boxes are standardized regression parameter loadings (e.g., .637 is the loading of Number Comparison on the Symbolic Comparison factor; Symbolic Comparison predicts 64% of the variance in the Number Comparison measure).
Hypothesis 2: Cognitive and Full Measurement Model
The structure of the linguistic and spatial attention precursors was also examined, and evidenced good fit with the data. Figure 2 shows the results of this CFA, and model fit is shown in Table 4. When all variables were included together (19 indicators and 8 latent variables), model fit continued to be acceptable; again, model fits are shown in Table 4. It was expected that the symbolic mediators (Symbolic Comparison, Symbolic Labeling, Rote Counting, Counting Knowledge) would relate more strongly to the two linguistic precursors (Phonological Awareness and Rapid Automatized Naming) than to the spatial attention and quantity factors, and this appeared to be the case: the median of the absolute value of the correlations of the mediators with linguistic precursors was .62, and with the other precursors it was .45 (see Table 5).
Figure 2.
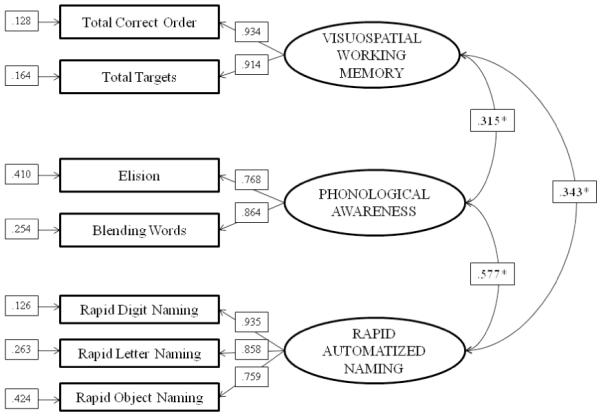
Confirmatory Factor Analysis of Cognitive Measures
See Tables 2 and 3 for description of measures, and Table 4 for model fit. Parameter estimates are from the completely standardized solution. Rectangular boxes represent observed variables, and ovals latent variables. Double-headed arrows to the right are factor correlations (cf. with Table 5). Numbers along the outside of the boxes are residual variances (e.g., .410 is the residual variance for the Elision measure). Paths from ovals to boxes are standardized regression parameter loadings (e.g., .768 is the loading of Elision on the Phonological Awareness factor; Phonological Awareness predicts 77% of the variance in the Elision measure).
There were two covariates considered, free lunch and gifted enrollment, and each was considered separately before combining them. Latent variables were regressed on the covariate, with significant parameters indicating that the levels of the covariate are different with regard to the latent variable. Adding covariates in this manner is not expected to change loadings of indicators onto factors or factor inter-correlations. Direct effects of covariates on indicators would suggest that the indicator is not invariant with regard to intercept means, because the levels of the covariates differ on the observed variable even after controlling for the latent variable. In the present case, few such direct effects were expected.
When the free lunch variable was added to the model, overall model fit of the measurement model, factor loadings of indicators, and factor correlations, did not change substantially. Lunch status was a significant predictor of all the latent variables, p < .05, with those not receiving free lunch outperforming those who did; however, there were few significant direct effects of covariates on the observed variables (for missing number on free lunch, modification index = 4.5; and for counting down 10-1 on free lunch, modification index = 7.2). Because model improvement was overall quite modest with these effects, in general the indicators were considered to be invariant with regard to the free lunch covariate. The situation was similar when gifted enrollment was evaluated, and gifted enrollment was predictive of all latent variables except Nonsymbolic Comparison. Results were also not different when the covariates were evaluated together, except that in this case, neither covariate was significantly predictive of Nonsymbolic Comparison. As a result of these analyses, it was concluded that both free lunch and gifted enrollment are related to the latent variables in the measurement model, but that the observed variables are invariant with regard to these covariates. In later models, the more important role of these covariates was to determine whether they impacted the relationships of precursors/mediators to the outcome variable.
Hypothesis 3: Prediction of Small Sum Number Combinations
The final step added the Small Sums outcome measure to the model. Model fits are presented in Table 4 under the header “Structural Models”. The most complex model (fewest df) is with Small Sums regressed on all eight latent variables (Model 1, Full Model). Other models are nested within this model. Correlations among latent variables as well as each of their relationships with Small Sums are presented in Table 5.
When Small Sums is regressed only on the four quantity, linguistic, and spatial attention precursors (Model 2, Cognitive Prediction), Visuospatial Working Memory (β = .204, t = 3.589, p < .001), Phonological Awareness (β = .292, t = 3.816, p < .001), and Rapid Automatized Naming (β = .271, t = 3.727, p < .001), were all significant predictors, and Nonsymbolic Comparison was not, β = .051, t = 0.744, p = .45. The overall R2 was .416, but this model showed a significantly worse fit to the data than the full model, Δχ2(4) = 62.08, p < .0001.
The final model is one in which the mediators are regressed on the precursors, and the direct paths of the precursors to the outcome are set to zero. This model is pictured in Figure 3 and its fit statistics are presented in Table 4 as “Model 3, No Direct Effects (Final Model)”. The fit of this final model was not different from Model 1, p > .05, consistent with the mediation hypothesis. The precursors predicted the mediators substantially (R2 range .55 to .61), and the relationships among the mediators were substantially reduced relative to those of the full model (Model 1), from |r| = .70 to .91, median r = .76 (see Table 5), to |r| = .38 to .78, median r = .45. As shown in Figure 3, the latent mediators were together highly predictive of Small Sums performance (R2 = .55), with Symbolic Labeling as the only mediator with a significant total effect in the context of the other mediators, β = .491, t = 4.113, p < .001. For the precursors, the total effects (which in this case equal the total indirect effects), were significant for Phonological Awareness, β = .237, t = 4.350, p < .001, for Rapid Automatized Naming, β = .256, t = 4.850, p < .001, and for Visuospatial Working Memory, β = .250, t = 4.533, p < .001. Examination of specific indirect effects revealed that Symbolic Labeling was the primary contributor to these effects, for Phonological Awareness, β = .161, t = 3.147, p = .002, for Rapid Automatized Naming, β = .203, t = 3.361, p = .001, and for Visuospatial Working Memory, = .107, t = 2.811, p = .005, though the indirect effects were in a similar direction (the total indirect effects were substantially larger than the specific indirect effects). A more restrictive model which presumes that all of the interrelationships among mediators are accounted for by the precursors was not supported (Model 4, No Mediator Relationships), Δχ2(6) = 66.05, p < .0001. Therefore, Model 3 (No Direct Effects) was retained as the final model.
Figure 3.
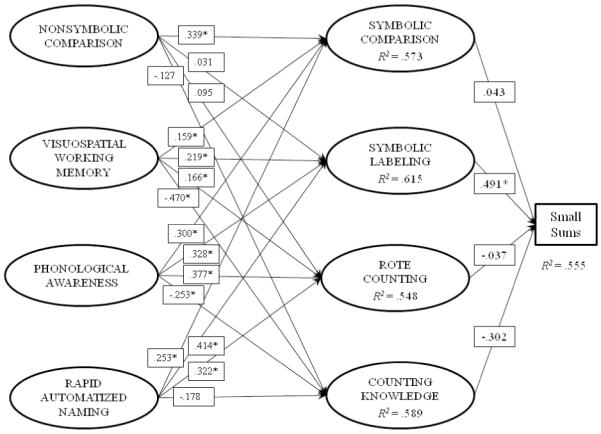
Final Structural Model of Precursors (Including Mediators), with Small Sums
See Tables 2 and 3 for description of measures, Table 4 for model fit, and Table 5 for latent correlations. Loadings and residual variances are not shown, but do not depart substantially from the values for these indicators relative to Figures 1 and 2. Rectangular boxes represent observed variables (Small Sums), and ovals latent variables. R2 values within ovals (and for Small Sums) are the extent to which variance in these variables is predicted by variables it is regressed on; residual variance is 1-R2 for these values. Parameter estimates are from the completely standardized solution. Directional paths emanating from ovals (single-headed arrows) are beta weights (e.g., 1 SD change in Symbolic Labeling leads to a .459 SD change in Small Sums). Indirect effects discussed in text are obtained by multiplying coefficients (e.g., the indirect effect of Visuospatial Working Memory on Small Sums via Symbolic Labeling is .219*.491 = .107; total indirect effects are the sum of specific indirect effects).
The results overall and the pattern of significant individual parameters did not change substantively when the estimator with robust standard errors was employed. Finally, the two covariates (lunch and gifted status) were included in models, separately and together, as having direct effects only, or also allowing for indirect effects of these variables through the mediators. Although gifted enrollment had a direct effect on the Small Sums outcome measure when included as such, the increase in R2 was very small (1%), the covariates were in general not predictive of the mediating latent variables in the context of the precursors, and there were no indirect effects of the covariates on Small Sums via the mediating variables (all p > .05).
Discussion
The present study sought to clarify relationships within and among mathematical precursors in quantitative, linguistic, and spatial attention domains, similar to those defined within the LeFevre et al. (in press) framework, and to evaluate their predictive relationships with addition at Kindergarten. Hypothesis 1 was supported in that the quantity predictors represented multiple factors. Hypothesis 2 was supported in that measures of linguistic and spatial skill also segregated into their expected latent variables, and fit in the context of the full measurement model. Hypothesis 3 was supported in that key precursors were predictive of addition number combinations, but this direct effect was mediated by symbolic quantity variables. Student characteristics such as free lunch status and gifted status were related to latent means, but did not alter the pattern of predictive relationships.
The model that separated quantity skills from one another (Five Factor Model, Table 4; Figure 1) fit the data well. Nonsymbolic comparison showed the smallest intercorrelation with the other four latent quantity skills, each of which utilized symbolic content, either through comparison, labeling, or counting. This key difference of nonsymbolic vs. symbolic content is a topic which has received recent attention (e.g., Holloway & Ansari, 2009; Mundy & Gilmore, 2009; Rouselle & Noël, 2007). In those studies, math skills are typically more strongly associated with precursors that are symbolic in content, as was the case in the present study. Halburda et al. (2008) did find that nonsymbolic skill was related to math skill over a large time span, although those predictive relationships were postdictive and involved a more complex comparison task. Moreover, whereas both Holloway and Ansari (2009) and Mundy and Gilmore (2009) found that the nonsymbolic distance effect was unrelated to both the symbolic distance effect and to mathematical outcomes, the latter study found that nonsymbolic accuracy was related to their outcome measure. Relationships among symbolic quantity measures were in general strong, consistent with the work of others. For example, Koponen et al. (2009) found a correlation of .70 between their number concept and counting skills composite measures, which is of similar range to the counting and symbolic latent variables as shown in Table 5.
Jordan et al. (2006; 2009) have developed a useful number sense measure across several studies, but results are difficult to compare directly with this study given that the measures serve different purposes. The Jordan et al. studies are focused on growth, identification, and overall predictive power, and so different item types were able to be combined. Also, while there is some overlap in the types of skills assessed, the overlap is not particularly strong, given the inclusion of arithmetic (both verbal and nonverbal) in that assessment. Jordan et al. (2006) did find some dimensionality amongst their measures (separating symbolic from nonsymbolic items), which is not inconsistent with the present results; later studies used a more focused collection of items. Therefore, while the Jordan et al. studies (2006; 2009) suggest less dimensionality that the present study with regard to number sense, it is clear that future work with these types of measures is needed to more thoroughly evaluate their relational structure and their development in children.
When additional cognitive precursors in the linguistic and spatial attention domains were added to the quantity variables, the measurement model also evidenced good fit to the data (Table 4). The relationships of these precursors to the quantity precursors ranged in value from |r| = .22 to .34 for nonsymbolic quantity, and from |r| = .44 to .72 for symbolic quantity (Table 5). Counting knowledge appeared more strongly related to visuospatial working memory relative to the linguistic precursors, whereas the other symbolic quantity variables showed the opposite pattern. The number of studies which utilize both quantity and non-quantity predictors together are small, but some of the extant studies do show strong relationships between phonological processing and number sense or counting skill, as well as with math outcomes (Koponen et al., 2007; Krajewski & Schneider, 2009).
Whereas the first two hypotheses focused on the interrelationships among predictors, Hypothesis 3 focused on the relationships of these predictors to small sums performance, and overall predictive power was strong. This was encouraging given that the outcome measure was restricted in content, and performed with pencil and paper and under a time limit. As shown in Table 5, all the latent variables were significantly related to small sums performance, with the weakest relationships evidenced for nonsymbolic comparison. This overall pattern of results is expected because individual tasks were chosen given previous demonstrations of their relevance to math achievement outcomes. Also, nonsymbolic skill typically shows weak direct effects to outcomes, whereas each of the other skills has shown more robust relationships.
Hypothesis 3 posited that the impact of the most elemental precursor skills would be more indirect than direct, via quantity predictors that are more closely tied to the outcome. This was in fact the pattern that was obtained, where phonological awareness, rapid naming, and visuospatial working memory each showed indirect, though not direct, effects on small sums. It was the case that in Model 3 (Cognitive Prediction, see Table 4), where the symbolic mediators did not have paths to the outcome, linguistic and spatial (though not quantitative precursors) were significantly predictive of addition. In the LeFevre et al. (in press) study, all three types of precursors were significant predictors of their conventional calculation measure, although those students were older, and the quantitative precursors utilized were more varied than those assessed here. In the final model of this study, the indirect effects of the precursors were mediated only by symbolic labeling. However, the total indirect effect was larger than that of symbolic labeling alone by 50% or more (e.g., the indirect β for phonological awareness was .140 for symbolic labeling, but .238 in total). Thus, these indirect effects appeared to be additive rather than in competition with one another, although future studies are needed to further elaborate these relationships.
For these most basic written addition skills then, the general effect of the precursors was to improve symbolic facility rather than impact the outcome in a direct manner. Previous research has demonstrated similar patterns. For example, Krajewski and Schneider (2009) found that phonological awareness and visuospatial sketch pad measures showed significant zero-order correlations with their math outcome, but those measures were not significant in the context of a path analytic framework involving their number-quantity measures, which may reflect similar meditational processes. LeFevre et al. (in press) showed a distinct pattern of the three pathways toward early numeracy indicators of number naming and nonlinguistic arithmetic, although these sets of measures were later combined for predicting outcomes. In the present study, the complete pattern of relations between most elemental precursors and the symbolic mediators was less clear than in that study, although not inconsistent. The pathways model would expect that for such symbolic mediators, linguistic and spatial attention precursors (but not quantitative ones) would demonstrate significant contributions, with the contribution of linguistic precursors being strongest; this pattern was obtained in the present study as well. More work is needed to further characterize the potential unique role of the most basic quantity precursors, particularly those that are nonsymbolic.
By examining an array of not only quantity skills, but also both linguistic and working memory precursors, the present study adds to the literature demonstrating the relationships of each of these cognitive factors to mathematical performance (Bull & Scerif, 2001; Gathercole & Pickering, 2000; Gersten et al., 2005; Jordan & Hanich, 2003; Swanson et al., 2008), and by documenting their indirect, rather than direct, impact. The relationships between linguistic factors and small sums were expected not only because of the role of semantic retrieval in early math performance, but also given the importance of the present linguistic precursors for reading, and the known strong relations among reading and math achievement outcomes (McGrew & Woodcock, 2001; Psychological Corporation, 1992; Wilkinson, 1993). Similarly, the relationships found in this study between the visuospatial working memory factor to the small sums math outcome were consistent with other studies (Bull et al., 2008; De Smedt, Janssen, Bouwens, Verschaffel, Boets, & Ghesquiere, 2009; LeFevre et al., in press). Clearly, however, further work is needed to elucidate these effects, over time, and for additional types of outcomes. For older students, and/or more complex computational or problem solving skills, it is possible that working memory and other cognitive skills might exert not only indirect effects, but also further direct effects on math outcomes.
Within the context of the models of Hypotheses 2 and 3, the impact of student characteristics was also evaluated. The fact that income level (as indexed by free lunch status) was associated with stronger academic performance is consistent with previous research (Jordan et al., 1992; Jordan et al., 2006; Jordan et al., 2009). Gifted status was also associated with predictor variables. However, the effect of these covariates appeared to be at the level of mean differences, rather than altering the pattern of relationships among quantity, linguistic, or spatial precursors, with the mediating variables or with the outcome.
The results of the current study must be considered within the context of some limitations. Alternative assessments of the number domain may have yielded a somewhat different pattern of results, which is relevant given the lack of consensus around the way that the construct of number sense is operationalized. A wider range of more systematically chosen stimuli, in combination with other assessments such as subitizing, may have yielded more robust relationships with the nonsymbolic variable. More coverage of the spatial attention domain would also likely have added to findings, either by assessing the cognitive construct of attention according to a theoretical model (e.g., Posner & Peterson, 1990), by adding other spatial measures, or by more completely assessing working memory (e.g., according to either a tripartite model such as that of Baddeley & Hitch, 1974; 1994; or an executive component model such as that of Miyake, Friedman, Emerson, Witzki, Howerter, & Wager, 2000). Thus, replicating these results with alternative assessments of the latent domains described here would likely yield quite useful information. Finally, other domains which have been identified as showing relationships to math (e.g., processing speed, behavioral inattention) were not evaluated in the current models. Nonetheless, the present study was able to assess a variety of skills from a wide range of skill domains that have relevance for the outcome as assessed here. Although the idea that number sense is a multidimensional construct is not new, few studies systematically evaluate this dimensionality. A contribution of this study was its strategy of attempting to differentiate among such measures, which could help to refine instruments used to identify students as struggling, or to do so more specifically.
The present study also employed only a single outcome measure. The task chosen emphasized written number combinations, which are potentially influenced by a host of factors including attention, fine motor skill, and the fact that such problems are not universally internalized at the age of these participants. However, the focus of the present study was primarily on the potential precursors themselves, and the present task was chosen as an example of the computational skills that are emerging at the end of Kindergarten; its format was also relevant because it mimics later conventional mathematical assessments. Despite this limitation, the predictive power was strong, and consistent with expectations. The present study contributes to our understanding of the skills underlying small sums, which is important given their predictive power for later math skill several years later (Jordan et al., 2009). Nonetheless, including other outcomes would have allowed for the evaluation of prediction patterns outside of those found here; it is possible that symbolic labeling does not mediate all computational skills, or that different mediators are relevant for different outcomes. Further work is needed to expand the types of outcomes examined, as well as in predicting future performance, particularly across other academic domains (e.g., reading). For example, it may be that what is common between math and reading precursors also accounts for what is common among math and reading outcomes (e.g., Koponen et al., 2007). The present study would suggest that measures that utilize symbolic content are the strongest candidates for such overlap.
In sum, the present study contributes to existing literature through its use of a wide variety of precursors, particularly within the quantitative domain, that fit within the context of a theoretical model of how such precursors impact math performance (LeFevre et al., in press), utilizing a structural modeling framework. The present study separated number sense assessments into nonsymbolic precursors and symbolic mediators, and established indirect (rather than direct) contributions for linguistic and spatial precursors. The present results provide a building block from which future studies might effectively elaborate on similarities and differences among quantitative and non-quantitative precursors of mathematical skills, and their relationship to a wider range of outcomes across academic domains.
Acknowledgments
This work was supported by grant #HD050422 from the National Institute of Child Health and Human Development (NICHD) awarded to the University of Houston. The attitudes and opinions expressed in this manuscript are those of the author and do not necessarily reflect that of the NICHD or of the National Institutes of Health. The author would like to thank Maria Hernandez, the school personnel and especially the students who made this research possible.
Footnotes
Publisher's Disclaimer: This is a PDF file of an unedited manuscript that has been accepted for publication. As a service to our customers we are providing this early version of the manuscript. The manuscript will undergo copyediting, typesetting, and review of the resulting proof before it is published in its final citable form. Please note that during the production process errors may be discovered which could affect the content, and all legal disclaimers that apply to the journal pertain.
References
- Ackerman PT, Dykman RA. Phonological processes, confrontation naming, and immediate memory in dyslexia. Journal of Learning Disabilities. 1993;26:597–609. doi: 10.1177/002221949302600910. [DOI] [PubMed] [Google Scholar]
- Alloway TP, Gathercole SE, Pickering SJ. Verbal and visuo-spatial short-term and working memory in children: Are they separable? Child Development. 2006;77(6):1698–1716. doi: 10.1111/j.1467-8624.2006.00968.x. [DOI] [PubMed] [Google Scholar]
- Anthony JL, Lonigan CJ, Burgess SR, Driscoll Bacon K, Phillips BM, Cantor BG. Structure of preschool phonological sensitivity: Overlapping sensitivity to rhyme, words, syllables, and phonemes. Journal of Experimental Child Psychology. 2002;82:65–92. doi: 10.1006/jecp.2002.2677. [DOI] [PubMed] [Google Scholar]
- Baddeley AD, Hitch GJ. Working memory. In: Bower G, editor. The psychology of learning and motivation. Vol. 8. Academic Press; San Diego, CA: 1974. pp. 47–90. [Google Scholar]
- Baddeley AD, Hitch GJ. Developments in the concept of working memory. Neuropsychology. 1994;8:485–493. [Google Scholar]
- Badian NA. Persistent arithmetic, reading or arithmetic and reading disability. Annals of Dyslexia. 1999;49:45–70. [Google Scholar]
- Barbaresi WJ, Katusic SK, Colligan RC, Weaver AL, Jacobsen SJ. Math learning disorder: Incidence in a population-based birth cohort, 1976-1982, Rochester, Minn. Ambulatory Pediatrics. 2005;5:281–289. doi: 10.1367/A04-209R.1. [DOI] [PubMed] [Google Scholar]
- Berch DB. Making sense of number sense: Implications for children with mathematical disabilities. Journal of Learning Disabilities. 2005;38(4):333–339. doi: 10.1177/00222194050380040901. [DOI] [PubMed] [Google Scholar]
- Berch DB. Working memory and mathematical cognitive development: Limitations of limited capacity resource models. Developmental Neuropsychology. 2008;33:427–446. doi: 10.1080/87565640801982494. [DOI] [PubMed] [Google Scholar]
- Bull R, Espy KA, Wiebe SA. Short-term memory, working memory, and executive functioning in preschoolers: Longitudinal predictors of mathematical achievement at age 7 years. Developmental Neuropsychology. 2008;33:205–228. doi: 10.1080/87565640801982312. [DOI] [PMC free article] [PubMed] [Google Scholar]
- Bull R, Scerif G. Executive functioning as a predictor of children’s mathematics ability: Inhibition, switching, and working memory. Developmental Neuropsychology. 2001;19:273–293. doi: 10.1207/S15326942DN1903_3. [DOI] [PubMed] [Google Scholar]
- Butterworth B. The development of arithmetic abilities. Journal of Child Psychology and Psychiatry. 2005;46:3–18. doi: 10.1111/j.1469-7610.2004.00374.x. [DOI] [PubMed] [Google Scholar]
- Cirino PT. Relation of working memory and inhibition to executive function and academic skill. Journal of the International Neuropsychological Society. 2002;8:230. Journal. [Google Scholar]
- Clarke B, Baker S, Smolkowski K, Chard D. An analysis of early numeracy curriculum-based measurement: Examining the role of growth in student outcomes. Remedial and Special Education. 2008;29:46–57. [Google Scholar]
- Clarke B, Shinn MR. Test of Early Numeracy (TEN): Administration and scoring of AIMSweb Early Numeracy measures for use with AIMSweb. Edformation; Eden Prairie, MN: 2002. [Google Scholar]
- Clarke B, Shinn M. A preliminary investigation into the identification and development of early mathematics curriculum-based measurement. School Psychology Review. 2004;33:234–248. [Google Scholar]
- Clements DH, Samara J. Experimental evaluation of the effects of a research-based preschool mathematics curriculum. American Educational Research Journal. 2008;45(2):443–494. [Google Scholar]
- Conway ARA, Kane MJ, Bunting MF, Hambrick DZ, Wilhelm O, Engle RW. Working memory span tasks: A methodological review and user’s guide. Psychonomic Bulletin & Review. 2005;12(5):769–786. doi: 10.3758/bf03196772. [DOI] [PubMed] [Google Scholar]
- Dehaene S. Precis of the number sense. Mind & Language. 2001;16(1):16–36. [Google Scholar]
- Dehaene S, Piazza M, Pinel P, Cohen L. Three parietal circuits for number processing. Cognitive Neuropsychology. 2003;20:487–506. doi: 10.1080/02643290244000239. [DOI] [PubMed] [Google Scholar]
- Denckla MB, Rudel RG. Rapid automatized naming (R.A.N.): Dyslexia differentiated from other learning disabilities. Neuropsychologia. 1976;14:471–479. doi: 10.1016/0028-3932(76)90075-0. [DOI] [PubMed] [Google Scholar]
- De Smedt B, Janssen R, Bouwens K, Verschaffel L, Boets B, Ghesquiere P. Working memory and individual differences in mathematics achievement: A longitudinal study from first grade to second grade. Journal of Experimental Child Psychology. 2009;103:186–201. doi: 10.1016/j.jecp.2009.01.004. [DOI] [PubMed] [Google Scholar]
- Duncan GJ, Dowsett CJ, Claessens A, Magnuson K, Huston AC, Klebanov P, Pagani LS, Feinstein L, Engel M, Brooks-Gunn J, Sexton H, Duckworth K, Japel C. School readiness and later achievement. Developmental Psychology. 2007;43(6):1428–1446. doi: 10.1037/0012-1649.43.6.1428. [DOI] [PubMed] [Google Scholar]
- Feigenson L, Dehaene S, Spelke E. Core systems of number. TRENDS in Cognitive Science. 2004;8(7):307–314. doi: 10.1016/j.tics.2004.05.002. [DOI] [PubMed] [Google Scholar]
- Gathercole SE, Pickering SJ. Assessment of working memory in six- and seven-year-old children. Journal of Educational Psychology. 2000;92(2):377–390. doi: 10.1348/000709900158047. [DOI] [PubMed] [Google Scholar]
- Geary DC. Mathematical disabilities: Cognitive, neuropsychological, and genetic components. Psychological Bulletin. 1993;114:345–362. doi: 10.1037/0033-2909.114.2.345. [DOI] [PubMed] [Google Scholar]
- Geary DC. Mathematics and learning disabilities. Journal of Learning Disabilities. 2004;37:4–15. doi: 10.1177/00222194040370010201. [DOI] [PubMed] [Google Scholar]
- Geary DC, Bailey DH, Hoard MK. Predicting mathematical achievement and mathematical learning disability with a simple screening tool: The number sets test. Journal of Psychoeducational Assessment. 2009;27(3):265–279. doi: 10.1177/0734282908330592. [DOI] [PMC free article] [PubMed] [Google Scholar]
- Geary DC, Brown SC, Samaranayake VA. Cognitive addition: A short longitudinal study of strategy choice and speed of processing differences in normal and mathematically disabled children. Developmental Psychology. 1991;27:787–797. [Google Scholar]
- Geary DC, Hamson CO, Hoard MK. Numerical and arithmetical cognition: A longitudinal study of process and concept deficits in children with learning disability. Journal of Experimental Child Psychology. 2000;77:236–263. doi: 10.1006/jecp.2000.2561. [DOI] [PubMed] [Google Scholar]
- Geary DC, Hoard MK, Byrd-Craven J, DeSoto MC. Strategy choices in simple and complex addition: Contributions of working memory and counting knowledge for children with mathematical disability. Journal of Experimental Child Psychology. 2004;88:121–151. doi: 10.1016/j.jecp.2004.03.002. [DOI] [PubMed] [Google Scholar]
- Geary DC, Hoard MK, Hamson CO. Numerical and arithmetical cognition: Patterns of functions and deficits in children at risk for a mathematical disability. Journal of Experimental Child Psychology. 1999;74:213–239. doi: 10.1006/jecp.1999.2515. [DOI] [PubMed] [Google Scholar]
- Ginsburg HP, Baroody AJ. Test of Early Mathematics Ability (TEMA-3) Pro-Ed.; Austin, TX: 2003. [Google Scholar]
- Gelman R, Gallistel CR. The Child’s Understanding of Number. Harvard University Press; Cambridge, MA: 1978. [Google Scholar]
- Gersten R, Chard D. Number sense: Rethinking arithmetic instruction for students with mathematical disabilities. The Journal of Special Education. 1999;33(1):18–28. [Google Scholar]
- Gersten R, Jordan NC, Flojo JR. Early identification and interventions for students with mathematics difficulties. Journal of Learning Disabilities. 2005;38(4):293–304. doi: 10.1177/00222194050380040301. [DOI] [PubMed] [Google Scholar]
- Greeno JG. Number sense as situated knowing in a conceptual domain. Journal for Research in Mathematics Education. 1991;22(3):170–218. [Google Scholar]
- Halberda J, Mazzocco MMM, Feigensen L. Individual differences in non-verbal number acuity correlate with maths achievement. Nature. 2008;455(2):665–668. doi: 10.1038/nature07246. [DOI] [PubMed] [Google Scholar]
- Hecht SA, Torgesen JK, Wagner RK, Rashotte CA. The relations of phonological processing abilities and emerging individual differences in mathematical skills: A longitudinal study from second to fifth grades. Journal of Experimental Child Psychology. 2001;79:192–227. doi: 10.1006/jecp.2000.2586. [DOI] [PubMed] [Google Scholar]
- Holloway ID, Ansari D. Mapping numerical magnitudes onto symbols: The numeric distance effect and individual differences in children’s mathematical achievement. Journal of Child Experimental Psychology. 2009;103:17–29. doi: 10.1016/j.jecp.2008.04.001. [DOI] [PubMed] [Google Scholar]
- Huttenlocher J, Jordan NC, Levine SC. A mental model for early arithmetic. Journal of Experimental Psychology: General. 1994;123(3):284–296. doi: 10.1037//0096-3445.123.3.284. [DOI] [PubMed] [Google Scholar]
- Iuculano T, Tang J, Hall CWB, Butterworth B. Core information processing deficits in developmental dyscalculia and low numeracy. Developmental Science. 2008;11(5):669–680. doi: 10.1111/j.1467-7687.2008.00716.x. [DOI] [PubMed] [Google Scholar]
- Jordan N, Hanich L. Characteristics of children with moderate mathematics deficiencies: A longitudinal perspective. Learning Disabilities Research and Practice. 2003;18:213–221. [Google Scholar]
- Jordan NC, Huttenlocher J, Levine SC. Differential calculation abilities in young children from middle- and low-income families. Developmental Psychology. 1992;28(4):644–653. [Google Scholar]
- Jordan N, Kaplan D, Hanich L. Achievement growth in children with learning difficulties in mathematics: Findings of a two-year longitudinal study. Journal of Educational Psychology. 2002;94:586–597. [Google Scholar]
- Jordan NC, Kaplan D, Locuniak MN, Ramineni C. Predicting first-grade math achievement from developmental number sense trajectories. Learning Disabilities Research and Practice. 2007;22:36–46. [Google Scholar]
- Jordan NC, Kaplan D, Olah LN, Locuniak MN. Number sense growth in kindergarten: A longitudinal investigation of children at risk for mathematical difficulties. Child Development. 2006;77:153–175. doi: 10.1111/j.1467-8624.2006.00862.x. [DOI] [PubMed] [Google Scholar]
- Jordan NC, Kaplan D, Ramineni C, Locuniak M. Early math matters: Kindergarten number competence and later math outcomes. Developmental Psychology. 2009;45(3):850–867. doi: 10.1037/a0014939. [DOI] [PMC free article] [PubMed] [Google Scholar]
- Kline RB. Principles and Practice of Structural Equation Modeling. The Guilford Press; New York: 2005. [Google Scholar]
- Koponen T, Aunola K, Ahonen T, Nurmi J. Cognitive predictors of single-digit and procedural calculation skills and their covariation with reading skills. Journal of Experimental Child Psychology. 2007;97:220–241. doi: 10.1016/j.jecp.2007.03.001. [DOI] [PubMed] [Google Scholar]
- Krajewski K, Schneider W. Exploring the impact of phonological awareness, visuo-spatial working memory, and preschool quantity-number competencies on mathematics achievement in elementary school: Findings from a 3-year longitudinal study. Journal of Experimental Child Psychology. 2009;103:516–531. doi: 10.1016/j.jecp.2009.03.009. [DOI] [PubMed] [Google Scholar]
- LeFevre J, Fast L, Skwarchuk S, Smith-Chant B, Bisanz J, Kamawar D, Penner-Wilger M. Pathways to mathematics: Longitudinal predictors of performance. Child Development. doi: 10.1111/j.1467-8624.2010.01508.x. in press. [DOI] [PubMed] [Google Scholar]
- Lembke E, Foegen A. Identifying early numeracy indicators for kindergarten and first-grade students. Learning Disabilities Research and Practice. 2009;24(1):12–20. [Google Scholar]
- Mardia KV. Measures of multivariate skewness and kurtosis with applications. Biometrika. 1970;57:519–530. [Google Scholar]
- McGrew KS, Woodcock RW. Woodcock-Johnson III Technical Manual. Riverside Publishing; Itasca, IL: 2001. [Google Scholar]
- McLean JF, Hitch GJ. Working memory impairments in children with specific arithmetic learning difficulties. Journal of Experimental Child Psychology. 1999;74:240–260. doi: 10.1006/jecp.1999.2516. [DOI] [PubMed] [Google Scholar]
- Miyake A, Friedman NP, Emerson MJ, Witzki AH, Howerter A, Wager TD. The unity and diversity of executive functions and their contributions to complex “frontal lobe” tasks: A latent variable analysis. Cognitive Psychology. 2000;41:49–100. doi: 10.1006/cogp.1999.0734. [DOI] [PubMed] [Google Scholar]
- Miyake A, Friedman NP, Rettinger DA, Shah P, Hegarty M. How are visuospatial working memory, executive functioning, and spatial abilities related? A latent variable analysis. Journal of Experimental Psychology: General. 2001;130(4):621–640. doi: 10.1037//0096-3445.130.4.621. [DOI] [PubMed] [Google Scholar]
- Mundy E, Gilmore CK. Children’s mapping between symbolic and nonsymbolic representations of number. Journal of Experimental Child Psychology. 2009;103:490–502. doi: 10.1016/j.jecp.2009.02.003. [DOI] [PubMed] [Google Scholar]
- Muthén LK, Muthén BO. MPLUS Version 4.2 [Computer Program] Author; 1998-2006. [Google Scholar]
- Passolunghi MC, Siegel LS. Short-term memory, working memory, and inhibitory control in children with difficulties in arithmetic problem solving. Journal of Experimental Child Psychology. 2001;80:44–57. doi: 10.1006/jecp.2000.2626. [DOI] [PubMed] [Google Scholar]
- Posner MI, Peterson SE. The attention system of the human brain. Annual Review of Neuroscience. 1990;13:25–42. doi: 10.1146/annurev.ne.13.030190.000325. [DOI] [PubMed] [Google Scholar]
- Psychological Corporation . Wechsler Individual Achievement Test Manual. Author; San Antonio: 1992. [Google Scholar]
- Raghubar KP, Barnes M, Hecht SA. Working memory and mathematics: A review of developmental, individual difference, and cognitive approaches. Learning and Individual Differences. in press. [Google Scholar]
- Ramani GB, Siegler RS. Promoting broad and stable improvements in low-income children’s numerical knowledge through playing number board games. Child Development. 2008;79(2):375–394. doi: 10.1111/j.1467-8624.2007.01131.x. [DOI] [PubMed] [Google Scholar]
- Robinson CS, Menchetti BM, Torgesen JK. Toward a two-factor theory of one type of mathematics disabilities. Learning Disabilities Research and Practice. 2002;17:81–89. [Google Scholar]
- Rousselle L, Noël MP. The development of automatic numerosity processing in preschoolers: Evidence for numerosity-perceptual interference. Developmental Psychology. 2008;44:544–560. doi: 10.1037/0012-1649.44.2.544. [DOI] [PubMed] [Google Scholar]
- SAS Institute Inc. SAS Release 9.1.3 [Computer Program] Author; Cary, NC: 2002-2006. [Google Scholar]
- Schatschneider C, Francis DJ, Foorman BR, Fletcher JM. The dimensionality of phonological awareness: An application of item-response theory. Journal of Educational Psychology. 1999;91:439–449. [Google Scholar]
- Schatschneider C, Fletcher JM, Francis DJ, Carlson CD, Foorman BF. Kindergarten prediction of reading skills: A longitudinal comparative analysis. Journal of Educational Psychology. 2004;96:265–282. [Google Scholar]
- Schumacker RE, Lomax RG. A Beginners Guide to Structural Equation Modeling. Third Edition Routledge; New York: 2010. [Google Scholar]
- Siegler RS, Booth JL. Development of numerical estimation in young children. Child Development. 2004;75:428–444. doi: 10.1111/j.1467-8624.2004.00684.x. [DOI] [PubMed] [Google Scholar]
- Siegler RS, Ramani GB. Playing linear board games – but not circular ones – improves low-income preschoolers’ numerical understanding. Journal of Educational Psychology. 2009;101(3):545–600. [Google Scholar]
- Silver CH, Pennett D, Black J, Fair G, Balise R. Stability of arithmetic disability subtypes. Journal of Learning Disabilities. 1999;32:108–119. doi: 10.1177/002221949903200202. [DOI] [PubMed] [Google Scholar]
- Stanovich KE, Siegel LS. Phenotypic performance profile of children with reading disabilities: A regression-based test of the phonological-core variable difference model. Journal of Educational Psychology. 1994;86(1):24–53. [Google Scholar]
- Stock P, Desoete A, Roeyers H. Early markers for arithmetic difficulties. Educational and Child Psychology. 2007;24:28–39. [Google Scholar]
- Swanson HL. Cross-sectional and incremental changes in working memory and mathematical problem solving. Journal of Educational Psychology. 2006;98(2):265–281. [Google Scholar]
- Swanson HL, Jerman O, Zheng X. Growth in working memory and mathematical problem solving in children at risk and not at risk for serious math difficulties. Journal of Educational Psychology. 2008;100(2):343–379. [Google Scholar]
- Wagner RK, Torgesen JK, Rashotte CA. Development of reading-related phonological processing abilities: New evidence of bidirectional causality from a latent variable longitudinal study. Developmental Psychology. 1994;30:73–87. [Google Scholar]
- Wagner RK, Torgesen JK, Rashotte CA. The Comprehensive Test of Phonological Processing: Examiner’s Manual. Pro-Ed, Inc.; Austin, TX: 1999. [Google Scholar]
- Wilkinson GS. The Wide Range Achievement Test-3 (WRAT-3) Wide Range; Wilmington, DE: 1993. [Google Scholar]
- Wolf M, Bowers P, Biddle K. Naming-speed processes, timing, and reading: A conceptual review. Journal of Learning Disabilities. 2000;33(4):387–407. doi: 10.1177/002221940003300409. [DOI] [PubMed] [Google Scholar]
- Wolf M, Goldberg O’Rourke A, Gidney C, Lovett M, Cirino P, Morris R. The second deficit: An investigation of the independence of phonological and naming-speed deficits in developmental dyslexia. Reading and Writing: An Interdisciplinary Journal. 2002;15:43–72. [Google Scholar]