

Abstract
Loss of myelin in the central nervous system (CNS) leads to debilitating neurological deficits. High-resolution optical imaging of myelin in the CNS of animal models is limited by a lack of in vivo myelin labeling strategies. We demonstrated that third harmonic generation (THG) microscopy—a coherent, nonlinear, dye-free imaging modality—provides micrometer resolution imaging of myelin in the mouse CNS. In fixed tissue, we found that THG signals arose from white matter tracts and were colocalized with two-photon excited fluorescence (2PEF) from a myelin-specific dye. In vivo, we used simultaneous THG and 2PEF imaging of the mouse spinal cord to resolve myelin sheaths surrounding individual fluorescently-labeled axons, and followed myelin disruption after spinal cord injury. Finally, we suggest optical mechanisms that underlie the myelin specificity of THG. These results establish THG microscopy as an ideal tool for the study of myelin loss and recovery.
Introduction
Optical imaging provides nondestructive visualization of dynamic processes in biological systems with subcellular resolution. Conventional, linear optical imaging, however, is limited in depth penetration and suffers a loss in contrast when imaging structures in scattering tissue. Various forms of nonlinear laser scanning microscopy, including two-photon excited fluorescence (2PEF) imaging (1), circumvent these limitations and have enabled, for example, fluorescence-based imaging to a depth of 1 mm in the neocortex of a live mouse with micrometer resolution (2,3).
The fatty myelin sheaths surrounding a subset of axons in the central nervous system (CNS) enable fast conduction of action potentials. Diseases such as multiple sclerosis lead to loss of myelin with consequent deficits in motor function and sensory perception (4). Substantial imaging of myelin-related pathology has been performed in vivo in both human patients and animal models using magnetic resonance imaging (for reviews, see Le Bihan (5) and Bakshi et al. (6)) and positron emission tomography (7–9), but at resolutions of ∼200 μm and ∼1 mm, respectively, these modalities are insufficient to image the cellular and subcellular structures accessible to optical microscopies. Although protocols exist for labeling myelin in postmortem tissue sections, good exogenous dyes for optical in vivo labeling of myelin in animal models are not available, as existing dyes tend to disrupt the lipid structure of myelin. Recent work in transgenic zebrafish has enabled myelin visualization by enhanced green fluorescent protein expression driven by the myelin basic protein promoter (10). In addition, coherent anti-Stokes Raman scattering (CARS) microscopy has enabled imaging of myelinated fibers without labeling in live extracted mouse spinal cord (11) and in vivo mouse brain (12). However, the technical challenges associated with this modality have limited its broad adoption as a tool for in vivo studies.
Harmonic generation is attractive for in vivo imaging because it requires no exogenous dyes or fluorescent proteins. Second-harmonic generation (SHG) has been used to study collagen (13–15), microtubules (16–18), and cell membranes (19–21), among other things. However, SHG is produced only from molecules and structures lacking inversion symmetry and therefore possessing a nonzero χ(2). This restricts the structures that can be imaged in this modality, providing a tool that images some macromolecular structures with excellent specificity (e.g., collagen), but that cannot image most features of biological interest.
In contrast, third-harmonic generation (THG) is a nonlinear optical process ubiquitous to all molecules in which three photons at the fundamental frequency are upconverted to a photon at the third harmonic with an efficiency proportional to the third-order susceptibility tensor, X(3)(ω,ω,ω;3ω), and the cube of the intensity of the fundamental beam. Unlike 2PEF, THG is a parametric process that need not have resonances at any of the frequencies involved. Due to the Gouy phase shift associated with focused Gaussian beams (22), THG produced in the focal volume but on either side of the focal plane in the bulk of normally dispersive materials destructively interferes in the far field, resulting in the absence of signal. The presence of an optical interface breaks the symmetry across the focal plane and results in a measurable signal, making THG an interface-sensitive microscopy. THG microscopy has been used to image neurons and their processes (23,24), lipid bodies in plant seeds and Drosophila embryos (25), plant leaf cells (26), Chara rhizoids (27), zebrafish embryos and larvae (28,29), cardiomyocytes (30), mouse cartilage elastin (31), malaria parasites (32), and human cornea (33). Owing to phase-matching conditions, THG is dominantly generated in the forward direction, making epi-detection possible only after multiple scattering events (34). Like 2PEF, THG is produced only in the focal volume, making it well suited for imaging in scattering tissues.
In this article, we studied the utility of epi-detected THG as a tool for imaging myelin. We first explored the sources of THG signal in fixed mouse CNS tissue and showed that myelin is the dominant source of image contrast. We then demonstrated in vivo imaging of healthy and damaged myelin in the mouse spinal cord using THG. Finally, we explored what optical properties lead to efficient THG production.
Materials and Methods
Ex vivo tissue preparation and imaging
C57BL/6 mice were deeply anesthetized, and perfused through an intracardiac catheter with phosphate-buffered solution (PBS) (Sigma-Aldrich, St. Louis, MO) to clear blood followed by 4% paraformaldehyde (Thermo Fisher Scientific, Waltham, MA) in PBS as a fixative. Some mice expressed yellow fluorescent protein (YFP) in a subset of CNS neurons (C57B/6-thy1-YFPH; Jackson Labs, Bar Harbor, ME). Tissue was then embedded in agarose gel. Mouse brain sections several millimeters thick were cut using a vibratome (Integraslice 7550 PSDS; Campden Instruments, Lafayette, IN) or brain matrix with low-profile histology blades. Spinal cord sections were cut while still in the vertebral column with a scalpel blade. Tissue was stained in 100:1 dilution of FluoroMyelin Red (FM Red; Invitrogen, Carlsbad, CA) in PBS for a minimum of 8 h. Staining was followed by a washout of minimum 10 h in three changes of PBS. Samples were mounted using 0.5% agarose (Sigma-Aldrich) in PBS for imaging.
Imaging was performed on a locally designed multiphoton microscope and images were taken with a high numerical aperture (NA) 20× water immersion objective lens (NA = 1.0; Carl Zeiss MicroImaging, Thornwood, NY) or a low NA 4× objective (NA = 0.28; Olympus America, Center Valley, PA). A 1043-nm wavelength, 300-fs pulse duration, 1-MHz repetition rate fiber laser source (FCPA μJewel D-40; IMRA America, Ann Arbor, MI) was used to generate THG and 2PEF. Comparison images were taken in some samples with a solid-state laser source of higher repetition rate (1028-nm wavelength, 300-fs pulse duration, 10-MHz repetition rate; t-Pulse 500; Amplitude Systemes, Pessac, France). In tissue stained with FM Red, 2PEF and THG images were taken sequentially, with FM Red imaged first, so as not to photobleach the FM Red under the higher average powers used for THG imaging. Bandpass filters used for detection were centered at 350 for THG, 645 nm for 2PEF of FM Red and Texas Red dextran, and 517 nm for 2PEF of YFP.
Spinal cord sections of homozygous shiverer mice (Mbpshi, Jackson Labs, Bar Harbor, ME)—a strain that is severely myelin-deficient—were compared against controls. Image stacks were taken with the low NA objective at 5-μm increments and ∼1-mm maximal depth. Maximum projections were taken to remove any artifacts from sample tilt that might be introduced by averaging. To remove the effects of background pixels, images were traced manually and only pixels interior to the boundary were considered. An image histogram was computed, and the THG contrast was defined as the full width at half-maximum (FWHM) of the intensity histogram.
In vivo mouse preparation and imaging
Wild-type mice (C57BL/6) or transgenic mice expressing YFP in a subset of pyramidal neurons and dorsal root ganglia (DRG) were used for multimodal imaging. Mice were anesthetized using inhaled isoflurane (5% to induce anesthesia and ∼1.5% to maintain anesthesia during surgery and imaging) on a custom surgery table and a dorsal laminectomy was performed. A rectal thermometer and feedback-controlled heating blanket were used to maintain the animal at 37.5°C. Glycopyrrolate (50 μg/100-g mouse weight) was injected into the thigh muscle to prevent the buildup of fluid in the lungs. Bupivicane, a local anesthetic, was injected at the site of surgical incisions (∼0.1 mL of 0.125%). An incision was made in the skin and the muscle was retracted from the vertebrae spanning T10-T12. The vertebrae were clamped on either side and held in place using custom holders. The lamina of T11 was removed with Vanna's scissors, and excess bleeding stopped with the use of gelfoam (Pharmacia & Upjohn, Kalamazoo, MA). Where possible, the dura was left intact. A #0 coverslip was applied over the cord and the interstitial space filled with 0.5% agarose in artificial cerebral spinal fluid. Animals were given 5% (W/V) glucose in saline hourly (0.1 mL/100-g mouse weight). The blood plasma was fluorescently labeled by intravenous injection of 50 μL of 2.5% (W/V) Texas Red dextran (molecular mass = 70,000 kDa; Invitrogen). The mouse was then transported to the microscopy laboratory and imaging was performed using the same setup as for ex vivo samples. After the imaging sessions, mice were perfused as described above.
In vivo zebrafish preparation and imaging
Six-day-old larval zebrafish were anesthetized in 0.2% tricaine methanesulphonate (MS-222; Western Chemical International, Scottsdale, CA), and the Mauthner cell was electroporated with 70-kDa Texas-Red dextran in 10% Hank's buffer to fluorescently label the Mauthner axon. Five days later, the animals were again anesthetized and mounted dorsal side up in low melting temperature agarose for in vivo imaging on the same setup described above.
Spinal cord microlesioning
Micrometer-scale lesions were produced in the spinal cord by femtosecond laser ablation using ∼100-nJ pulses from a regenerative amplifier (800-nm wavelength, 50-fs pulse duration, 1-kHz repetition rate; Legend model, Coherent Laser, Santa Clara, CA), focused with the 1.0 NA objective into the spinal cord of live, anesthetized mice. Custom software in MATLAB (The MathWorks, Natick, MA) allowed the user to draw a trajectory on a projection of a three-dimensional stack, so as to avoid injuring and rupturing blood vessels, which would obscure imaging. A shutter was then opened and the translation stage followed the trajectory moving at 500 μm/s and disrupting tissue in the focal volume via nonlinear ablation (35), effectively acting as a laser scalpel. The pattern was continued until the desired depth of the cut was reached. The axial extent of the disruption produced by a single laser pass was ∼1–2 μm at the energies used here and increases with pulse energy. Multiple passes at different depths were used to make a cut several tens of micrometers in depth. To insure an adequate lesion, the same pattern was repeated twice for each cut.
Image processing
Image stacks were median-filtered and the average z-projection computed to show relevant structures. Images taken with the high NA objective were oversampled in z (0.2-μm increments). Frames containing severe motion artifact (largely due to breathing) from in vivo imaging sessions were removed and interpolated between.
For tiled images using the low NA objective, a water/air interface was present that was absent when using the high NA water immersion objective. This interface, combined with the field curvature, resulted in images with an inhomogeneous intensity distribution across the field of view. To correct for this effect, images were normalized by the intensity distribution from the surface of the surrounding agarose alone.
Monte Carlo simulation
The method described by Prahl et al. (36) was followed closely. Photon packets were randomly assigned an initial position within the beam waist and corresponding azimuthal angle. Polar angles were assigned randomly for 2PEF simulations, or in a forward propagating arrangement for THG, as described in Appendix B. Detection was achieved for photons that were incident on an aperture within a fixed acceptance angle, with amplitude dependent on the ratio of path length and absorption length.
All animal procedures were performed with the approval of the Cornell Institutional Animal Care and Use Committee (IACUC) and under the guidance of the Cornell Center for Animal Resources and Education.
Results
THG image contrast in mouse spinal cord was dominated by myelinated axon tracts
Coronal slices of fixed mouse spinal cord were stained with FluoroMyelin Red (FM Red), a myelin-specific two-photon-excitable dye, and imaged in an epi-detection arrangement. Imaging with a low NA objective showed bright THG from white-matter tracts with only a dim signal from the butterfly-shaped gray matter (Fig. 1 a, left), which corresponded well to the pattern of FM Red-stained myelin seen with 2PEF (Fig. 1 a, right). High-resolution (high NA) THG imaging showed large signal in regions of dense myelination in the dorsolateral (Fig. 1 b, left) and dorsal (Fig. 1 c, left) corticospinal tracts. Fine features resolved in the THG images (Fig. 1, b and c, left) were similar to those apparent in high-resolution 2PEF images of FM Red-labeled myelin (Fig. 1, b and c, right). The dark round holes shown in relief against the strong THG signal (Fig. 1, b and c, left) were confirmed to be axons by coregistering THG images with 2PEF images in spinal cord sections from transgenic mice that expressed YFP in a subset of the corticospinal tract axons (see Fig. S1 and additional text in the Supporting Material). To rule out signal arising from resonant enhancement from either YFP or FM Red, fixed sections of wild-type C57B6/J mice were imaged and showed no difference in THG contrast (data not shown).
Figure 1.
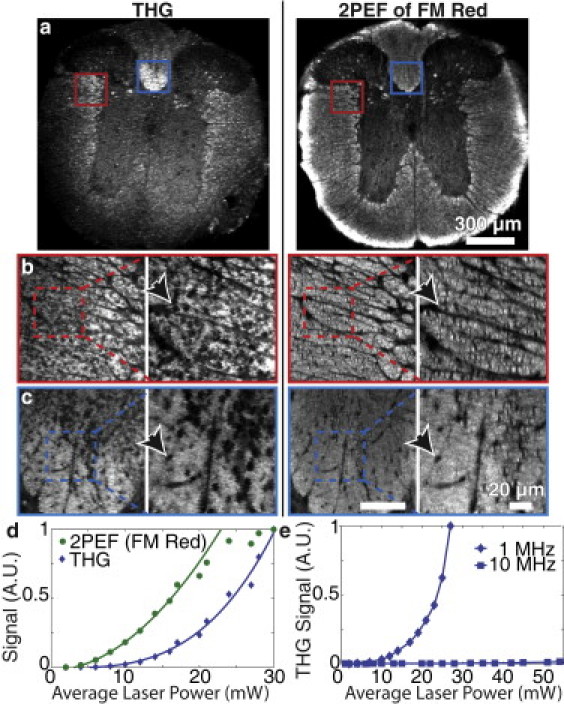
Myelinated tracts in mouse spinal cord provided a strong source of THG imaging contrast. Thick coronal sections of thoracic spinal cord from C57BL/6 mice stained with FM Red dye and imaged using 2PEF and THG. Imaging with a low NA objective showed the gross structure of white-matter tracts (a). Individual axons, seen as holes against a myelin backdrop (arrows), were visible in the dorsal (b) and dorsolateral corticospinal (c) tracts when imaged with a high NA objective. A least-squares power law fit, S ∼ Pb, of the THG signal, S, from myelinated tissue as a function of average excitation power, P, gave b = 3.3 ± 0.3 and did not saturate like the 2PEF signal (d). THG imaging with a 1-MHz repetition rate source produced significantly more signal intensity than a 10-MHz source with similar wavelength and pulse duration at the same average power (e).
The average signal at 350 nm from fixed spinal cord scaled as the cube of the incident laser power (Fig. 1 d), with no sign of saturation even above the threshold for sample damage (∼25–30 mW), consistent with THG. In contrast, the 2PEF signal of FM Red scaled as the square of the average power and saturated at high power (Fig. 1 d). Using a 10-MHz laser with similar wavelength and pulse duration, we observed much lower THG signal as compared to the 1-MHz laser, for the same average power (Fig. 1 e). We were unable to form high-contrast THG images at 10 MHz, whereas this was routinely achieved at 1 MHz. This observation fits with the expected scaling of THG signal (see Discussion).
THG imaging enabled in vivo visualization of myelin in mouse and larval zebrafish spinal cord and was combined with 2PEF microscopy for visualization of multiple tissue constituents
The value of THG as an in vivo myelin imaging strategy was evaluated in the mouse dorsal thoracic spinal cord. The dorsal lamina of one vertebral body was removed and covered by glass in anesthetized mice that expressed YFP in a subset of dorsal root ganglia (DRG) neurons and had blood vessels labeled with intravenously injected Texas Red dextran (see Materials and Methods). Blood vessels, notably the large dorsal spine vein at the center of the cord and the branching venules that drain into it, as well as a subset of DRG axons that merge with the dorsal column were visible by 2PEF (Fig. 2 a). THG imaging revealed the striated appearance of large numbers of myelinated axons including and running parallel to axons visible from 2PEF of YFP (Fig. 2 a). Individual YFP-labeled axons show strong THG from a ∼1-μm-thick band immediately adjacent to the 3-μm-diameter axon lumen, in good agreement with published measurements of the g-ratio (37), the ratio of the inner axon diameter to the outer diameter of a myelinated axon, including its myelin sheath (Fig. 2, b and c). THG imaging of the most superficial myelinated tracts show distinct circular voids, suggesting axonal lumens, the cylindrical cavities of axons (Fig. 2 d, inset).
Figure 2.
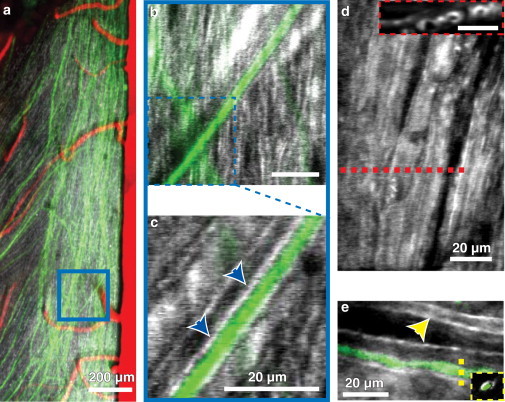
In vivo THG and 2PEF imaging allowed identification of individual axons and their myelin sheaths in mice and zebrafish. 2PEF imaging of YFP labeled axons (green) and blood vessels labeled by intravascular injection of Texas Red dextran (red), together with THG signal (white) in the dorsal thoracic spinal cord of a live, anesthetized mouse (a). Small (∼5 μm) z projections allowed for the identification of individual axons (b and c) and their respective myelin sheaths (blue arrows). Slicing in the xz plane showed rings of myelin surrounding individual axons (d, inset). A Texas Red labeled Mauthner cell axon (e) seen in the dorsal view of 10-day old zebrafish larva showed similar imaging contrast. Myelination on the contralateral Mauthner cell axon was also visible (yellow arrow), with the Mauthner axons separated by the notocord.
To assess the effectiveness of THG imaging in another common animal model, we electroporated one Mauthner cell in zebrafish larvae with Texas Red dextran and imaged live, immobilized animals. THG imaging showed a myelin sheath encircling the fluorescently labeled axon lumen (Fig. 2 e).
In fixed mouse brain, THG contrast was dominated by myelin and was significantly reduced in myelin-deficient shiverer mice compared to wild-type animals
To verify that high-contrast THG signal from myelin was not limited to the spinal cord, we repeated THG imaging and 2PEF microscopy of FM Red in fixed mouse brain tissue (Fig. 3). Low NA imaging of both tangential (Fig. 3 a) and sagittal (Fig. 3 b) sections showed strong correspondence between THG and FM Red. High-resolution THG images of densely myelinated regions showed individual myelinated mossy fibers in the cerebellar lobes (Fig. 3 c) as well as white-matter tracts—dense bundles of myelinated axons—in the corpus callosum and hindbrain (Fig. 3, d and e, respectively).
Figure 3.
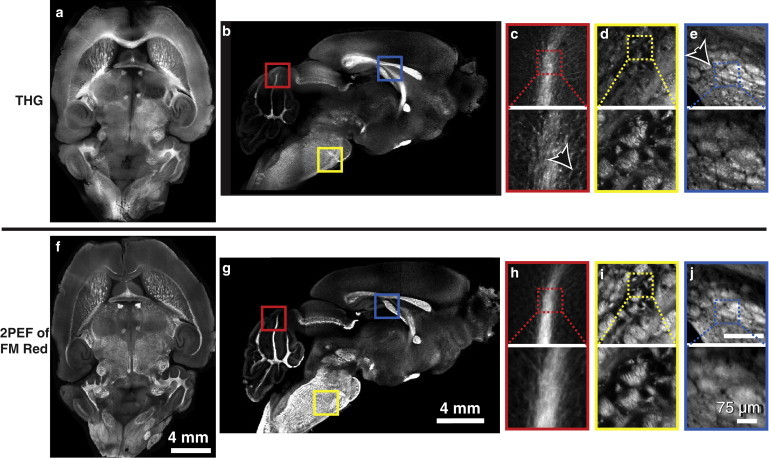
CNS myelin was the dominant source of THG contrast in the brain. Low NA THG imaging of tangential (27 tiled images) (a and f) and sagittal (15 tiled images) (b and g) sections of the mouse brain showed strong overlap between THG and 2PEF images of FM Red labeled myelin. High THG intensities corresponded with known white-matter brain regions, such as the mossy fibers in the cerebellar lobes (c, arrow, and h) the pons and hindbrain (d and i), and axon bundles in the corpus callosum (e, arrow, and j). High NA images (c–e and h–j) showed correspondence at the micrometer scale between THG images and 2PEF images of FM Red.
As a further verification of myelin as the source of THG contrast, we compared thick tissue sections of spinal cord from control mice (C57B/6-thy1-YFPH, n = 8 sections) to myelin-deficient shiverer mice (MBP-shi, n = 12 sections), which are homozygous for a mutation of the myelin basic protein gene. This mutation leads to severe hypomyelination in the central nervous system, resulting in tremors and seizurelike behavior (38). We characterized THG contrast—defined as the FWHM of the intensity histogram—for both strains by comparing low NA images (Fig. 4 c). Edges of the sections were omitted by manual tracing (Fig. 4, a and b) to remove any artifacts of tissue sectioning. Shiverer mice showed less THG image contrast than controls (Fig. 4 d). The THG that was produced in the sections from shiverer mice was largely due to the signal from the tissue/air interface at the top of the sample. Sections from shiverer mice labeled with FM Red (not shown) showed a lack of staining, consistent with this observation. In vivo imaging of the shiverer mice (data not shown) did not show the characteristic striations visible in the wild-type animals (e.g., Fig. 2), individual axons could not be resolved, and THG signal was absent beyond the tissue interface at the dorsal surface of the spinal cord.
Figure 4.
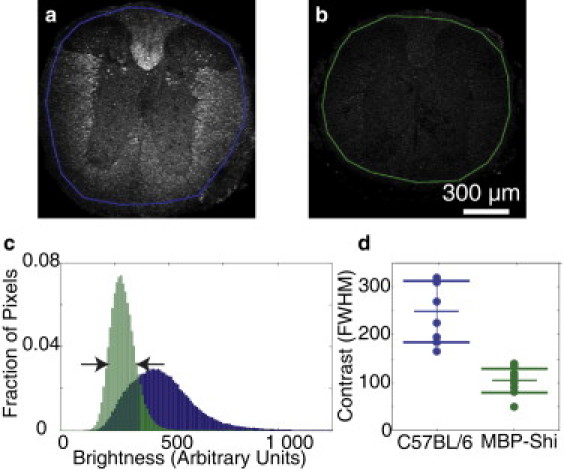
Myelin-deficient shiverer mice showed significantly less THG contrast than controls. Thick coronal sections of thoracic spinal cord from a control mouse (a) and shiverer mouse (b) imaged using a low power objective. The intensity histogram (c) was computed for each section within the traced regions. Contrast was defined as FWHM (arrows) of the intensity histogram for control (blue) and myelin-deficient (green) mice. Control mice (8 sections) showed a higher image contrast as compared to shiverer mice (12 sections, p ≤ 10−5, ANOVA) (d).
Changes in myelin structure after spinal cord injury occurred in regions where axons degenerated
We performed in vivo imaging in mice that express YFP in DRG axons before and after spinal cord injury. Spinal cord lesions were created using nonlinear absorption of tightly-focused femtosecond laser pulses from a regenerative amplifier (see Methods). After the microlesion, we performed time-lapsed imaging of THG and 2PEF of YFP-labeled axons up to 1 h after the injury (Fig. 5, a–c). Clear alterations in the myelin structure were evident after the lesion and the altered region grew in size over time. We assessed the presence and morphology of YFP-labeled axons within the region of disrupted myelin and found no undamaged axons and few intact proximal or distal axon tips within the region of myelin disruption (five lesions across two animals).
Figure 5.
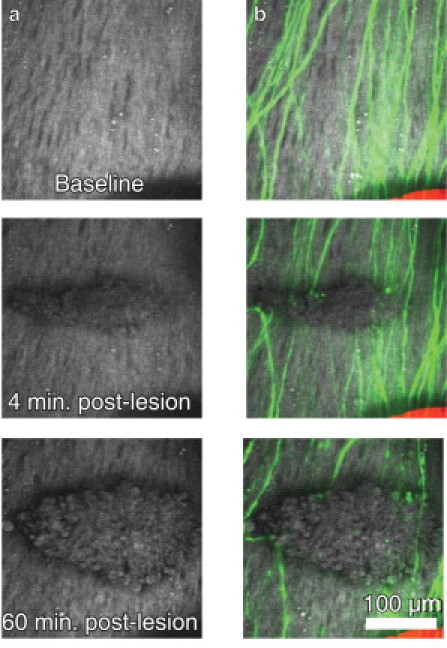
Spinal cord microlesions resulted in coordinated myelin and axon degeneration. A laser lesion produced with femtosecond laser pulses lead to disruption of myelin (white) as seen in THG imaging (a). Simultaneous 2PEF imaging of severed axons (green) showed spatially and temporally overlapped degeneration of axons and myelin after injury (b). Blood vessels were intentionally spared in creation of these lesions.
The myelin specificity of THG could be accounted for by the thickness and scattering properties of myelin
One of the distinguishing features of myelin compared to other lipid-water interfaces is that the multimembrane windings of myelin give an overall lipid thickness ranging from hundreds of nanometers to micrometers (37), compared to a typical somatic membrane thickness of only tens of nanometers. We considered THG in the forward generated direction from a biological interface modeled as a slab of dielectric of thickness L surrounded by water. The slab was symmetrically situated about the laser focus at z = 0 (Fig. 6 a). Following the analysis of Débarre and Beaurepaire (39), but working in our experimental limit where, because of tight focusing, the confocal parameter, b, and sample thickness is short compared to the coherence length (L,b << 2πΔk-1, where Δk is the wave vector mismatch), we arrive at (see Appendix A):
| (1) |
Here, α is a constant dependent on excitation geometry, and n3ω is the index of refraction at the third harmonic with the subscripts w and s denoting “water” and “slab,” respectively. P3ω and P0 are the intensities of the third harmonic and fundamental fields, respectively. Equation 1 predicted an approximately quadratic dependence of THG intensity on sample thickness for L << b (Fig. 6 b). This result suggests that lipid slabs with the thickness of a cell membrane result in signals up to three-orders-of-magnitude smaller than that of myelin, well below the noise floor of our THG imaging system. This finding is consistent with our observation that the lumen of axons appeared as dark holes against the bright signal from myelin, even though many individual membranes are present in the axon.
Figure 6.
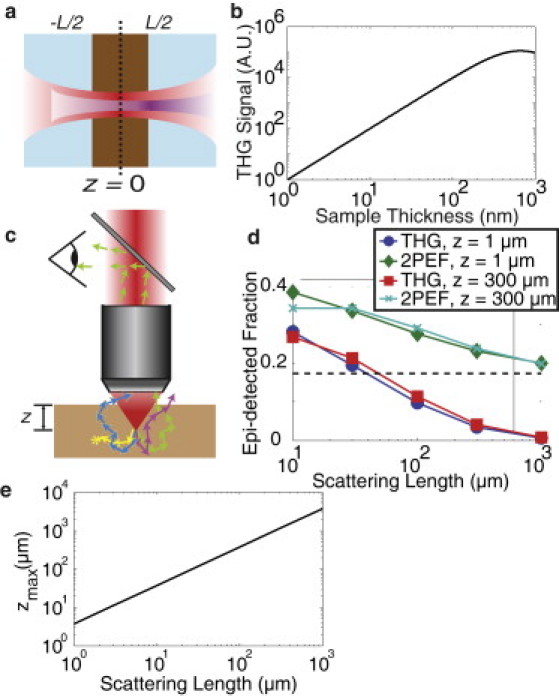
The strong THG signal from myelin was due to both the thickness and scattering properties of myelin. Schematic for analytic calculations, in which a dielectric slab with thickness, L, much smaller than the coherence length, Δk−1, was centered on the laser focus (a). Calculations showed a near-quadratic dependence of THG signal on slab thickness for sample thicknesses <1 μm (b). Third harmonic is generated in the forward direction and epi-detected only after backscattering (c). The fate of THG photons in a semi-infinite sample were to be absorbed (yellow), escape but not enter the objective (mauve), escape and hit the lens at an angle above the NA (cyan), or enter the objective with the acceptance angle and be detected (green). Monte Carlo simulations (d) for forward-generated THG and isotropically emitted fluorescence (i.e., 2PEF) originating from the focal volume gave the epi-detected fraction of light as a function of scattering length. (Dashed line) Asymptotic value of the 2PEF collection efficiency for infinite scattering length (ballistic photons only), while the efficiency tended to zero for THG. The maximum depth, zmax, at which high signal/noise THG imaging can be performed using a 1-W laser source to maintain the necessary 25 mW at the focus decreased linearly with scattering length (e).
Because THG is generated predominantly in the forward direction, epi-detection is possible only after multiple scattering events (34). In contrast, 2PEF leads to isotropic emission, making epi-detection possible even in the absence of scattering. We used a Monte Carlo simulation to determine collection efficiency of backscattered THG and 2PEF emission as a function of scattering length. We modeled our tissue sample as a semi-infinite slab having uniform scattering and a fixed absorption length of 1 cm. Light was epi-detected after multiple scattering events provided that the light enters the collection aperture of the objective within a fixed acceptance angle (Fig. 6 c, see Appendix B). THG epi-detection efficiency was a decreasing function of scattering length, with detected THG going to zero as scattering length goes to infinity (Fig. 6 d). In contrast, the 2PEF signal tended to the ballistic photon limit with increased scattering length (marked by the dashed line in Fig. 6 d). Both THG and 2PEF showed little dependence of collection efficiency on how deep within the sample the light is generated, assuming constant excitation.
From in vivo 2PEF image stacks of YFP-labeled axons in the white-matter tracts, we measured the 2PEF signal attenuation length at 1043-nm wavelength, which has been shown to be dominated by scattering (3). We fitted the exponential decay of signal as a function of depth (using constant power excitation and assuming a constant fluorophore density) and found that the white matter of the mouse spinal cord has a 2PEF signal attenuation length of ∼20–30 μm at 1043 nm.
Discussion
THG enables visualization of CNS myelin in vivo and in fixed tissue and can be implemented on existing multiphoton microscopes
We demonstrated the ability to image CNS myelin in mice both in vivo (Fig. 2) and ex vivo (Figs. 1 and 3) using THG microscopy. This technique is well suited for the study of mouse models of demyelination, due to multiple sclerosis or after spinal injury (Fig. 5), because it opens the door to longitudinal imaging without the complication or artifacts of repeated labeling. Our demonstration of THG imaging of myelinated axons in zebrafish (Fig. 2 e) suggests this technique could be combined with high-throughput drug testing in simple animal models (41). CARS microscopy has also been shown to be an effective probe of myelination in vivo (11,12). However, this technique requires spatial and temporal overlap of 2-ps laser pulses at different wavelengths (42), a technical challenge that limits the widespread use of this modality compared to 2PEF and harmonic generation imaging.
In CARS microscopy, the myelin specificity is due to the chemical properties of myelin, namely the high density of carbon-hydrogen bonds. In contrast, our analysis suggests that the myelin specificity of THG arises predominantly from the geometrical properties of myelin. One potential advantage of THG for myelin imaging is that this method can be readily performed on existing multiphoton microscopes with the simple addition of a suitable—albeit nonstandard—femtosecond laser source and the correct detection filters, making broad adoption of this technique straightforward. Also, the laser parameters appropriate for THG are well suited for 2PEF and SHG imaging (e.g., Fig. 2), enabling straightforward multimodal microscopy, where the different contrast mechanisms provide complementary information (43). For example, 2PEF, SHG, and THG multimodal microscopy has been used to monitor subcellular details in the cell division cycles during zebrafish embryogenesis (44).
THG is a broadly applicable, dye-free imaging modality
THG is ubiquitous to all molecules, but the efficiency of THG production is both geometry- and molecule-specific, as shown in Eq. 1. Our analysis suggests that the presence of a significant optical interface—both in geometric extent and in optical properties—is both necessary and sufficient for efficient THG. Consistent with this understanding, our work has shown that myelin in the CNS can be imaged with THG, while previous researchers have shown that lipid droplets of several hundred nanometers to several micrometers (39), malaria hemazoin pigments between 0.2 and 10 μm (32), and red blood cells (45,46), can all be imaged using THG. Additionally, we anticipate that THG may be an effective tool for visualizing myelinated nerves in the peripheral nervous system, such as the cavernous nerves running along the prostate.
Available excitation power and sample damage thresholds limit THG signal, suggesting that optimized laser parameters are essential
One drawback for THG imaging is that although collection efficiency is improved by short scattering length samples, the maximum depth at which measurable excitation can be achieved is severely limited. Assuming a 1-W laser source and the experimentally observed ∼15–20 mW required for 300-fs pulses at 1 MHz pulse repetition rate to generate reasonable THG signal/noise (still weak compared to 2PEF of fluorescently-labeled blood vessels and axons), the maximum depth that can be imaged falls off quickly with increasing scattering length (Fig. 6 e) due to the attenuation of excitation light by scattering. For the ∼20-μm scattering length of the spinal cord white matter, we predict a maximal imaging depth of 70 μm (Fig. 6 e), and we experimentally achieved ∼50 μm.
The maximum laser energy and power that can be used is set by sample damage. With the 1 MHz repetition rate laser, we observed immediate sample damage at average power of ∼25–30 mW (25–30 nJ per pulse), likely due to nonlinear ablative processes. By way of comparison, we took images in the same sample using a 300-fs, 1028-nm source with a 10-MHz pulse train. For the 10-MHz laser system, we observed immediate sample damage at average powers of ∼50–55 mW (5–5.5 nJ per pulse), likely due to thermal effects. In either regime, photochemical-mediated damage may also contribute. One means of extending the depth limitations and/or improving the signal/noise of THG imaging, while remaining below damage thresholds, is to optimize laser parameters. THG signal depends on the inverse squares of both the repetition rate, R, and pulse duration, τ, and the cube of the average power, 〈P〉:
| (2) |
The observed disparity in THG signal (Fig. 1 e) between images obtained with 10-MHz and 1-MHz repetition rate laser sources is consistent with this scaling. Because ablative damage threshold varies little with pulse duration below 10 ps (47), it is always desirable to have the shortest pulse possible, with a pulse duration of 15 fs at the focus of a large NA objective possible when dispersion is carefully managed and a broad bandwidth source is used (48). In addition, because the THG signal does not saturate, the maximum signal that can be obtained comes at the intersection of the ablative and average power damage thresholds. Thus, for a maximum pulse energy of 20 nJ (below ablative damage threshold) and a maximum average power of 50 mW (below thermal damage threshold), the optimum pulse repetition rate is 2.5 MHz. Our laser source operates at 1 MHz and emits 300-fs pulses, suggesting a signal improvement of ∼1000 is possible with an optimal laser source. In previous studies (24–33) in which THG imaging was performed in high-collection-efficiency forward detection systems, the use of suboptimal sources was not the limiting factor on image contrast. However, as we have demonstrated by in vivo imaging of CNS myelin, the reduced collection efficiency inherent in epi-detected THG strongly suggests that the use of lower repetition rate sources (e.g., Fig. 1 e) may lead to significant contrast improvement, consistent with Eq. 2. In contrast, 2PEF microscopy—where the signal scales as the square of the average power and only inversely with the repetition rate—may benefit from the higher scan speeds possible when higher repetition rates and bright fluorophores are used (49). However, the optimum laser repetition rate will depend on the balance between efficient signal production and dye saturation determined by the two-photon cross-section of all the labels present. It is therefore imperative to select laser sources that optimize signal from the nonlinear process of interest.
THG microscopy provides the capability for in vivo studies of demyelinating diseases
We imaged acute changes in myelin structure after spinal cord injury (Fig. 5). Our observation of axon degeneration involving a brief period of inaction followed by rapid fragmentation is consistent with the acute axonal degeneration observed in previous studies (50). Our comparison of THG images of myelin and 2PEF images of axons after laser-based spinal cord transections suggests that acute myelin degeneration spatially and temporally overlaps with acute axonal degeneration.
Conclusions
We have demonstrated that THG provides a dye-free optical imaging modality for visualizing CNS myelin in two animal models. We have also seen that this source of contrast was significantly improved by the use of a high peak-power, low repetition-rate laser source, suggesting that these laser parameters may be more suitable for imaging weak nonlinear signals. We anticipate that these findings will be of use to both the neuroscience community and present what we believe to be new guidance for the development of laser sources for nonlinear microscopy.
Acknowledgments
We thank Francesca Minale for help with the zebrafish imaging experiments, Chris Xu and Alan Arai for critically reading this manuscript, and IMRA America Inc. for the loan of its FCPA μJewel D-400 laser.
We thank the National Institutes of Health (grant No. RO1 EB002019 to C.B.S. and F.W.W., and grant No. DP1 OD006411 to J.R.F.) and the National Science and Research Council of Canada (to M.J.F.) for financial support.
Appendix A: Calculation of THG signal from a dielectric slab
We begin with the expression for the THG from a dielectric slab of thickness L, centered at the laser focus (z = 0), immersed in water (Fig. 6) given by Débarre and Beaurepaire (39),
| (A1) |
where X(3) is the third-order nonlinear susceptibility tensor, n3ω is the index of refraction at the third harmonic, Δk is the wavevector mismatch, b is the confocal parameter, tω is the transmission coefficient at frequency ω, and C(R) is a factor which depends only on the radial geometry of the beam. Subscripts w and s denote “water” and “slab”, respectively. The difference in the arguments of the exponential in each integral arises due to requirements of the continuity of the electric field at a boundary. We neglect transmission coefficients, which are almost one in most cases of interest. This yields the expression for the third harmonic field
| (A2) |
For the tight focusing geometry used for high-resolution imaging here, the coherence length, 2πΔk−1, is much greater than both the confocal parameter, b, and the sample size, L. If we consider that the Lorentzian term is significant only when z ≤ b, then we may ignore the exponential phases. Each integral reduces to the form
| (A3) |
which when inserted into Eq. A2 gives
| (A4) |
Finally, squaring this and integrating over all radial coordinates yields the final expression
| (A5) |
where α represents the integration over radial coordinates, and P3ω and P0 are the intensities of the third harmonic and fundamental fields, respectively.
Appendix B: Description of the monte carlo simulation
We determined the fraction of THG or 2PEF light that is detected by an epi-oriented microscope objective using Monte Carlo simulation. We modeled our collection optics as corresponding to a 3-mm aperture with an acceptance angle of 49°. We modeled our excitation optics as corresponding to an objective with NA = 1.0 and working distance of 1.8 mm. Each photon had one of four fates:
-
1.
It is absorbed in the sample (yellow in Fig. 6 c), or
-
2.
It misses the aperture entirely (mauve in Fig. 6 c), or
-
3.
It arrives at the aperture with an angle larger than the acceptance angle (cyan in Fig. 6 c), or
-
4.
It arrives within the aperture below the acceptance angle and is detected (green in Fig. 6 c) with an intensity dependent on its path length in comparison to the sample absorption length.
We set the absorption length in our simulation to be 1 cm, in between the absorption of the hemoglobin in the blood and water. An anisotropy factor of g = 0.96 was used. For each set of conditions (depth and scattering length), the fate of 106 photons was determined.
The simulated THG was a forward propagating beam matching the properties of fundamental focused through a 1.0 NA objective but having a beam waist of 1/√3 the size of the fundamental and correspondingly narrower distribution of polar angles. Azimuthal angles were chosen at random from a uniform distribution. For 2PEF simulations, both azimuthal angles and polar angles were chosen at random from a uniform distribution.
Supporting Material
References
- 1.Denk W., Strickler J.H., Webb W.W. Two-photon laser scanning fluorescence microscopy. Science. 1990;248:73–76. doi: 10.1126/science.2321027. [DOI] [PubMed] [Google Scholar]
- 2.Theer P., Hasan M.T., Denk W. Two-photon imaging to a depth of 1000 microns in living brains by use of a Ti:Al2O3 regenerative amplifier. Opt. Lett. 2003;28:1022–1024. doi: 10.1364/ol.28.001022. [DOI] [PubMed] [Google Scholar]
- 3.Kobat D., Durst M.E., Xu C. Deep tissue multiphoton microscopy using longer wavelength excitation. Opt. Express. 2009;17:13354–13364. doi: 10.1364/oe.17.013354. [DOI] [PubMed] [Google Scholar]
- 4.Franklin R.J.M., Kotter M.R. The biology of CNS remyelination: the key to therapeutic advances. J. Neurol. 2008;255(Suppl 1):19–25. doi: 10.1007/s00415-008-1004-6. [DOI] [PubMed] [Google Scholar]
- 5.Le Bihan D. Looking into the functional architecture of the brain with diffusion MRI. Nat. Rev. Neurosci. 2003;4:469–480. doi: 10.1038/nrn1119. [DOI] [PubMed] [Google Scholar]
- 6.Bakshi R., Thompson A.J., Filippi M. MRI in multiple sclerosis: current status and future prospects. Lancet Neurol. 2008;7:615–625. doi: 10.1016/S1474-4422(08)70137-6. [DOI] [PMC free article] [PubMed] [Google Scholar]
- 7.Radu C.G., Shu C.J., Witte O.N. Positron emission tomography with computed tomography imaging of neuroinflammation in experimental autoimmune encephalomyelitis. Proc. Natl. Acad. Sci. USA. 2007;104:1937–1942. doi: 10.1073/pnas.0610544104. [DOI] [PMC free article] [PubMed] [Google Scholar]
- 8.Stankoff B., Wang Y., Zalc B. Imaging of CNS myelin by positron-emission tomography. Proc. Natl. Acad. Sci. USA. 2006;103:9304–9309. doi: 10.1073/pnas.0600769103. [DOI] [PMC free article] [PubMed] [Google Scholar]
- 9.Wang Y., Wu C., Miller R.H. In vivo quantification of myelin changes in the vertebrate nervous system. J. Neurosci. 2009;29:14663–14669. doi: 10.1523/JNEUROSCI.4082-08.2009. [DOI] [PMC free article] [PubMed] [Google Scholar]
- 10.Jung S.H., Kim S., Kim C.H. Visualization of myelination in GFP-transgenic zebrafish. Dev. Dyn. 2010;239:592–597. doi: 10.1002/dvdy.22166. [DOI] [PubMed] [Google Scholar]
- 11.Wang H.F., Fu Y., Cheng J.X. Coherent anti-stokes Raman scattering imaging of axonal myelin in live spinal tissues. Biophys. J. 2005;89:581–591. doi: 10.1529/biophysj.105.061911. [DOI] [PMC free article] [PubMed] [Google Scholar]
- 12.Fu Y., Huff T.B., Cheng J.X. Ex vivo and in vivo imaging of myelin fibers in mouse brain by coherent anti-Stokes Raman scattering microscopy. Opt. Express. 2008;16:19396–19409. doi: 10.1364/oe.16.019396. [DOI] [PMC free article] [PubMed] [Google Scholar]
- 13.Stoller P., Reiser K.M., Rubenchik A.M. Polarization-modulated second harmonic generation in collagen. Biophys. J. 2002;82:3330–3342. doi: 10.1016/S0006-3495(02)75673-7. [DOI] [PMC free article] [PubMed] [Google Scholar]
- 14.Williams R.M., Zipfel W.R., Webb W.W. Second harmonic imaging for collagen structure analysis. Biophys. J. 2002;82:175A. [Google Scholar]
- 15.Williams R.M., Zipfel W.R., Webb W.W. Interpreting second-harmonic generation images of collagen I fibrils. Biophys. J. 2005;88:1377–1386. doi: 10.1529/biophysj.104.047308. [DOI] [PMC free article] [PubMed] [Google Scholar]
- 16.Mohler W., Millard A.C., Campagnola P.J. Second harmonic generation imaging of endogenous structural proteins. Methods. 2003;29:97–109. doi: 10.1016/s1046-2023(02)00292-x. [DOI] [PubMed] [Google Scholar]
- 17.Kwan A.C., Dombeck D.A., Webb W.W. Polarized microtubule arrays in apical dendrites and axons. Proc. Natl. Acad. Sci. USA. 2008;105:11370–11375. doi: 10.1073/pnas.0805199105. [DOI] [PMC free article] [PubMed] [Google Scholar]
- 18.Stoothoff W.H., Bacskai B.J., Hyman B.T. Monitoring τ-tubulin interactions utilizing second harmonic generation in living neurons. J. Biomed. Opt. 2008;13:064039. doi: 10.1117/1.3050422. [DOI] [PMC free article] [PubMed] [Google Scholar]
- 19.Campagnola P.J., Wei M.D., Loew L.M. High-resolution nonlinear optical imaging of live cells by second harmonic generation. Biophys. J. 1999;77:3341–3349. doi: 10.1016/S0006-3495(99)77165-1. [DOI] [PMC free article] [PubMed] [Google Scholar]
- 20.Millard A.C., Jin L., Loew L.M. Sensitivity of second harmonic generation from styryl dyes to transmembrane potential. Biophys. J. 2004;86:1169–1176. doi: 10.1016/S0006-3495(04)74191-0. [DOI] [PMC free article] [PubMed] [Google Scholar]
- 21.Moreaux L., Sandre O., Mertz J. Membrane imaging by simultaneous second-harmonic generation and two-photon microscopy. Opt. Lett. 2000;25:320–322. doi: 10.1364/ol.25.000320. [DOI] [PubMed] [Google Scholar]
- 22.Boyd R.W. Academic Press; San Diego, CA: 2003. Nonlinear Optics. [Google Scholar]
- 23.Yelin D., Silberberg Y. Laser scanning third-harmonic-generation microscopy in biology. Opt. Express. 1999;5:169–175. doi: 10.1364/oe.5.000169. [DOI] [PubMed] [Google Scholar]
- 24.Gualda E.J., Filippidis G., Tavernarakis N. In vivo imaging of neurodegeneration in Caenorhabditis elegans by third harmonic generation microscopy. J. Microsc. 2008;232:270–275. doi: 10.1111/j.1365-2818.2008.02098.x. [DOI] [PubMed] [Google Scholar]
- 25.Débarre D., Supatto W., Beaurepaire E. Imaging lipid bodies in cells and tissues using third-harmonic generation microscopy. Nat. Methods. 2006;3:47–53. doi: 10.1038/nmeth813. [DOI] [PubMed] [Google Scholar]
- 26.Müller M., Squier J., Brakenhoff G.J. 3D microscopy of transparent objects using third-harmonic generation. J. Microsc. 1998;191:266–274. doi: 10.1046/j.1365-2818.1998.00399.x. [DOI] [PubMed] [Google Scholar]
- 27.Squier J.A., Muller M., Wilson K.R. Third harmonic generation microscopy. Opt. Express. 1998;3:315–324. doi: 10.1364/oe.3.000315. [DOI] [PubMed] [Google Scholar]
- 28.Chu S.W., Chen S.Y., Sun C.K. In vivo developmental biology study using noninvasive multi-harmonic generation microscopy. Opt. Express. 2003;11:3093–3099. doi: 10.1364/oe.11.003093. [DOI] [PubMed] [Google Scholar]
- 29.Sun C.K., Chu S.W., Tsai H.J. Higher harmonic generation microscopy for developmental biology. J. Struct. Biol. 2004;147:19–30. doi: 10.1016/j.jsb.2003.10.017. [DOI] [PubMed] [Google Scholar]
- 30.Barzda V., Greenhalgh C., Squier J. Visualization of mitochondria in cardiomyocytes by simultaneous harmonic generation and fluorescence microscopy. Opt. Express. 2005;13:8263–8276. doi: 10.1364/opex.13.008263. [DOI] [PubMed] [Google Scholar]
- 31.Sun C.K., Yu C.H., Chan Y.F. In vivo and ex vivo imaging of intra-tissue elastic fibers using third-harmonic-generation microscopy. Opt. Express. 2007;15:11167–11177. doi: 10.1364/oe.15.011167. [DOI] [PubMed] [Google Scholar]
- 32.Bélisle J.M., Costantino S., Wiseman P.W. Sensitive detection of malaria infection by third harmonic generation imaging. Biophys. J. 2008;94:L26–L28. doi: 10.1529/biophysj.107.125443. [DOI] [PMC free article] [PubMed] [Google Scholar]
- 33.Olivier N., Aptel F., Beaurepaire E. Harmonic microscopy of isotropic and anisotropic microstructure of the human cornea. Opt. Express. 2010;18:5028–5040. doi: 10.1364/OE.18.005028. [DOI] [PubMed] [Google Scholar]
- 34.Débarre D., Olivier N., Beaurepaire E. Signal epidetection in third-harmonic generation microscopy of turbid media. Opt. Express. 2007;15:8913–8924. doi: 10.1364/oe.15.008913. [DOI] [PubMed] [Google Scholar]
- 35.Nishimura N., Schaffer C.B., Kleinfeld D. Targeted insult to subsurface cortical blood vessels using ultrashort laser pulses: three models of stroke. Nat. Methods. 2006;3:99–108. doi: 10.1038/nmeth844. [DOI] [PubMed] [Google Scholar]
- 36.Prahl S.A., Keijzer M., Welch A.J. A Monte Carlo model of light propagation in tissue. Dosimetry Laser Rad. Med. Biol. 1989;5:102–111. [Google Scholar]
- 37.Sherman D.L., Brophy P.J. Mechanisms of axon ensheathment and myelin growth. Nat. Rev. Neurosci. 2005;6:683–690. doi: 10.1038/nrn1743. [DOI] [PubMed] [Google Scholar]
- 38.Chernoff G.F. Shiverer: an autosomal recessive mutant mouse with myelin deficiency. J. Hered. 1981;72:128. doi: 10.1093/oxfordjournals.jhered.a109442. [DOI] [PubMed] [Google Scholar]
- 39.Débarre D., Beaurepaire E. Quantitative characterization of biological liquids for third-harmonic generation microscopy. Biophys. J. 2007;92:603–612. doi: 10.1529/biophysj.106.094946. [DOI] [PMC free article] [PubMed] [Google Scholar]
- 40.Reference deleted in proof.
- 41.Buckley C.E., Goldsmith P., Franklin R.J. Zebrafish myelination: a transparent model for remyelination? Dis. Model Mech. 2008;1:221–228. doi: 10.1242/dmm.001248. [DOI] [PMC free article] [PubMed] [Google Scholar]
- 42.Zumbusch A., Holtom G.R., Xie X.S. Three-dimensional vibrational imaging by coherent anti-Stokes Raman scattering. Phys. Rev. Lett. 1999;82:4142–4145. [Google Scholar]
- 43.Chen H., Wang H., Cheng J.X. A multimodal platform for nonlinear optical microscopy and microspectroscopy. Opt. Express. 2009;17:1282–1290. doi: 10.1364/oe.17.001282. [DOI] [PMC free article] [PubMed] [Google Scholar]
- 44.Olivier N., Luengo-Oroz M.A., Beaurepaire E. Cell lineage reconstruction of early zebrafish embryos using label-free nonlinear microscopy. Science. 2010;329:967–971. doi: 10.1126/science.1189428. [DOI] [PubMed] [Google Scholar]
- 45.Millard A.C., Wiseman P.W., Müller M. Third-harmonic generation microscopy by use of a compact, femtosecond fiber laser source. Appl. Opt. 1999;38:7393–7397. doi: 10.1364/ao.38.007393. [DOI] [PubMed] [Google Scholar]
- 46.Clay G.O., Millard A.C., Kleinfeld D. Spectroscopy of third-harmonic generation: evidence for resonances in model compounds and ligated hemoglobin. J. Opt. Soc. Am. B. 2006;23:932–950. [Google Scholar]
- 47.Tien A.C., Backus S., Mourou G. Short-pulse laser damage in transparent materials as a function of pulse duration. Phys. Rev. Lett. 1999;82:3883–3886. [Google Scholar]
- 48.Müller M., Squier J., Brakenhoff G.J. Dispersion pre-compensation of 15 femtosecond optical pulses for high-numerical-aperture objectives. J. Microsc. 1998;191:141–150. doi: 10.1046/j.1365-2818.1998.00357.x. [DOI] [PubMed] [Google Scholar]
- 49.Ji N., Magee J.C., Betzig E. High-speed, low-photodamage nonlinear imaging using passive pulse splitters. Nat. Methods. 2008;5:197–202. doi: 10.1038/nmeth.1175. [DOI] [PubMed] [Google Scholar]
- 50.Kerschensteiner M., Schwab M.E., Misgeld T. In vivo imaging of axonal degeneration and regeneration in the injured spinal cord. Nat. Med. 2005;11:572–577. doi: 10.1038/nm1229. [DOI] [PubMed] [Google Scholar]
Associated Data
This section collects any data citations, data availability statements, or supplementary materials included in this article.