

Abstract
The transcription of the genetic information encoded in DNA into RNA is performed by RNA polymerase (RNAP), a complex molecular motor, highly conserved across species. Despite remarkable progress in single-molecule techniques revealing important mechanistic details of transcription elongation (TE) with up to base-pair resolution, some of the results and interpretations of these studies are difficult to reconcile, and have not yet led to a minimal unified picture of transcription. We propose a simple model that accounts quantitatively for many of the experimental observations. This model belongs to the class of isothermal ratchet models of TE involving the thermally driven stochastic backward and forward motion (backtracking and forward tracking) of RNAP along DNA between single-nucleotide incorporation events. We uncover two essential features for the success of the model. The first is an intermediate state separating the productive elongation pathway from nonelongating backtracked states. The rates of entering and exiting this intermediate state modulate pausing by RNAP. The second crucial ingredient of the model is the cotranscriptional folding of the RNA transcript, sterically inhibiting the extent of backtracking. This model resolves several apparent differences between single-molecule studies and provides a framework for future work on TE.
Introduction
Transcription, the first step in converting the genetic information encoded in the genome into proteins and functional RNA transcripts, is a highly regulated process. Regulation occurs during all three phases of transcription: initiation, elongation, and termination (1). Here we focus on the elongation phase, during which RNA polymerase (RNAP) undergoes a biased random walk along DNA and processively extends the RNA transcript through the addition of ribonucleotides (NTPs). Transcription elongation (TE) does not proceed at a constant rate and is interrupted by the sequence-dependent pausing of RNAP at specific positions along the DNA template (1). Pauses are thought to play a regulatory role in the context of transcription termination, nucleotide misincorporation, regulatory factor binding, synchronization with translation, splicing and polyadenylation, and the folding of functional transcripts (1–9).
A large number of single-molecule studies have been published on TE, revealing many important details about the process (2,3,10–22). These single-molecule experiments apply forces on DNA, RNA, and RNAP with the expectation that the resulting effects on the transcription process mimic some of the basic actions of TE factors, nucleosomes, ribosomes, and other molecules which interact with RNAP in vivo. However, the interpretations of different studies often appeal to different mechanisms and putative conformational changes of RNAP, and appear to lead to contradictory conclusions. As a result, despite the novelty and elegance of the experimental techniques, these methods have not yet led to a unified picture of TE.
The goal of this article is to construct a model of TE that allows us to rationalize the majority of the experimental data within a single conceptual framework. Clearly, this is a tall order: TE is a complex and intrinsically kinetic process, one that involves time-dependent structural rearrangements of RNAP as well as the cotranscriptional folding of the RNA transcript. Even though the development of a full kinetic description is beyond the scope of this work, we use the experimental observations mentioned above to identify the essential set of key elements required to define a minimal model, consistent with the data. Beyond this, we also use the minimal model to evaluate some of the published explanations of the experimental observations.
Theory
Elongation complex
The basis for our work is the minimal structural model of the elongation complex (EC) (Fig. 1 a): a 12–14-bp transcription bubble stabilized by an 8–9-bp RNA-DNA hybrid and constraining interactions between nucleic acids and RNAP (1,9,23–33). This model is based on structural and biochemical data from studies on Eschericia coli (26–30), thermophilic bacteria (31,32), yeast (24,25), and archaea (33). The structural homology among bacterial, eukaryotic, and archaeal polymerases (33,34) implies that the qualitative conclusions drawn here apply to transcription elongation by multisubunit polymerases in general.
Figure 1.

(a) Kinematic scheme for the basic model of TE. The double stranded DNA template is shown in black with a 12 bp transcription bubble inside RNAP in gray. An NTP monomer (pink dots) is added to the RNA (dark red) transcript every catalytic cycle. The EC consists of DNA, RNA and RNAP, where the catalytic center is depicted by a blue dot. Different states of the EC are connected by mechanical and chemical transitions (arrows), with the notation described in the text. (b) Position distribution of RNA barriers to backtracking. The distribution of RNA folding barriers to backtracking estimated from empirical data is shown by red dots. This distribution is fit to an exponential function (solid blue line), yielding an estimate for the mean of −3.1 bp. (c) Kinematic scheme for the EBR model of TE, which includes an IS before backtracking. The NTP binding step and the bond formation step are the same as in panel a of this figure. State (44, 0′) is an IS, with translocation position 0, and the rate into (out of) this state from (to) state 0 is k+p (k−p).
The state of the EC is labeled by a pair of numbers—the transcript length and the translocation position. The translocation position is the displacement of the catalytic center (blue dot) relative to the 3′ end of the RNA (dark red) (corresponding to the last added nucleotide inside the RNAP (gray)). Alignment of the catalytic center with the 3′ end of the RNA is required for the addition of the next NTP to the transcript (1). The main steps of a typical elongation cycle are connected by red arrows in Fig. 1 a. Increasing the transcript length by one NTP monomer involves:
-
1.
The translocation of RNAP forward from the pre-translocated (translocation state 0) to the post-translocated state (translocation state 1), resulting in the opening of the catalytic center for the binding of the next NTP (pink dots) (for example, k+t (44,0)).
-
2.
The binding of the incoming NTP in the catalytic site (k+N).
-
3.
The irreversible formation of a phosphodiester bond (k+e).
The motion of RNAP between chemical incorporation steps may be thought of as a Brownian walk taking place on a sequence-dependent potential energy landscape (35). This walk involves both backtracked and hypertranslocated states, with the same transcript length but different translocation positions along DNA: positions less than 0 and greater than 1 for backtracked and hypertranslocated states, respectively. In general, forward translocation beyond state 0 is energetically unfavorable, because it requires shortening the RNA-DNA hybrid, and thus our model neglects translocation beyond position 1. The sequence dependence of our model arises in part from the sequence dependence of the rate of translocation, which is estimated from empirical measurements (see (35) and Translocation in the Supporting Material).
There is much evidence that the basic structure of the cycle is that shown in Fig. 1 a (see Catalytic Cycle in the Supporting Material), which defines a Brownian ratchet model of TE, where translocation from 0 to 1 is rectified by the binding of NTP and its incorporation (4,15,19,35–38). For the purpose of the discussion below, it is important to recognize that, because every cycle must involve at least one mechanical translocation step and NTP binding event, the probability of pausing at a particular transcript length and other measurable properties of elongation depend, in principle, on both externally applied forces and on the NTP concentration. The magnitude of these dependencies is controlled by the details of the kinetic process and by the precise values of the parameters associated with the elongation cycle.
RNA folding
Single-molecule experiments indicate that translocation rates are faster than the rate of transcription (3,11–15,17,21,39). Thus, RNAP could, in principle, backtrack far away from the active translocation state 1 at every transcript length, inhibiting productive elongation. In practice, experimental observations show that although backtracked pauses exist, the extent of backtracking is rather limited (23). We proposed previously that, in vitro, the mechanism for limiting backtracking is connected with the folding of RNA outside of the exit channel (35). For example, in Fig. 1 a (blue circle), RNAP is inhibited from moving further back than position −1, because such movement would require unzipping of the RNA hairpin behind the polymerase. The slow unzipping of the hairpin on the timescale of the translocational motion of RNAP leads to an effective, hairpin-induced, steric barrier to backtracking (35). Our hypothesis is supported by the observations that the hybridization of nascent RNA to short oligos suppresses backtracking and that short transcripts are associated with significant pausing and arresting (23,40).
A quantitative understanding of the interplay between the backtracking of RNAP and RNA folding (35,41) requires a detailed kinetic description of cotranscriptional folding, a rather complex problem which, to our knowledge, has not yet been adequately studied. Previously, we identified the positions of folding barriers and their effect on pausing by considering short transcripts where translocation is slower than RNA folding but faster than significant unfolding (35). As a result of this separation between translocation and folding timescales, we used the equilibrium fold for all of the available RNA at each translocation position, because the experimental data we considered originated from short templates of ∼100 bp (35).
Here we extend our approximation to longer transcripts by assuming that RNAP will only be affected by a fraction of the full RNA transcript. In vivo this may be due to the presence of ribosomes or accessory factors binding to the transcript. More generally, we expect that the RNA most recently extruded from RNAP participates in local secondary structure first, before interacting with more remote regions of the transcript (42). For the purposes of this article, we use a simplified model in which, at each RNAP translocation position, we fold a fixed number of bases behind the enzyme into the lowest energy equilibrium fold. Given the sequence, the positions of the barriers to backtracking are then calculated by using empirical data, with no adjustable parameters (35). The distribution of the resulting RNA folding barriers converges to an exponential, with a mean barrier position of −3.1 bp, as the number of bases allowed to fold behind RNAP increases to 150 (see Fig. 1 b and Cotranscriptional Folding in the Supporting Material). The number of bases required for convergence and the mean barrier position are in quantitative agreement with recently published calculations (43), which are motivated by the results presented here. The simplified treatment of RNA folding described here determines the extent of backtracking by RNAP in our simulations of TE (see Pause Statistics in the Results section below).
Modeling approach
Our previous work used the model presented above (Fig. 1 a) to predict the sequence-dependent positions of experimentally observed backtracked pauses at low NTP concentrations (35). Our analysis showed that, in this limit, where the incorporation rates are small, the positions of these pauses are determined primarily by the translocation free energy landscape and a sequence-dependent length scale set by cotranscriptional RNA folding at each transcript length (35). Indeed, the pause positions could be predicted by a purely local thermodynamic equilibrium argument, using only one adjustable parameter (35). Our previous work also showed that the kinetics of recovery from local-equilibrium-paused complexes agreed with the predictions of the local thermodynamic equilibrium approach.
This article goes beyond our previous analysis, and uses a combination of analytic arguments and more detailed full kinetic simulations to address more complex questions by comparing the predictions of an extended model with the results of single-molecule experiments. Rather than fine-tuning simulation parameters to exactly match each experimental result, we try to understand a broad range of experiments by using a single unified set of parameters. We then use the resulting model to predict the force dependence of single-molecule observables and to test proposed explanations for the results of several single-molecule experiments. Wherever possible, we use the same representation of the data and the same measure of statistical significance as the experimental articles.
Results
The experimental studies mentioned above focus on a number of important aspects of TE:
-
1.
The elongation velocity distribution and/or mean elongation velocity of RNAP as a function of NTP concentration, applied force, and temperature (3,10–15,17,19–22).
-
2.
Pause site positions along DNA (17,18).
-
3.
The duration, density (pause number per template length), and efficiency (fraction of RNAPs which pause at each site) of pauses and their dependence on applied force, NTP concentration, and temperature (3,10–12,14,17,18,20–22).
-
4.
The effect of pulling on the nascent RNA (21).
In our previous publication we discussed the sequence dependence of pause positions (35); and we comment on the RNA pulling experiments in Cotranscriptional Folding in the Supporting Material. In this article, we focus primarily on the remaining two features: the elongation velocity of RNAP and the statistics of pausing along DNA.
Elongation velocity
Main pathway
We proceed by considering the simplest model of elongation which ignores all states but those on the main pathway (red arrows in Fig. 1 a). In this special case, the average elongation velocity is given by
| (1) |
where δ is the translocation distance between positions 0 and 1, δ1 is the distance from 0 to the transition state between 0 and 1, and f is the force (Fig. 2 a). The parameters are the translocation rates at zero force, where the sequence dependence is not explicitly shown. It is important to note that Eq. 1 is different and more general than previous expressions for the mean elongation velocity as it is derived by calculating the first passage time from state (m,0) to state (m + 1, 0) without assuming local equilibration between translocation states 0 and 1 (3,11,13,15,19,35,37).
Figure 2.

(a) Schematic of the translocation free energy landscape between positions 0 and 1. The translocation transition state corresponds to the maximum energy position (of energy G∗m,(0,1)) between states 0 (of energy Gm,0) and 1 (of energy Gm,1) and is a distance δ1 from position 0. The full translocation step distance, δ, is equal to δ1 + δ2. Note that state 1 is of higher energy than state 0 due to the loss of a basepair bond from the DNA-RNA hybrid of the EC. (b and c) Global fit of published force-velocity data from single-molecule experiments (15) to Eq. 1 (χ2ν = 0.62, ν = 34, p(χ2ν) = 0.96). All of the data in both figures are fit simultaneously. (b) Force-velocity data at four NTP concentrations, from bottom: Neq, 10 Neq, 100 Neq, and 250 Neq, where Neq = {10 μM GTP, 10 μM UTP, 5 μM ATP, 2.5 μM CTP} are concentrations satisfying the “magic ratio” defined previously (15). These data show that the mean velocity changes gradually as a function of applied force. (c) NTP concentration-velocity data at a fixed force of 27.3–28 pN. The mean elongation velocity increases as a function of NTP concentration and saturates at high concentrations.
One attempt to generate experimental data corresponding solely to the main pathway involves removing backtracking events from single-molecule traces (15). This can be done reliably at low NTP concentrations because TE is sufficiently slow to allow for single base-pair resolution in the measurement of RNAP's mean translocation position at each transcript length. At high NTP concentrations, the experimental resolution is only 3 bp, but the probability of backtracking is small (15). A global fit of Eq. 1 to the mean velocity resulting from this treatment of single-molecule data (15) is shown in Fig. 2, b and c (p = 0.96). This fit is a validation of the Brownian ratchet model for TE, and yields δ = 1.2 ± 0.22 bp (see Table S1 in the Supporting Material), consistent with the absence of backtracking. In addition, the estimate δ1 = 0.71 ± 0.26 bp (Table S1) indicates that thermal equilibrium is not established between states 0 and 1 at each transcript length.
Such a nonequilibrium effect, which has not been taken into account in previous models of TE (15,35–38), also leads to a stronger force dependence of the average elongation velocity (Eq. 1) than that predicted by assuming local equilibrium at each transcript length (Fig. 1 a). Moreover, the quality of this fit to our conceptually simpler model indicates that a more complex model with two NTP binding sites (15) is not necessary to explain this data (see Refitting in the Supporting Material).
We also want to comment on the relationship between the average elongation velocity in Eq. 1 and the velocity of individual enzymes. Because RNAP undergoes a stochastic motion along DNA, the mean velocity should be computed by averaging the velocities of individual traces at a fixed applied force and NTP concentration. Since velocities associated with individual traces drop sharply to zero at different stalling forces due to entry into an off-pathway state, one expects a gradual change in the mean velocity as a function of force (see Fig. 2, b and c). By contrast, the procedure of normalizing the force-velocity curves before averaging leads to a mean normalized velocity exhibiting a sharp drop at a specific stalling force (3,11–14,21,22). We stress that the procedure of fitting the average of normalized data to the local equilibrium version of Eq. 1 is unjustified and leads to unphysiologically large values for the typical RNAP translocation step of δ ≈ 9 ± 1 bp (11) and 152 ± 8 bp (3).
We note that Eq. 1 can be used to describe the dependence of the mean elongation velocity on applied force even if RNAP possesses off-pathway states, as long as the transitions from the main pathway into these states, and additional off-pathway transitions, are force-independent—a condition which eliminates both backtracked and hypertranslocated RNAP configurations (e.g., see Eq. S6 in Effective Parameters in the Supporting Material). This observation explains the relevance of Eq. 1 to a model including an intermediate state (IS) (see below).
Furthermore, there have been a number of different conformational changes associated with the elongation process (4,27,44–52), but these have not yet been disentangled from single-molecule data. Nevertheless, Eq. 1 describes the mean elongation velocity for an entire class of models including conformational changes of RNAP (see Effective Parameters in the Supporting Material) and thus several of the parameters in this equation can be regarded as effective parameters (e.g., Eqs. S7–S10). However, if a conformational change involves an extra mechanical transition, this can introduce additional force dependence (e.g., Eq. S3).
Finally, the parameters of Eq. 1 are enzyme- and sequence-dependent. Indeed, individual enzymes exhibit different velocities for identical conditions and sequences (16). However, even though some groups have made considerable efforts to determine the sequence dependence of the main pathway transitions (17,19), this dependence is not completely understood (see Catalytic Cycle, Pause Mechanism, and Intermediate State Pauses in the Supporting Material).
Intermediate state
Having discussed specific behavior associated with the main pathway, we now consider a more complex model of TE including backtracked states and RNA folding upstream of (behind) RNAP. This involves carrying out stochastic simulations of the model depicted in Fig. 1 a (see Simulation Methods in the Supporting Material).
The first experimental observation we address is the bimodal elongation velocity distribution, which consists of a small peak accounting for ∼8% of the distribution, associated with the paused RNAP, and a substantially larger peak at a nonzero velocity corresponding to the productively elongating enzyme (Fig. 2G in Adelman et al. (10)). Surprisingly, simulations of the model in Fig. 1 do not result in a bimodal distribution for physiologically reasonable parameter values, because RNAP pauses frequently and quickly arrests leading to a unimodal distribution peaking at zero velocity (see Fig. 3 a and Without the Intermediate State in the Supporting Material). At the same time, the unphysically large barriers to backtracking required for a productive elongation velocity peak consistent with experiment (10) lead to almost complete depletion of the backtracking events and to a dramatically decreased weight of the zero velocity peak. More specifically, in Alternatives to the Intermediate State in the Supporting Material we examine several possible solutions to the problem of excessive backtracking that include:
-
1.
Changing the RNA folding barrier distribution.
-
2.
Adding a constant energy to all backtracked states.
-
3.
Increasing the transition-state barrier height between states 0 and .
Figure 3.
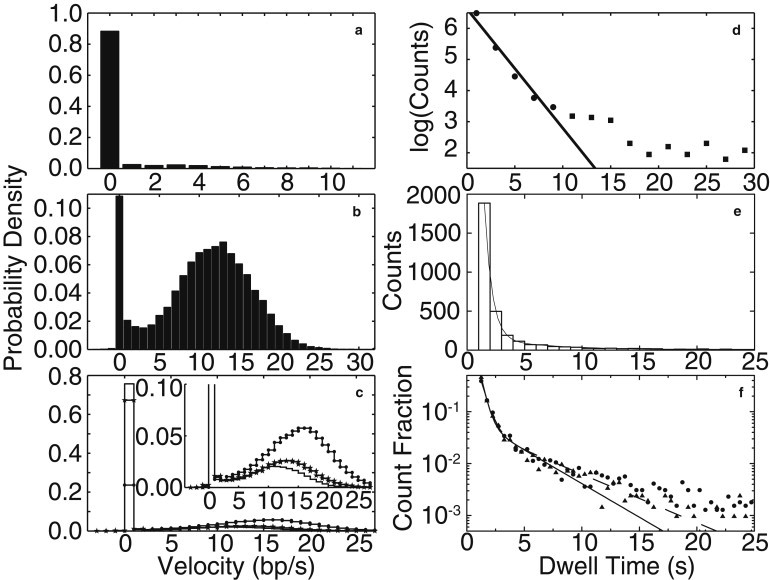
(a–c) RNAP elongation velocity distributions from 200 simulation runs at 1 mM NTP. Note that the pause peaks are much narrower and higher than those observed experimentally, because measurement noise is not present in the simulated data (10,11). (a, b, and d) The simulations associated with these panels were stopped at the first 30 s pause. (c, e, and f) The results in these panels correspond to a maximum simulation time of 2000 s. (a) The velocity distribution from simulations of a model for TE at pN with no IS, corresponding to the kinetic scheme shown in Fig. 1a. This distribution has a single peak due to excessive pausing by RNAP. (b) The velocity distribution from simulations of the EBR model at pN, with the IS as shown in Fig. 1c. Note that this distribution is bimodal due to the presence of the IS. (c) Velocity distributions at three applied forces from simulations of the EBR model with an IS, −7 pN (no symbol), −4 pN (stars), and 7 pN (dots). (Inset) The same data is plotted on a scale suitable for comparison with published distributions (11). Note that the velocity distribution is strongly force-dependent. (d) The dwell time distribution of short pauses at 1 mM NTP from simulations of the EBR model (200 simulation runs). The solid line is an exponential fit to a dwell-time distribution of pauses with durations less than 10 s. The duration distribution of these pauses is characterized by the mean dwell time of τ = 2.6 s found from the fit. The fit indicates that very short pauses are characterized by a single timescale. (e) The dwell time distribution for short pauses (1 s < td < 25 s) at 7.3 pN, 250 μM GTP, and 1 mM other NTPs from simulations of the EBR model (300 simulation runs). The solid line is a fit to a double-exponential function (Eq. 3) (τ1 = 0.65 ± 0.01 s (91 ± 2%) and τ2 = 6.0 ± 0.4 s (9 ± 2%) (R2 = 1.00)). This fit implies that short pauses have two timescales. (f) The dwell time distribution from simulations of the EBR model (300 runs) for two different applied forces, with fits to a double-exponential function (Eq. 3). The fit parameters for the data at −7 pN (solid circles) are τ1 = 0.54 ± 0.02 s (88 ± 3%) and 4.6 ± 0.5 s (12 ± 3%) (R2 = 1.00, dashed line). The fit parameters corresponding to the 7 pN data (triangles) are τ1 = 0.41 ± 0.01 (93 ± 3%) and τ2 = 3.4 ± 0.3 s (7 ± 3%) (R2 = 1.00, solid line). The change in the fit parameters with force implies that the pause duration distribution is force-dependent.
In each case, these changes result in a reduction of the frequency of pausing below that observed experimentally (10).
We resolve this shortcoming of the simple Brownian ratchet model by adopting the idea that backtracked pauses are regulated by a conformational change of the EC occurring between the main pathway and backtracked states (Fig. 1 c). The IS associated with this conformational change is connected to state 0 through force-independent rates. ISs have been discussed in a number of experimental contexts (4,48–52), some of which may be relevant to the current discussion. The existence of an IS has also been proposed to explain the force independence of some single molecule observables (11,17,21), a suggestion we examine by simulation. The specific choice for the values of the entry and exit rates in and out of the IS is discussed in Intermediate State Rates in the Supporting Material.
Velocity distributions
Simulations of the extended Brownian ratchet (EBR) model—that includes both an IS and RNA folding barriers to backtracking (Fig. 1 c)—quantitatively reproduces the experimentally measured distribution of RNAP velocities (10) (Fig. 3 b). The weight under the pause peak at zero velocity indicates that RNAP spends 11% of its time in a paused state and is consistent with the 8% weight found from experimental observation (10). The position of the second peak (12.0 bp/s) and the standard deviation of the peak (4.6 bp/s) both show quantitative agreement with experiment, where the peak position is 12.8 bp/s and the standard deviation is 4.9 bp/s (10).
The velocity distributions predicted by our simulations of the EBR model (Fig. 1 c) are strongly force-dependent (Fig. 3 c). At −7 pN, the run velocity (difference between the peaks (11)) is 10.7 ± 4.4 bp/s (± standard deviation) and the percentage of time spent in a paused state is 76%. These characteristics change to 12.0 ± 4.8 bp/s and 68% at −4 pN and to 14.3 ± 5.3 bp/s and 24% at 7 pN. The large weight under the pause peak for a −7 pN load force is consistent with pause duration measurements at the same force (2,11) (see With Intermediate State in the Supporting Material). Thus, we find that the presence of the IS is not sufficient to explain the force independence of the velocity distribution asserted in Neuman et al. (11), a claim which contradicts the subsequent experimental observations of a force-dependent mean velocity (3,15,19,22).
Transcriptional pauses
Due to the important role of pausing in regulating various aspects of transcription and thus other cellular processes, understanding the mechanisms of pausing by RNAP has been an important focus of many single-molecule experiments. Three classes of pauses have been discussed in the single-molecule literature:
-
1.
Backtracked pauses, where RNAP moves backward along DNA, at a fixed transcript length (2,3,11–15,18,19,22).
-
2.
Pre-translocated pauses, where RNAP lingers in the pre-translocated state for a time longer than the average dwell time at position 0 (17,19,37).
-
3.
IS pauses, where RNAP resides in the IS (11,17,21).
Pauses have also been categorized as long or short, depending on their duration td (2,11). Although there is agreement that long pauses td > 20–30 s (2,10,11) are backtracked, the mechanism for short pauses 1 s < td < 20–30 s is a matter of debate (2,3,11–15,17–19,21,22) (see below).
We adopt the following strategy, already outlined in Modeling Approach, above, to validate the simulated model and parameter choices: first we compare pause duration distributions (10,17), the average pause duration (2), the average densities of pauses along DNA (2,10,17), the pause frequency (20), and the mean extents of backtracking (2) produced by our simulations to experimental observations for a variety of experimental conditions. The remarkable agreement we achieve with multiple experiments from different publications using a single set of parameters allows us to predict the force dependence of pause properties, and then to use these predictions to comment on experimental force-dependence measurements and on some inconsistencies of interpretation.
Pause statistics
Simulations of the EBR model (Fig. 1 c) yield the distributions of short pause durations (1–25 (30) s) shown in Fig. 3, d and e, in qualitative agreement with many experiments (3,10,11,17,21,22) (see Pause Durations in the Supporting Material). Very short pauses (1 s < td < 10 s) have a dwell-time distribution described by an exponential function
| (2) |
This function is fit to pause events with durations shorter than 10 s (dots) (Fig. 3 d) and yields a mean pause duration of τ = 2.6 s, to be compared to the experimentally determined value of τ = 2.3 s (10).
Another study of slightly longer (short) pauses (1 s < td < 25 s), for different NTP concentrations and for a different applied force, used a double-exponential function
| (3) |
to fit the observed dwell-time distribution (17). Under the same conditions as this experiment, our simulations also produce a double-exponential dwell-time distribution, with components τ1 = 0.65 ± 0.01 s (91 ± 2%) and τ2 = 6.0 ± 0.4 s (9 ± 2%) (R2 = 1.00), in good agreement with the fit to the experimental data (Fig. 3 e), where τ1 = 1.2 ± 0.1 s (80%) and τ2 = 7.4 ± 1.2 s (20%) (% errors and fit quality are not given (17)). Pause duration distributions may also be fit to a power law (3,22,53). We discuss the significance of both power law and double-exponential fits in Pause Durations in the Supporting Material.
Our simulations also generate long pauses (td > 20 s), which are mostly backtracked, in agreement with observation (2). For both long and short pauses, we find that the backtracking distances calculated from our simulations are in excellent agreement with those measured experimentally (2). This agreement lends support to our hypothesis that the extent of backtracking is controlled by RNA folding, because the backtracking distances are largely determined by the RNA folding barrier distribution in our simulations (Fig. 1 b).
Overall, as summarized in Table 1, the mean pause duration (dwell time), density, frequency, and backtracking distance statistics of short and long pauses are in very close agreement with experiments carried out at fixed NTP concentrations and fixed applied forces.
Table 1.
Pause statistics from simulations of the EBR model
| Experiment (Ref) No. RNAPs | Simulation | Conditions | |
|---|---|---|---|
| Short pauses | |||
| Density (10−3 bp–1) 1 s < td < 30 s | 4 (10) 30 RNAPs | 5.2 ± 0.2∗ | −4 pN and 1 mM NTPs |
| Density (10−3 bp–1) 1 s < td < 25 s | 9 (17) 114 RNAPs | 3.1 ± 0.1∗ | 7.3 pN, 250 μM GTP and 1 mM other NTPs |
| Backtracking distance (bp) 1 s < td < 5 s | <1 (2) 56 RNAPs | 0.54 ± 0.02† | −8.4 pN and 1 mM NTPs |
| Frequency (10−2 s–1) 1 s < td < 25 s | 8 (20) 113 RNAPs | 10 ± 0.2† | −8.4 pN and 1 mM NTPs |
| Long pauses | |||
| Density (10−4 bp–1) td > 20 s | 9.5 ± 2.1 (2) 56 RNAPs | 16 ± 1† | −8.4 pN and 1 mM NTPs |
| Duration (s) td > 20 s | 77 ± 11 (+4–15 s) (2) 56 RNAPs | 196 ± 7† | −8.4 pN and 1 mM NTPs |
| Backtracking distance (bp) td > 20 s | 4.7 ± 0.8 (2) 56 RNAPs | 4.2 ± 0.2† | −8.4 pN and 1 mM NTPs |
Means are quoted with estimates for the standard errors in the means.
200 simulation runs.
300 simulation runs.
Force dependence of pause properties
Here we use our simulations of the EBR model, with the same model parameters as above, and physiological NTP concentrations, to compute the pause properties discussed above at different values of the applied force. The results of these computations are shown in Table 2 and Fig. 3 f. Our simulations indicate that long pauses (td > 20 s) are mostly backtracked, and that the mean duration, mean backtracking position, and mean density of these pauses are all force-dependent, in agreement with experiment (2,12). In particular, we find very good agreement with the experimentally measured change in the mean density of long pauses with force: this density changes from 9.5 ± 2.1 × 10⁻⁴ bp–1 at −8.4 pN to ∼3 × 10⁻⁵ bp–1 at 8.4 pN in experiment (2), in comparison to 1.6 ± 0.1 × 10⁻³ bp–1 at −8.4 pN and 1.3 ± 1 × 10⁻⁴ at 8.4 pN in simulations.
Table 2.
Predicted force dependence of pause statistics at 1 mM NTP from simulations of the EBR model
| Force (pN) | −7 | 7 |
|---|---|---|
| Short pauses (1 < td < 25 s) | ||
| Density (10−3 bp–1)∗ | 8.5 ± 0.1 | 2.1 ± 0.1 |
| Backtracking distance (bp)† | 1.3 ± 0.02 | 1.1 ± 0.02 |
| Mean duration (s) (Fig. 3 f)† | 1.0 ± 0.03 | 0.6 ± 0.03 |
| Frequency (10−2 s–1)† | 9.1 ± 0.2 | 2.9 ± 0.2 |
| Force (pN) | −8.4 | 8.4 |
| Long pauses (td > 20 s) | ||
| Density (10−4 bp–1)† | 16 ± 1 | 1.3 ± 1 |
| Backtracking distance (bp)† | 4.2 ± 0.2 | 3.0 ± 0.2 |
| Duration (s)† | 196 ± 7 | 120 ± 7 |
| Arrest %† (td > 600 s) | 66 ± 5 | 3 ± 4 |
Means are quoted with estimates for the standard errors in the means.
200 simulation runs.
300 simulation runs.
In the case of short pauses (1 s < td < 25 s) we compare the dwell-time distribution and mean short pause density predicted by the EBR model, the two properties for which experimental force-dependent data exists (11,17,21,18), with experiment. Short pause dwell-time distributions are claimed to be force-independent in general due to the IS state (11,17,21), although one example of a short force-dependent backtracked pause has been reported (18). The simulation results for the dwell-time distributions for opposing (−7 pN) and assisting (7 pN) forces at 1 mM NTP are shown in Fig. 3 f. Both the distribution and the mean pause duration are force-dependent, but on scales difficult to access experimentally (i.e., the low probability scale associated with the tail of the distribution and the short timescale associated with the mean duration. See Pause Duration Distributions and Force Dependence in the Supporting Material).
However, there is a clear disagreement between our simulation results and experimental findings with regard to the density of short pauses. As shown in Table 2, the simulated short pause density is significantly force-dependent, changing from 0.85 per 100 bp at −7 pN to 0.21 per 100 bp at 7 pN, in contradiction with the force independence claimed experimentally (11). We speculate that the measured force independence of the short pause density is due to limited experimental resolution in time and position, preventing the accurate counting of pauses (see Force Dependence in the Supporting Material). This difficulty is circumvented in our simulations, where all pauses are identified.
Finally, we reiterate that force independence cannot be a consequence of the presence of an IS, as has been proposed previously (11,17). The presence of at least one translocation step per elongation cycle implies that pause properties must be, in principle, force- (and sequence-) dependent (see Intermediate State Pauses in the Supporting Material).
Pausing mechanisms
Although there is consensus that the majority of long pauses involve backtracking of RNAP (here we do not include RNA hairpin-dependent pauses (51)), single-molecule experiments at (large) physiological NTP concentrations were used to conclude that short pauses are predominantly of the IS type (11). To examine this proposal, we perform an analysis of the short pauses generated by our simulations (see Pause Mechanism in the Supporting Material). When backtracked states are removed from the model, most pauses longer than 1.5 s are absent, resulting in a 10% decrease in the number of short pauses. This implies that in simulations of the full EBR model, at least 10% of the short pauses are backtracked. In addition, we determine that 52% of short pauses are pre-translocated in simulations of the full model by counting the pause events where RNAP resided in the pre-translocated state for more than half of the pause duration. It then follows that IS pauses only account for <38% of short pauses. Thus, by contrast to the conclusions in Neuman et al. (11), the most common pauses are not of the IS type. Moreover, backtracked pauses account for almost all of the pauses longer than 1.5 s in duration.
Discussion
This article presents a unified analysis of the published single-molecule observations of transcription elongation, based on an extended Brownian ratchet model. The extended model incorporates two features, required for qualitative and often quantitative agreement with experiment:
-
1.
Barriers to backtracking due to RNA folding upstream of RNA polymerase.
-
2.
An IS between the main pathway and backtracked states.
There are three principal points revealed by our analysis of transcription elongation that we want to highlight:
-
1.
Our expression (Eq. 1) for the force-dependent mean elongation velocity leads us to question previous fits to (normalized) force velocity data (3,11). More importantly, this expression is consistent with a large number of models with no backtracking, and thus the parameters in Eq. 1 should be regarded as effective parameters. As a result, additional experiments are required to distinguish between alternate models.
-
2.
In principle, all properties of the transcription process are force-dependent, due to the necessary translocation step on the main pathway. In turn, this implies that behavior related to presence of the IS is also force-dependent, because this state is connected to the main pathway. We use our simulations to estimate the magnitude of the force dependence associated with various aspects of transcription elongation, estimates which cause us to question some of the conclusions drawn from single-molecule observations (e.g., the absence of force dependence due to the IS (11,17,21)).
-
3.
Our simulations predict that long pauses are typically backtracked. In contrast, we find that no single pause mechanism is responsible for short pauses, and thus pausing in the IS does not account for the majority of short pauses, as shown quantitatively above.
We also suggest two related directions for future experiments that could verify some of our conclusions and more generally, would uncover additional details of the transcription process. These suggestions are concerned with the regime of low NTP concentrations, in which case the average position of RNAP at each transcript length can be measured with single basepair resolution (15). In this limit:
-
1.
The fact that pauses can be observed and counted more accurately can be used to determine pausing mechanisms and pause statistics (e.g., this would allow us to address the discrepancy in the force dependence of the pause density between experiment (11) and simulation).
-
2.
The sequence dependence of velocity and pause properties could be experimentally extracted from repeated measurements on specifically engineered sequences (as has been attempted at high NTP concentrations (17,19)).
In closing, we emphasize a point which speaks to the main motivation for this study: although recent single-molecule experiments represent major technical accomplishments, the type of synthesis we have attempted here is critical to realizing the potential impact of these experiments on biology in real cellular environments.
Acknowledgments
We acknowledge discussions with S. F. Nørrelykke, M. Depken, S. W. Grill, and E. A. Galburt. We also thank S. M. Block for kindly supplying us with the experimental data presented in Fig. 2, b and c.
The work presented here was partially supported by National Institutes of Health grant No. R01-GM058750.
Supporting Material
References
- 1.Greive S.J., von Hippel P.H. Thinking quantitatively about transcriptional regulation. Nat. Rev. Mol. Cell Biol. 2005;6:221–232. doi: 10.1038/nrm1588. [DOI] [PubMed] [Google Scholar]
- 2.Shaevitz J.W., Abbondanzieri E.A., Block S.M. Backtracking by single RNA polymerase molecules observed at near-base-pair resolution. Nature. 2003;426:684–687. doi: 10.1038/nature02191. [DOI] [PMC free article] [PubMed] [Google Scholar]
- 3.Galburt E.A., Grill S.W., Bustamante C. Backtracking determines the force sensitivity of RNAP II in a factor-dependent manner. Nature. 2007;446:820–823. doi: 10.1038/nature05701. [DOI] [PubMed] [Google Scholar]
- 4.Bar-Nahum G., Epshtein V., Nudler E. A ratchet mechanism of transcription elongation and its control. Cell. 2005;120:183–193. doi: 10.1016/j.cell.2004.11.045. [DOI] [PubMed] [Google Scholar]
- 5.Landick R., Turnbough C.J., Yanofsky C. Escherichia coli and Salmonella. In: Neidhardt F.C., Curtiss R. III, Ingraham J.L., Lin E.C.C., Low K.B., Magasanik B., Rfznikopp W.S., Riley M., Schaechter M., Umbarger H.E., editors. Cellular and Molecular Biology. American Society for Microbiology; Washington, DC: 1996. pp. 1263–1286. [Google Scholar]
- 6.de la Mata M., Alonso C.R., Kornblihtt A.R. A slow RNA polymerase II affects alternative splicing in vivo. Mol. Cell. 2003;12:525–532. doi: 10.1016/j.molcel.2003.08.001. [DOI] [PubMed] [Google Scholar]
- 7.Yonaha M., Proudfoot N.J. Specific transcriptional pausing activates polyadenylation in a coupled in vitro system. Mol. Cell. 1999;3:593–600. doi: 10.1016/s1097-2765(00)80352-4. [DOI] [PubMed] [Google Scholar]
- 8.Pan T., Sosnick T. RNA folding during transcription. Annu. Rev. Biophys. Biomol. Struct. 2006;35:161–175. doi: 10.1146/annurev.biophys.35.040405.102053. [DOI] [PubMed] [Google Scholar]
- 9.Nudler E., Mustaev A., Goldfarb A. The RNA-DNA hybrid maintains the register of transcription by preventing backtracking of RNA polymerase. Cell. 1997;89:33–41. doi: 10.1016/s0092-8674(00)80180-4. [DOI] [PubMed] [Google Scholar]
- 10.Adelman K., La Porta A., Wang M.D. Single molecule analysis of RNA polymerase elongation reveals uniform kinetic behavior. Proc. Natl. Acad. Sci. USA. 2002;99:13538–13543. doi: 10.1073/pnas.212358999. [DOI] [PMC free article] [PubMed] [Google Scholar]
- 11.Neuman K.C., Abbondanzieri E.A., Block S.M. Ubiquitous transcriptional pausing is independent of RNA polymerase backtracking. Cell. 2003;115:437–447. doi: 10.1016/s0092-8674(03)00845-6. [DOI] [PubMed] [Google Scholar]
- 12.Forde N.R., Izhaky D., Bustamante C. Using mechanical force to probe the mechanism of pausing and arrest during continuous elongation by Escherichia coli RNA polymerase. Proc. Natl. Acad. Sci. USA. 2002;99:11682–11687. doi: 10.1073/pnas.142417799. [DOI] [PMC free article] [PubMed] [Google Scholar]
- 13.Wang M.D., Schnitzer M.J., Block S.M. Force and velocity measured for single molecules of RNA polymerase. Science. 1998;282:902–907. doi: 10.1126/science.282.5390.902. [DOI] [PubMed] [Google Scholar]
- 14.Davenport R.J., Wuite G.J., Bustamante C. Single-molecule study of transcriptional pausing and arrest by E. coli RNA polymerase. Science. 2000;287:2497–2500. doi: 10.1126/science.287.5462.2497. [DOI] [PubMed] [Google Scholar]
- 15.Abbondanzieri E.A., Greenleaf W.J., Block S.M. Direct observation of base-pair stepping by RNA polymerase. Nature. 2005;438:460–465. doi: 10.1038/nature04268. [DOI] [PMC free article] [PubMed] [Google Scholar]
- 16.Tolicà-Nørrelykke S.F., Engh A.M., Gelles J. Diversity in the rates of transcript elongation by single RNA polymerase molecules. J. Biophys. Chem. 2004;279:3292–3299. doi: 10.1074/jbc.M310290200. [DOI] [PubMed] [Google Scholar]
- 17.Herbert K.M., La Porta A., Block S.M. Sequence-resolved detection of pausing by single RNA polymerase molecules on periodic templates reveals an elemental pause state. Cell. 2006;125:1083–1094. doi: 10.1016/j.cell.2006.04.032. [DOI] [PMC free article] [PubMed] [Google Scholar]
- 18.Shundrovsky A., Santangelo T.J., Wang M.D. A single-molecule technique to study sequence-dependent transcription pausing. Biophys. J. 2004;87:3945–3953. doi: 10.1529/biophysj.104.044081. [DOI] [PMC free article] [PubMed] [Google Scholar]
- 19.Bai L., Fulbright R.M., Wang M.D. Mechanochemical kinetics of transcription elongation. Phys. Rev. Lett. 2007;98:068103. doi: 10.1103/PhysRevLett.98.068103. [DOI] [PubMed] [Google Scholar]
- 20.Abbondanzieri E.A., Shaevitz J.W., Block S.M. Picocalorimetry of transcription by RNA polymerase. Biophys. J. 2005;89:L61–L63. doi: 10.1529/biophysj.105.074195. [DOI] [PMC free article] [PubMed] [Google Scholar]
- 21.Dalal R.V., Larson M.H., Block S.M. Pulling on the nascent RNA during transcription does not alter kinetics of elongation or ubiquitous pausing. Mol. Cell. 2006;23:231–239. doi: 10.1016/j.molcel.2006.06.023. [DOI] [PMC free article] [PubMed] [Google Scholar]
- 22.Mejia Y.X., Mao H., Bustamante C. Thermal probing of E. coli RNA polymerase off-pathway mechanisms. J. Mol. Biol. 2008;382:628–637. doi: 10.1016/j.jmb.2008.06.079. [DOI] [PMC free article] [PubMed] [Google Scholar]
- 23.Komissarova N., Kashlev M. Transcriptional arrest: Escherichia coli RNA polymerase translocates backward, leaving the 3′ end of the RNA intact and extruded. Proc. Natl. Acad. Sci. USA. 1997;94:1755–1760. doi: 10.1073/pnas.94.5.1755. [DOI] [PMC free article] [PubMed] [Google Scholar]
- 24.Gnatt A.L., Cramer P., Kornberg R.D. Structural basis of transcription: an RNA polymerase II elongation complex at 3.3 Å resolution. Science. 2001;292:1876–1882. doi: 10.1126/science.1059495. [DOI] [PubMed] [Google Scholar]
- 25.Cramer P., Bushnell D.A., Kornberg R.D. Structural basis of transcription: RNA polymerase II at 2.8 Ångstrom resolution. Science. 2001;292:1863–1876. doi: 10.1126/science.1059493. [DOI] [PubMed] [Google Scholar]
- 26.Vassylyev D.G., Vassylyeva M.N., Artsimovitch I. Structural basis for transcription elongation by bacterial RNA polymerase. Nature. 2007;448:157–162. doi: 10.1038/nature05932. [DOI] [PubMed] [Google Scholar]
- 27.Vassylyev D.G., Vassylyeva M.N., Landick R. Structural basis for substrate loading in bacterial RNA polymerase. Nature. 2007;448:163–168. doi: 10.1038/nature05931. [DOI] [PubMed] [Google Scholar]
- 28.Darst S.A., Polyakov A., Zhang G. Insights into Escherichia coli RNA polymerase structure from a combination of x-ray and electron crystallography. J. Struct. Biol. 1998;124:115–122. doi: 10.1006/jsbi.1998.4057. [DOI] [PubMed] [Google Scholar]
- 29.Korzheva N., Mustaev A., Darst S.A. A structural model of transcription elongation. Science. 2000;289:619–625. doi: 10.1126/science.289.5479.619. [DOI] [PubMed] [Google Scholar]
- 30.Naryshkin N., Revyakin A., Ebright R.H. Structural organization of the RNA polymerase-promoter open complex. Cell. 2000;101:601–611. doi: 10.1016/s0092-8674(00)80872-7. [DOI] [PubMed] [Google Scholar]
- 31.Zhang G., Campbell E.A., Darst S.A. Crystal structure of Thermus aquaticus core RNA polymerase at 3.3 Å resolution. Cell. 1999;98:811–824. doi: 10.1016/s0092-8674(00)81515-9. [DOI] [PubMed] [Google Scholar]
- 32.Vassylyev D.G., Sekine S., Yokoyama S. Crystal structure of a bacterial RNA polymerase holoenzyme at 2.6 Å resolution. Nature. 2002;417:712–719. doi: 10.1038/nature752. [DOI] [PubMed] [Google Scholar]
- 33.Hirata A., Klein B.J., Murakami K.S. The x-ray crystal structure of RNA polymerase from Archaea. Nature. 2008;451:851–854. doi: 10.1038/nature06530. [DOI] [PMC free article] [PubMed] [Google Scholar]
- 34.Ebright R.H. RNA polymerase: structural similarities between bacterial RNA polymerase and eukaryotic RNA polymerase II. J. Mol. Biol. 2000;304:687–698. doi: 10.1006/jmbi.2000.4309. [DOI] [PubMed] [Google Scholar]
- 35.Tadigotla V.R., O Maoiléidigh D., Ruckenstein A.E. Thermodynamic and kinetic modeling of transcriptional pausing. Proc. Natl. Acad. Sci. USA. 2006;103:4439–4444. doi: 10.1073/pnas.0600508103. [DOI] [PMC free article] [PubMed] [Google Scholar]
- 36.Guajardo R., Sousa R. A model for the mechanism of polymerase translocation. J. Mol. Biol. 1997;265:8–19. doi: 10.1006/jmbi.1996.0707. [DOI] [PubMed] [Google Scholar]
- 37.Bai L., Shundrovsky A., Wang M.D. Sequence-dependent kinetic model for transcription elongation by RNA polymerase. J. Mol. Biol. 2004;344:335–349. doi: 10.1016/j.jmb.2004.08.107. [DOI] [PubMed] [Google Scholar]
- 38.Wang H.-Y., Elston T., Oster G. Force generation in RNA polymerase. Biophys. J. 1998;74:1186–1202. doi: 10.1016/S0006-3495(98)77834-8. [DOI] [PMC free article] [PubMed] [Google Scholar]
- 39.Yin H., Wang M.D., Gelles J. Transcription against an applied force. Science. 1995;270:1653–1657. doi: 10.1126/science.270.5242.1653. [DOI] [PubMed] [Google Scholar]
- 40.Ujvári A., Pal M., Luse D.S. RNA polymerase II transcription complexes may become arrested if the nascent RNA is shortened to less than 50 nucleotides. J. Biol. Chem. 2002;277:32527–32537. doi: 10.1074/jbc.M201145200. [DOI] [PubMed] [Google Scholar]
- 41.Flamm C., Hofacker I.L. Beyond energy minimization: approaches to the kinetic folding of RNA. Monatsh. F. Chem. 2008;139:447–457. [Google Scholar]
- 42.Mahen E.M., Watson P.Y., Fedor M.J. mRNA secondary structures fold sequentially but exchange rapidly in vivo. PLoS Biol. 2010;8:e1000307. doi: 10.1371/journal.pbio.1000307. [DOI] [PMC free article] [PubMed] [Google Scholar]
- 43.Klopper A.V., Bois J.S., Grill S.W. Influence of secondary structure on recovery from pauses during early stages of RNA transcription. Phys. Rev. E Stat. Nonlin. Soft Matter Phys. 2010;81:030904. doi: 10.1103/PhysRevE.81.030904. [DOI] [PubMed] [Google Scholar]
- 44.Temiakov D., Zenkin N., Vassylyev D.G. Structural basis of transcription inhibition by antibiotic streptolydigin. Mol. Cell. 2005;19:655–666. doi: 10.1016/j.molcel.2005.07.020. [DOI] [PubMed] [Google Scholar]
- 45.Westover K.D., Bushnell D.A., Kornberg R.D. Structural basis of transcription: nucleotide selection by rotation in the RNA polymerase II active center. Cell. 2004;119:481–489. doi: 10.1016/j.cell.2004.10.016. [DOI] [PubMed] [Google Scholar]
- 46.Toulokhonov I., Zhang J., Landick R. A central role of the RNA polymerase trigger loop in active-site rearrangement during transcriptional pausing. Mol. Cell. 2007;27:406–419. doi: 10.1016/j.molcel.2007.06.008. [DOI] [PubMed] [Google Scholar]
- 47.Kireeva M.L., Kashlev M. Mechanism of sequence-specific pausing of bacterial RNA polymerase. Proc. Natl. Acad. Sci. USA. 2009;106:8900–8905. doi: 10.1073/pnas.0900407106. [DOI] [PMC free article] [PubMed] [Google Scholar]
- 48.Erie D.A. The many conformational states of RNA polymerase elongation complexes and their roles in the regulation of transcription. Biochim. Biophys. Acta. 2002;1577:224–239. doi: 10.1016/s0167-4781(02)00454-2. [DOI] [PubMed] [Google Scholar]
- 49.Holmes S.F., Erie D.A. Downstream DNA sequence effects on transcription elongation. Allosteric binding of nucleoside triphosphates facilitates translocation via a ratchet motion. J. Biol. Chem. 2003;278:35597–35608. doi: 10.1074/jbc.M304496200. [DOI] [PubMed] [Google Scholar]
- 50.Foster J.E., Holmes S.F., Erie D.A. Allosteric binding of nucleoside triphosphates to RNA polymerase regulates transcription elongation. Cell. 2001;106:243–252. doi: 10.1016/s0092-8674(01)00420-2. [DOI] [PubMed] [Google Scholar]
- 51.Artsimovitch I., Landick R. Pausing by bacterial RNA polymerase is mediated by mechanistically distinct classes of signals. Proc. Natl. Acad. Sci. USA. 2000;97:7090–7095. doi: 10.1073/pnas.97.13.7090. [DOI] [PMC free article] [PubMed] [Google Scholar]
- 52.Palangat M., Landick R. Roles of RNA:DNA hybrid stability, RNA structure, and active site conformation in pausing by human RNA polymerase II. J. Mol. Biol. 2001;311:265–282. doi: 10.1006/jmbi.2001.4842. [DOI] [PubMed] [Google Scholar]
- 53.Depken M., Galburt E.A., Grill S.W. The origin of short transcriptional pauses. Biophys. J. 2009;96:2189–2193. doi: 10.1016/j.bpj.2008.12.3918. [DOI] [PMC free article] [PubMed] [Google Scholar]
Associated Data
This section collects any data citations, data availability statements, or supplementary materials included in this article.