

Abstract
The ability of neurons to process synaptic inputs depends critically on their passive electrical properties. The intracellular resistivity, Ri, is one of the parameters that determine passive properties, yet few experiments have explored how changes in Ri might affect synaptic integration. In this work, I addressed this issue by using targeted dendritic occlusion to locally increase Ri in cerebellar Purkinje cells and examining the consequences of this manipulation for the summation of synaptic inputs. To achieve dendritic occlusion, I used two glass micropipettes to gently pinch the dendritic trunk close to the soma. This pinching produced stereotypical changes in the responses to test pulses applied at the soma under voltage and current clamp. A simple model confirmed that these changes were due to increases in Ri in the dendritic trunk. These localized increases in Ri produced striking alterations in the shapes of postsynaptic potentials at the soma, increasing their amplitude and accelerating their decay kinetics. As a consequence, dendritic occlusion sharpened temporal precision during the summation of synaptic inputs. These findings highlight the importance of local changes in intracellular resistivity for the passive electrical properties of neurons, with implications for their ability to process synaptic information.
Introduction
Many neurons are equipped with an elaborate dendritic tree and a variety of membrane ion channels that enable them to operate as complex information-processing devices. Despite this complexity, however, the computational power of neurons is built on a relatively simple foundation, namely, the passive (or cable) properties of their dendritic arbors (1,2). These cable properties depend on neuronal morphology and three intrinsic electrical parameters: specific membrane resistance (Rm), specific membrane capacitance (Cm), and intracellular resistivity (Ri) (3,4). Rm, which is determined by the steady-state conductance of ion channels in the membrane, has been intensively studied and can be plastic and nonuniform (5–7). Cm, which is mainly defined by the intrinsic properties of the bilayer, has attracted less attention but is generally thought to be constant (0.9–1 μFcm−2) (8). Finally, Ri, which is determined by the resistance of the cytoplasm, is notoriously difficult to measure, leading to highly variable estimates (7,9,10). Little work has been done on the physiological determinants of Ri, and the functional consequences of alterations in Ri have rarely been explored experimentally in neurons (7,11).
There is some indication that alterations in Ri can occur under physiological conditions. Activity-dependent changes in diffusional access to dendritic spines have been reported, leading to the suggestion that the resistance of the spine neck may change because of rearrangement of the cytoskeleton or the movement of organelles into the neck (12). The movement of mitochondria in dendrites has also been reported to depend on neuronal activity (13). These examples raise the possibility that neuronal processes can be partially occluded by intracellular organelles or structural alterations, producing a localized change in Ri in vivo.
In this work I introduce a model system for studying the effect of alterations in Ri on the integrative properties of neurons. By using glass micropipettes to locally apply pressure to the dendritic trunk of Purkinje cells, I show that modest increases in Ri can have major effects on synaptic integration. Although this particular manipulation is unlikely to have a direct physiological correlate, the results do offer a proof of principle, and highlight the notion that other mechanisms that lead to changes in Ri could have significant consequences for neuronal function.
Materials and Methods
Slice preparation
Wistar rats of either sex (17–25 days old) were obtained from the Animal Breeding Establishment of the Australian National University. The animals were anesthetized with 2% isoflurane in oxygen and rapidly decapitated according to the guidelines of the Australian National University Animal Experimentation Ethics Committee. Standard methods were used to prepare parasagittal slices (300 μm thick) from the cerebellar vermis (14).
Electrophysiology
For recordings, slices were maintained at 32–34°C in a continuous flow of carbogen-bubbled artificial cerebrospinal fluid containing (mM) 125 NaCl, 3 KCl, 2 CaCl2, 1 MgCl2, 25 NaHCO3, 1.25 NaH2PO4, and 25 glucose. In most experiments, this solution also contained 5 μM 6,7-dinitroquinoxaline-2,3-dione, and 5 μM bicuculline methochloride to block glutamatergic and GABAergic synaptic transmission, respectively, plus 20 μM ZD7288 to block the hyperpolarization-activated cation current (Ih). ZD7288 was not present in the experiments illustrated in Figs. 4 A and 5. In some control experiments, the external solution also included 200 μM CdCl2 and 200 μM NiCl2 to block voltage-gated Ca2+ currents, plus 1 μM tetrodotoxin to block voltage-gated Na+ currents. The internal solution usually contained (mM) 130 K-methylsulfate, 7 KCl, 1 EGTA, 2 Na2ATP, 2 MgATP, 0.5 Na2GTP, and 10 HEPES (pH 7.2), plus 50 μM Alexa Fluor 488 hydrazide (Molecular Probes/Invitrogen, Eugene, OR) to enable visual confirmation of pinching or dendrotomy at the end of the experiment. In experiments in which spontaneous inhibitory postsynaptic potentials (IPSPs) were measured (see Fig. 4 B), bicuculline was omitted from the external solution and 135 KCl replaced 130 K-methylsulfate in the internal solution. Blockers were obtained from Sigma-Aldrich (St. Louis, MO) or Tocris (Bristol, UK). All other chemicals were obtained from Sigma-Aldrich.
Figure 4.
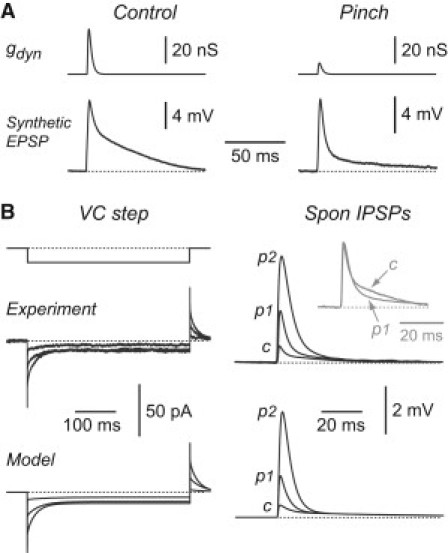
Dendritic occlusion substantially alters the shape of synaptic potentials in Purkinje cells. (A) Voltage responses of a Purkinje cell under control conditions (left) and after partial dendritic occlusion (right). A dynamic clamp was used to inject a transient excitatory synaptic conductance at the soma (gdyn, top), producing a synthetic EPSP (bottom). The peak synaptic conductance was adjusted to give a similar amount of depolarization before and after pinching (control: 33.6 nS; pinch: 8.4 nS). (B) Comparison of voltage-clamp responses (left panels) and spontaneous IPSPs (Spon IPSPs; right panels) in a real cell (top panels) and in a morphologically realistic model cell (bottom panels) in control (c) and after two stages of pinching (p1 and p2). Top left: Superimposed responses to a −1 mV voltage-clamp step in the real cell. The axial dendritic resistance, Rpin, was obtained from fits for this cell as described in Fig. 2: control (Rpin = 7.9 MΩ), pinch 1 (Rpin = 26.2 MΩ), and pinch 2 (Rpin = 122.6 MΩ). Top right: Superimposed averaged spontaneous IPSPs recorded under current clamp in the same cell at the same stages of pinching. Each trace is an average of 50 episodes. Inset (gray) shows the control and pinch 1 traces normalized at their peak to show the presence of a slower component of decay in the control situation. Bottom: Simulations of the experiments in B (top) using the Purkinje cell model from Fig. 3. The simulations used the values of Rpin mentioned above, but otherwise there were no free parameters.
Figure 5.
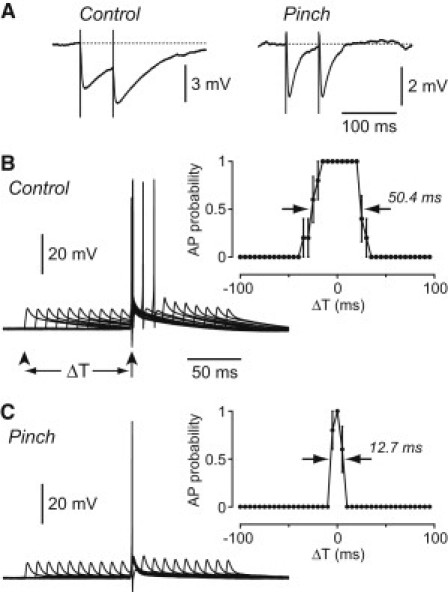
By accelerating the decay time course of synaptic potentials, dendritic occlusion narrows the duration of the window for synaptic integration. (A) Electrically evoked IPSPs measured in a Purkinje cell before (left) and after (right) pinching. The stimulating electrode was placed near the Purkinje cell layer to stimulate soma-targeting basket cell afferents, and stimulus strength was reduced after pinching to elicit IPSPs of similar amplitude to those measured before pinching. The interstimulus interval was 60 ms. Synaptic temporal summation is reduced after pinching. (B) Left: Superimposed voltage traces recorded from a Purkinje cell under control conditions while using a dynamic clamp to inject pairs of constant-amplitude excitatory conductances that were just subthreshold for eliciting an AP when applied individually (peak 33.6 nS; same cell as in Fig. 4A). One conductance occurred at a fixed time (arrowed), and the other occurred at a range of different time intervals before and after (e.g., arrowhead; ΔT = −100 ms for this example). The resultant excitatory potentials summed and became suprathreshold for eliciting an AP when ΔT was sufficiently small. Right: Probability of firing an AP versus ΔT for the same cell (width at half-maximum, 50.4 ms). (C) The same experiment repeated in the same cell after pinching the dendritic trunk (peak of injected conductance is now 8.4 nS). The width at half-maximum of the plot of AP probability versus ΔT (right) is reduced to 12.7 ms.
The recording electrodes had resistances of 3–4 MΩ when filled with internal solution. The pincer pipettes, which were used unfilled, had a shallow taper and a very fine tip. The pincers were positioned and manipulated as described previously (14) (also see Results section). Infrared videomicroscopy on an Olympus BX50WI microscope (Olympus Australia, Melbourne, Australia) with a Spot RT camera (Diagnostic Instruments, Sterling Heights, MI) was used to obtain whole-cell recordings from the somata of visually identified Purkinje neurons. Data were acquired with a Multiclamp 700A amplifier (Molecular Devices, Sunnyvale, CA). In current-clamp recordings, the neurons were hyperpolarized to ∼−70 mV by steady current injection to prevent spontaneous spiking. Bridge balance and capacitance neutralization were carefully adjusted and regularly checked for stability. The voltage-clamp holding potential was −70 mV. Voltage-clamp test steps (−1 mV, duration 400 ms) and current-clamp impulse steps (±1 nA or ±0.5 nA, duration 1 ms) were delivered at 1 Hz. Extracellular synaptic stimulation (see Fig. 5 A) was achieved with the use of a custom-built isolated stimulator that delivered a 100-μs-long constant current pulse with an adjustable amplitude. The concentric bipolar stimulating electrode was constructed from a patch electrode (tip diameter ∼5 μm) filled with 1 M NaCl and coated with silver paint (15). Voltage and current traces were filtered at 10 kHz and digitized at 20 or 50 kHz by an ITC-18 interface (Instrutech/HEKA; SDR, Sydney, Australia) under the control of Axograph X (Axograph Scientific, Sydney, Australia) or Igor Pro (Wavemetrics, Lake Oswego, OR).
The dynamic clamp was implemented with the use of a custom procedure written in Igor Pro, with an XOP (external operation file) for the ITC-18 interface (Instrutech/HEKA) to enable high-speed performance. The synaptic conductance was described by
| (1) |
where g0 is a scale factor; τr and τd are the time constants for the rising and falling phases, respectively; and m is a power factor that produces an inflected rise. These parameters were given the following values, estimated from curve fits to spontaneous excitatory postsynaptic currents: τr = 1 ms, τd = 2 ms, m = 2. The scale factor, g0, was chosen to give the peak conductance stated in the Results. For the experiments shown in Fig. 5, B and C, g0 was adjusted so that the resultant depolarization would be just subthreshold for eliciting an action potential (AP) when the conductance was applied in isolation. The reversal potential used in the dynamic clamp was fixed at 0 mV.
Analysis
The data were analyzed with the use of Axograph X. Voltage-clamp step responses and current-clamp impulse responses were averages of 100 episodes. Capacitance neutralization transient artifacts were removed by interpolation. Current-clamp responses to positive- and negative-going current steps (0.5 or 1 nA) were compared to check for linearity and confirm that no active conductances were present. Current-clamp responses to 0.5 nA were scaled up twofold to correspond to a 1 nA current step.
For each cell, the raw current and voltage traces recorded in each pinch condition were simultaneously fitted to the two-compartment model in Fig. 2 A. This model has six parameters: Rsom and Csom (resistance and capacitance, respectively, of the soma and perisomatic membrane), Rden and Cden (resistance and capacitance, respectively, of the lumped dendritic membrane), and Rel (electrode resistance) and Rpin (resistance connecting the somatic and dendritic compartments, varied by pinching). Rel was fixed at the value that had been found experimentally, by adjusting the bridge balance under each pinch condition. The fit used a Simplex algorithm to vary the remaining five free parameters to minimize the total error: . Here, Err (Im) is the sum of squared differences between the simulated membrane current and the membrane current measured experimentally under voltage clamp (fit window, 600 ms), after normalizing both traces to the peak experimental current. Err (Vm) was calculated in a similar way for the membrane potential recorded under current clamp (fit window, 400 ms). Note that normalization is required because Im and Vm have very different units (pA and mV, respectively), and thus both errors must be converted to unitless quantities before they can be summed to produce a global error. Because the simulated and experimental traces are normalized to the experimental trace (which remains fixed during the search for the optimal fit under each pinch condition), this manipulation should not distort the results.
Figure 2.
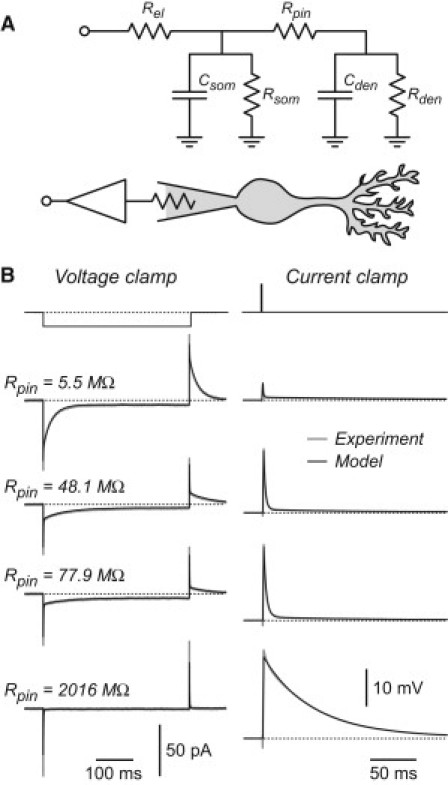
The passive electrical changes after occlusion and dendrotomy are well described by a simple two-compartment circuit. (A) Simplified circuit (top) and cartoon of the corresponding biological configuration (bottom). Rel is the resistance of the recording electrode; Csom and Rsom are the membrane capacitance and resistance of the soma, respectively; Rpin is the axial resistance of the dendritic trunk; and Cden and Rden are the lumped membrane capacitance and resistance of the dendritic tree. (B) Experimental data from Fig. 1B (gray traces) and the calculated responses of the two-compartment circuit for the same cell (black traces) for voltage-clamp (left column) and current-clamp (right column) recordings, corresponding to the fitted values of Rpin shown at left. For both the experimental and calculated current-clamp traces, the voltage drop across the electrode resistance, Rel, has been subtracted (bridge balance).
I examined the reliability of the fit procedure using simulated data. First, I calculated the simulated Im and Vm traces from the two-compartment model using values for the six parameters that were similar to those found experimentally (Rsom = 1 GΩ, Csom = 50 pF, Rden = 200 MΩ, Cden = 1000 pF, Rel = 20 MΩ, Rpin = 5–1000 MΩ). Simulated random noise, similar to that measured experimentally, was added to each trace. I then ran the fit procedure on 100 pairs of simulated traces, randomly varying both the noise and the starting guesses for the five free parameters, and used the mean and standard deviation (SD) of the 100 fitted values for each free parameter to calculate the fitting error for each parameter, expressed as a percent coefficient of variation (%CV = 100 × SD/mean). This analysis showed that the errors varied with the size of Rpin, but Rpin and Csom could most reliably be recovered (error in Rpin: 0.4–17% for Rpin = 5–1000 MΩ; error in Csom: <1% for all Rpin). In contrast, the errors in the other three parameters were generally larger (error in Rsom: ∼40% for all Rpin; error in Rden: 14–40% for Rpin = 5–1000 MΩ; error in Cden: ∼1–37% for Rpin = 5–1000 MΩ).
An alternative estimate of Rpin was obtained from the equation
| (2) |
where τf is the time constant of the fast component of decay of Vm after a current impulse (4). I estimated τf by fitting a sum of two exponentials to the falling phase of Vm and noting the faster of the two time constants, and Csom by integrating (over a 10 ms window) the capacitance transient produced by a 1 mV voltage-clamp step after dendrotomy (e.g., Fig. 1 B, inset, bottom left). This yielded the somatic charge, Qsom, from which Csom = Qsom/1 mV.
Figure 1.
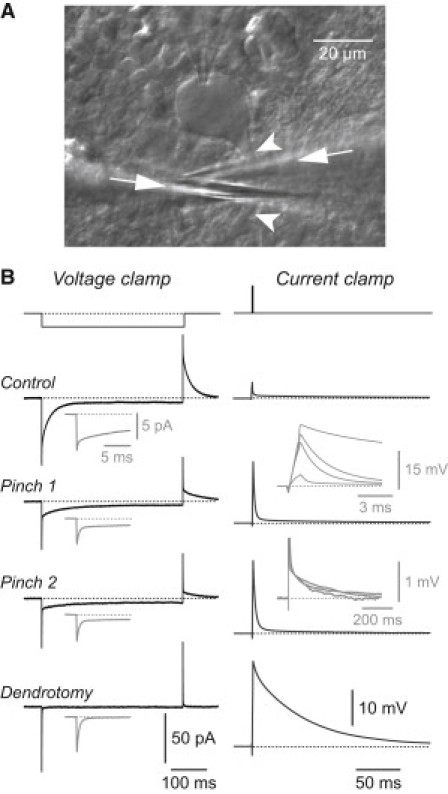
Dendritic occlusion and dendrotomy produce characteristic changes in the passive electrical responses of a Purkinje cell. (A) Image of a Purkinje cell in a cerebellar slice from an 18-day-old Wistar rat. A whole-cell patch electrode, entering from the top, is visible contacting the soma. Two pincer pipettes (arrows) are positioned below (left pipette) and above (right pipette) the dendritic trunk (arrowheads) before pinching. (B) Left: Voltage-clamp recordings from a Purkinje cell in response to a −1 mV step (top) applied under control conditions (Control), after two stages of increasing pinch (pinch 1 and pinch 2), and after complete amputation of the dendrite (Dendrotomy). Insets (gray) show the initial transient on an expanded timescale. Each trace is an average of 100 episodes. Right: Current-clamp recordings from the same cell at the same time points, showing the responses to a 1-ms-long 1 nA current pulse (top). Brief spikes due to capacitance neutralization have been removed by interpolation. Insets (gray) show the superimposed voltage transients expanded horizontally (upper) and vertically (lower). With increasing pinch, the initial fast component grows in amplitude and decays more slowly, whereas the slow component is little affected.
Spontaneous IPSPs were captured with the use of the template-based event detection algorithm in Axograph X, aligned at onset, and then averaged to yield traces as shown in Fig. 4 B.
Averaged results are given as the mean ± SE, with n equal to the number of cells. Statistical comparisons used the t-test.
Neuronal modeling
The simulations in Figs. 3 and 4 used the morphologically realistic compartmental model of the Purkinje cell illustrated in Fig. 3 A (cell 4 from (16), from a 21-day-old Wistar rat). The model used the passive parameters Rm = 120.2 kΩcm2, Ri = 141.9 Ωcm, Cm = 0.64 μFcm−2, which were obtained from a detailed passive cable analysis of this cell (16). The model included the average electrode series resistance measured in experiments reported here under control conditions (17.9 ± 1.1 MΩ, n = 7). For the simulated current clamp, the voltage drop across the electrode resistance was subtracted. Pinching was simulated by inserting an additional resistance R into the dendritic trunk close to the soma, where R = Rpin,p − Rpin,c, using the values of Rpin found from the fits to the two-compartment model under pinch and control conditions, respectively. Spontaneous IPSPs (Fig. 4 B) were simulated by inserting at the model soma a conductance change described by Eq. 1, with τr = 0.3 ms, τd = 3.5 ms, m = 2, and a reversal potential of 0 mV (simulating the high intracellular Cl− concentration used in this experiment). These values were obtained from fits to averaged spontaneous inhibitory postsynaptic currents recorded in experiments (n = 6 cells). Simulations were done with the use of NEURON (http://www.neuron.yale.edu/).
Figure 3.
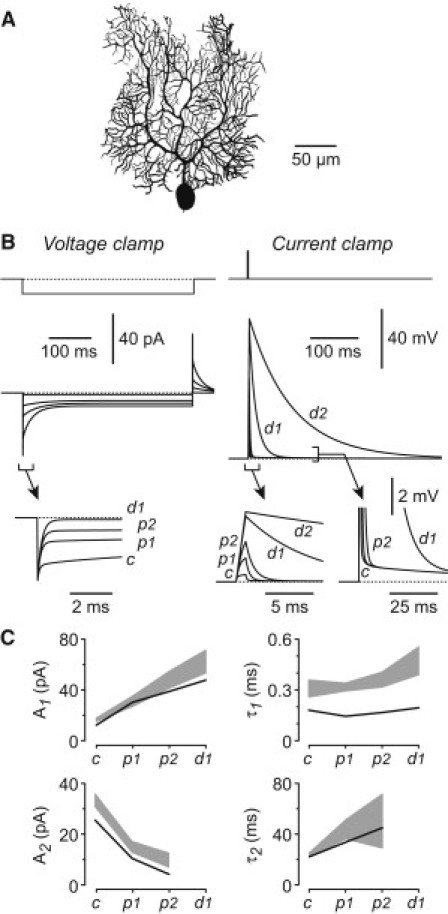
The electrical effects of occlusion and dendrotomy are reproduced by a morphologically realistic passive compartmental model of a Purkinje cell. (A) Reconstruction of the Purkinje cell (from a 21-day-old Wistar rat (16)) that was used in the simulations. (B) Simulated voltage-clamp (left) and current-clamp (right) responses to the steps shown at the top. The regions designated by square brackets are shown expanded in the insets. Each panel superimposes the simulated responses under control conditions (c), after two stages of pinching (p1 and p2), and after dendrotomy (d1), using the mean values of Rpin obtained from experiments. Also shown (d2) are the simulated traces obtained by setting Rpin = 104 MΩ. For the current-clamp simulations, the voltage drop across the electrode resistance has been subtracted. (C) Comparison of parameters obtained from double-exponential fits to transient currents obtained under voltage clamp (as in panel B, left) for both the model (black line) and experimental traces (gray band) at different stages of the experiment (c, p1, p2, and d1). A1 and τ1 are the amplitude and decay time constant, respectively, of the fast component of the fitted sum of two exponentials; and A2 and τ2 are the corresponding parameters for the slow component. The thickness of the band represents the mean experimental value ± 1 SE (n = 3–7 cells). The model broadly replicates the changes seen in experiments.
Results
Occlusion and amputation of the dendritic tree produces characteristic changes in the passive electrical responses of Purkinje cells
The aim of this study was to use Purkinje cells as a model system in which to explore the electrical consequences of local changes in intracellular resistivity, Ri. This was done by partially occluding the dendrite at a single point on the dendritic trunk of a Purkinje cell close to the soma. Because Purkinje cells have an unusually large dendritic tree, the effects of dendritic occlusion are expected to be exaggerated and easier to measure in this cell type (14,17). The experiments described in this section were done in the presence of synaptic blockers and an inhibitor of Ih, and used small stimuli that were subthreshold for activating other voltage-dependent conductances. Some experiments also used blockers of voltage-gated Ca2+ and Na+ currents, with the same result. Hence, the experiments focused on the passive electrical properties of these neurons.
Targeted occlusion was achieved with the use of two pincer pipettes (one placed just above and one placed just below the dendritic trunk <30 μm from the soma; Fig. 1 A). In this process, as the lower, distal pipette (entering from the left, Fig. 1 A) is gently lifted, the dendrite is increasingly stretched and compressed against the pipettes, increasing the dendritic lumenal resistance. (In Fig. 1 B, pinch 1 and pinch 2 represent two different stages of lifting.) With further lifting, the dendrite eventually separates and reseals across the sectioned end, leaving an isolated soma and apical stump (dendrotomy, Fig. 1 B, bottom). This process was monitored electrically at the soma by application of a 400-ms-long hyperpolarizing step in voltage-clamp mode (Fig. 1 B, left) or a 1-ms-long current pulse in current-clamp mode (Fig. 1 B, right). The electrode access resistance, which was periodically checked using the bridge balance in current clamp, remained constant (varied from 17.9 ± 1.1 MΩ in control, n = 7, to 18.8 ± 2.4 MΩ after dendrotomy, n = 4).
In voltage-clamp mode, pinching decreased the amplitude and increased the decay time constant of the slow component of current relaxation during the voltage step (Fig. 1 B, left; the initial transient is shown expanded in insets). In current-clamp mode, pinching increased the amplitude and decay time constant of the fast component of voltage relaxation after the current pulse, but had no effect on the slow component (Fig. 1 B, right; the upper inset shows (expanded horizontally) the initial transients, and the lower inset shows (expanded vertically) the superimposed slow components for control, pinch 1, and pinch 2). When dendrotomy was achieved, the slow component disappeared in voltage-clamp mode (Fig. 1 B, bottom left) and became very prominent in current-clamp mode (Fig. 1 B, bottom right).
The effect of occlusion and dendrotomy can be described by a simple circuit
How might the electrical changes observed in Fig. 1 B be interpreted? Intuitively, in voltage-clamp mode the peak amplitude of the initial current transient is largely determined by the electrode resistance (which is unaffected by pinching), whereas the slow component is due to current flow through the pinch resistance into the dendrites (which varies as the pinch resistance changes). In current-clamp mode, the fast component of voltage relaxation reflects redistribution of charge via the pinch resistance into the dendrites (which varies with pinching), whereas the decay time constant of the slow component reflects the membrane time constant of the cell (invariant).
To better understand these changes, and also to obtain estimates of the pinch resistance, I fit the data to a simple two-compartment model (Fig. 2 A) in which the soma and dendritic tree are each represented as a parallel circuit comprising a lumped resistance (Rsom or Rden) and a lumped capacitance (Csom or Cden). The two compartments are interconnected by a purely resistive dendritic trunk, the resistance of which can be altered by pinching (Rpin). The patch electrode resistance is also included (Rel). For each pinch condition in each cell, I simultaneously fit the voltage and current traces to the two-compartment model by varying five free parameters (Rsom, Rden, Csom, Cden, and Rpin). Rel was fixed at the experimentally measured value (Materials and Methods).
An example of this fit is shown in Fig. 2 B. The gray traces are the experimental data from Fig. 1 B. The black traces show the optimal fits, with the values of Rpin shown. The fits are good, and Rpin increases as expected as the pinching proceeds. Fits to a number of experiments of this type gave the following mean values for Rpin: 7.6 ± 1.0 MΩ (control, n = 7), 33.1 ± 6.1 MΩ (pinch 1, n = 6), 76.5 ± 24.2 MΩ (pinch 2, n = 3), and 715.4 ± 434.9 MΩ (dendrotomy, n = 4). Tests with simulated data confirmed that Rpin could reliably be recovered from noisy traces when Rpin was smaller, but errors were larger when Rpin was large (i.e., after dendrotomy; see Materials and Methods).
If dendritic occlusion only alters Rpin, the other free parameters in the fits should remain constant. However, these parameters did vary somewhat; for example, mean Rsom varied from 559 ± 114 MΩ (control) to 1365 ± 93 MΩ (pinch 2), and Rden varied from 225 ± 32 MΩ (control) to 132 ± 20 MΩ (pinch 2). The simulations indicated that the fitted parameters differed in their sensitivity to error, which may account for some of their apparent change with pinching (see Materials and Methods). Averaging each fit parameter over all occlusion conditions (excluding dendrotomy for the dendritic parameters) gave the following averages: Rsom, 1224 ± 186 MΩ; Csom, 57 ± 6 pF; Rden, 203 ± 25 MΩ; and Cden, 951 ± 52 pF (n = 3–7 cells).
Given the uncertainties in the above fitting procedure, I chose to use an independent method to check the estimates of Rpin. The time constant of the fast component of decay of Vm after a current impulse, τf, is approximately equal to the product of Rpin and Csom (Eq. 2) (4). τf was obtained by curve-fitting to the control, pinch 1, and pinch 2 voltage traces (see Materials and Methods; τf could not be reliably distinguished for the dendrotomy traces). I obtained an estimate of Csom by integrating the area under the membrane current transient recorded in voltage-clamp mode after dendrotomy. This gave the charge deposited on the somatic membrane, from which Csom could be calculated (see Materials and Methods; mean value 37.2 ± 2.4 pF, n = 4). Finally, Rpin was found from Eq. 2, yielding the following mean values: 11.6 ± 1.3 MΩ (control, n = 4), 26.3 ± 5.2 MΩ (pinch 1, n = 4), and 46.6 ± 14.3 MΩ (pinch 2, n = 3). These estimates of Rpin are not significantly different from those found from fits to the two-compartment model (p > 0.05).
Therefore, pinching reliably increases the coupling resistance between the somatic and dendritic compartments, in a manner equivalent to increasing the intracellular resistivity, Ri, in a short length of proximal dendrite.
A morphologically realistic model of the Purkinje cell also predicts the effect of occlusion and dendrotomy
Although the two-compartment model fits the data well and provides simple intuitive insights, it may not capture all aspects of the real cell. Accordingly, I performed further simulations using a morphologically realistic Purkinje neuron (Fig. 3 A) with previously determined passive properties (16). I simulated dendritic occlusion by inserting a resistive compartment in the dendritic trunk close to the soma. This resistance was set to zero for control, 25.5 MΩ for pinch 1, 68.9 MΩ for pinch 2, and 707.8 MΩ for dendrotomy (numbers obtained from the average values of Rpin from fits to the two-compartment model; see Materials and Methods). Occlusion and dendrotomy of this model cell yielded simulated voltage-clamp and current-clamp traces that qualitatively resembled the experimental records (cf. Figs. 1 B and 3 B). However, there was a discrepancy between the dendrotomy current-clamp trace recorded in experiments (Fig. 1 B, bottom right) and the simulated trace obtained using the average dendrotomy resistance found from fits of the two-compartment model to experiments (707.8 MΩ; Fig. 3 B, right, traces labeled d1), in that the latter decayed more rapidly. This is explained if the two-compartment model fits provide an underestimate of Rpin after dendrotomy (Fig. 2). The simulated current-clamp trace only resembled the experimental trace when the occlusion resistance in the simulation was made much larger (104 MΩ, Fig. 3 B, right, traces labeled d2). This is consistent with the earlier observation that the parameter values obtained from fits to the two-compartment model (Fig. 2 A) became less reliable as Rpin increased (Materials and Methods).
I performed a quantitative comparison between the realistic Purkinje cell model and the experiments by fitting a sum of two exponentials to the model traces and the experimental traces for each cell in the data set. The fitted amplitudes and time constants for the voltage-clamp current traces are compared in Fig. 3 C for each stage of the experiment. Fits to the realistic model are shown as the black line, and mean fits to experiments are shown as gray bands, where the thickness of the band represents the mean ± SE. (The parameters describing the slower component, A2 and τ2, are excluded from this comparison for the dendrotomy condition because of the errors mentioned in the previous paragraph.) There are some systematic differences between the model and experiments; for example, the fast decay time constant, τ1, for the model is consistently smaller than the range measured in the experiments. I might have been able to find better agreement if I had reconstructed each cell in the data set and fully analyzed it for its passive properties. Broadly speaking, however, the main features of the experimental traces were captured by the realistic Purkinje cell model (e.g., the amplitude of the fast component of the current transient, A1, increases with pinching, whereas the amplitude of the slow component, A2, decreases). Similar results were obtained for the current-clamp fits (not illustrated).
These results show that the morphologically realistic model cell in Fig. 3 A, when subjected to dendritic occlusion and dendrotomy, broadly predicts the observed changes in electrical recordings. Hence, this model cell was used in the simulations of synaptic responses described below.
Dendritic occlusion produces predictable changes in synaptic potentials
Next, I examined the effects of changes in Rpin on the synaptic inputs. I generated synthetic synaptic conductances using a dynamic clamp to inject at the Purkinje cell soma a conductance change modeled on the measured kinetics of spontaneous excitatory postsynaptic currents (Fig. 4 A, top traces; see Materials and Methods for the parameters). The amplitude of the injected conductance was adjusted so that the resultant depolarization (Fig. 4 A) would be subthreshold for eliciting an AP.
Occlusion had two major effects on synthetic excitatory postsynaptic potentials (EPSPs) in Purkinje cells (Fig. 4 A). First, it dramatically increased the amplitude of the fast component of the EPSP relative to the slow component (Fig. 4 A). This is similar to the response to a current impulse described above (Fig. 1 B, right). Because the two components were not always as clearly discernible as in the example in Fig. 4 A, I quantitated the change in kinetics by measuring the width at half the peak amplitude of the EPSP. This analysis confirmed that the EPSP halfwidth was substantially reduced by pinching (38.3 ± 5.4 ms for control, 10.9 ± 1.4 ms after pinch, n = 12 cells, p < 0.01). Second, after pinching, a much smaller peak conductance could be injected to produce a synthetic EPSP with an amplitude similar to control (just-subthreshold values for eliciting an AP: 18.4 ± 1.9 nS for control, 5.1 ± 1.1 nS for pinch, n = 12, p < 0.01). Stated differently, a constant injected conductance would generate a larger voltage response after pinching (as seen earlier for a constant current impulse; Fig. 1 B, left). In summary, both the kinetic and amplitude effects of dendritic occlusion on EPSPs are a consequence of the passive properties of the Purkinje cell.
A concern with the above experiments is that synthetic EPSPs are generated when current is injected through the recording electrode. If the bridge balance is not perfectly adjusted, errors may occur due to the voltage drop across the electrode. To exclude such artifacts, I repeated the experiment by measuring spontaneous IPSPs, which do not involve the passage of current through the recording electrode. These IPSPs are likely to be of mainly somatic origin, due to inputs from basket cells (18). High chloride in the internal solution caused them to be depolarizing (Fig. 4 B, top right). Pinching had a similar effect on both the spontaneous IPSPs and synthetic EPSPs, in that the slow component became smaller relative to the fast component (inset, Fig. 4 B, top right) and the amplitude increased markedly, i.e., after pinching, a smaller synaptic conductance could produce the same depolarization as in control. Similar results were obtained in n = 6 cells. Finally, the compartment model in Fig. 3 was able to replicate these synaptic effects (Fig. 4 B, bottom).
Dendritic occlusion alters the integration window for synaptic potentials
The reduction in the amplitude of the slow component, relative to the fast component, of synthetic EPSPs (and spontaneous IPSPs) after dendritic occlusion (Fig. 4) suggests that temporal summation of synaptic inputs will be altered by dendritic occlusion. I tested this using two kinds of synaptic input: electrically evoked IPSPs (Fig. 5 A) and synthetic EPSPs generated with a dynamic clamp (Fig. 5, B and C).
IPSPs were elicited via a stimulating electrode placed in the Purkinje cell somatic layer, where it is likely to excite soma-targeting basket cell afferents (18). Stimulus strength was reduced after pinching to elicit IPSPs of similar amplitude to those measured before pinching. In similarity to the spontaneous IPSPs (Fig. 4 B), the halfwidth of evoked IPSPs recorded at the soma was significantly reduced after pinching (Fig. 5 A; control 38.8 ± 1.7 ms; pinch 13.6 ± 0.4 ms; n = 39 events, p < 0.001; similar results in n = 3 cells). As a consequence, the temporal summation of two IPSPs elicited in quick succession was reduced after pinching (Fig. 5 A).
I examined this effect of pinching on synaptic integration more systematically using synthetic somatic EPSPs. Although Purkinje cells receive most of their excitatory input onto their dendrites (19), somatic EPSPs, elicited by means of a dynamic clamp via a whole-cell electrode at the soma, provide a convenient and clear illustration of the effect of dendritic occlusion on synaptic integration. Two identical excitatory synaptic conductances were injected sequentially into the soma separated by a time interval of ΔT, where ΔT was varied in the range of ±100 ms. When applied in isolation, each conductance was just below threshold for eliciting an AP. Temporal summation of the two conductances produced a suprathreshold depolarization when ΔT was within a narrow range (Fig. 5, B and C, left). I quantitated this by plotting the probability of AP firing versus ΔT and measuring the width of the plot at half-maximum (Fig. 5 B and C, right), which gives a measure of the size of the window for synaptic integration (e.g., 50.4 ms under control conditions for the cell in Fig. 5).
This protocol was run in the same Purkinje cell before and after pinching. In addition, the amplitude of the injected conductance was reduced after pinching to ensure that the synthetic EPSP would be just below threshold for eliciting an AP when applied in isolation (e.g., 33.6 nS in control, and 8.4 nS after pinching for the cell in Fig. 5, B and C). Under these conditions, pinching reduced the integration window from 53.5 ± 5.4 ms (control) to 17.4 ± 1.6 ms (pinch; n = 4 cells, p < 0.01). Thus, after dendritic occlusion occurs, a smaller somatic excitatory input is required to elicit APs, and it does so with greater temporal precision.
Discussion
The passive electrical properties of neurons are commonly encapsulated in the three cable parameters (Rm, Cm, and Ri). Together with information about neuronal morphology, these three parameters provide a starting point for gaining an understanding of neuronal processing. In this work, I used a model system—mechanical occlusion of the dendritic trunk of cerebellar Purkinje cells—to explore the effect of localized changes in intracellular resistivity, Ri, on synaptic integration. The results show that an increase in Ri in the dendritic trunk accelerates the decay time course of synaptic potentials at the soma (Figs. 4 and 5), reducing the duration of the window over which synaptic summation occurs (Fig. 5, B and C).
These changes are readily explicable in terms of the passive properties of the Purkinje cell (2,16). During a brief current-clamp step, the membrane potential Vm depolarizes as the somatic membrane capacitance begins to be charged. After this step, the fast decay of Vm is due to the redistribution of charge from the somatic capacitance to the dendrites through the axial resistance of the proximal dendrite. The slow decay in Vm, on the other hand, is the membrane time constant (RmCm), an intrinsic property of the cell membrane. As the dendrite is pinched off, the somatic input resistance increases and helps to produce a larger initial depolarization for the same somatic current injection. However, the slow component of the decay, reflecting the intrinsic membrane time constant, remains unchanged. Therefore, as the soma and dendrites become progressively decoupled from each other because of the increasing axial resistance, the initial fast depolarization grows larger while the slow decay remains unaltered. Hence, the relative contribution of the slower component to the time course of the somatic synaptic potential is reduced. This causes the synaptic potential to decay more rapidly overall.
With further pinching, the decay of the fast component becomes slower as the resistance between the soma and dendrites, Rpin, increases (Eq. 2), until eventually the fast component merges with the slower component. This is the situation after complete dendrotomy is achieved, when Vm in the isolated soma decays with a single time constant equal to the membrane time constant. Any residual fast component of decay could be due to the axon (e.g., as observed in cerebellar granule cells (20)).
Although the experiments described here make use of a specific manipulation (i.e., mechanical occlusion causing localized increases in Ri), they serve to illustrate some important general conclusions. First, the results show the effect of changing the electrical coupling between a smaller and a larger compartment. Here, those compartments were the soma and the entire dendritic tree, respectively, but other types of unequal compartments can be envisaged. For example, a dendritic branch might be partially isolated from the rest of the dendritic tree by a local increase in Ri, leading to changes in synaptic potentials within that branch. The larger electrical load should be large enough to separate kinetically the faster and slower components of the somatic potential; however, it cannot be too large, because then the amplitude of the slow component would be reduced (4). Purkinje cells, which have a large, profusely branching dendritic tree close to the soma (17), would seem to impose an optimal electrical load on the soma for distinguishing the kinetic components described here. Other cell types, such as spinal motor neurons and neocortical pyramidal neurons, have different dendritic morphologies that could impose a smaller electrical load on the soma (10,14,21,22). Hence, the effects on somatic potentials described here would be less prominent in such cells. This does not exclude the possibility that other compartments in these cells, such as individual dendritic branches, could still experience the larger electrical load that is a feature of Purkinje cell somata.
A second general conclusion concerns the functional consequences of alterations in Ri. In this study, functional effects were illustrated by two kinds of recordings: synaptically evoked somatic IPSPs (Fig. 5 A) and synthetic EPSPs generated at the soma by a dynamic clamp (Fig. 5, B and C). In both cases, dendritic occlusion reduced the halfwidth of the synaptic potential, decreasing the temporal summation. Although synthetic EPSPs are an artificial stimulus, this particular experiment dramatically illustrates the general conclusion that changes in the synaptic time course caused by changes in Ri can affect synaptic integration, perhaps altering AP firing. Similar effects would also be expected for somatic IPSPs, which are prominent in Purkinje cells (18,23). Thus, localized alterations in Ri could alter the kinetics and temporal summation of inhibition under physiological conditions, with consequences for neuronal excitability.
What might be the functional consequences of changes in Ri that occur far from the soma (e.g., if a dendritic branch is partially isolated from the rest of the dendritic tree)? In this case, the altered Ri might have only minor direct consequences for the initiation of APs in the axon. On the other hand, changes in dendritic Ri might affect the size and duration of local depolarization or hyperpolarization in the dendrites. This could have consequences for the activation of local calcium channels or N-methyl-D-aspartate-type glutamate channels, with effects on dendritic processes such as synaptic plasticity and dendritic electrogenesis (24–26).
For convenience in these experiments, I used a mechanical method to locally increase Ri in a dendritic shaft. How might changes in Ri occur under physiological conditions? The most plausible mechanisms involve actin-dependent constriction of processes, or plugging of the lumen by the accumulation of intracellular organelles. There is evidence for both mechanisms, and both can be localized and activity-dependent (12,13). Often this occlusion occurs in dendritic spines, but redistribution of organelles in dendrites has also been reported (13). So far, there is no clear evidence for the targeting of occlusions to particular dendrites, although heterogeneity in spine occlusion has been described (12). A similar mechanism may work on a larger scale in dendrites. It is unclear how much these alterations could increase Ri. In the experiments described here, gentle stretching (pinch 1) increased axial resistance by ∼25 MΩ to produce clear effects on synaptic integration for somatic inputs. An increase of 25 MΩ could be achieved by reducing the radius of a 10 μm length of dendrite from 1 μm to ∼0.4 μm, an amount that seems feasible to achieve by partial plugging with intracellular organelles.
In summary, I have shown that a localized increase in Ri can have two consequences for the electrical response of a neuron. Perhaps the most important consequence is an increase in local input resistance, meaning that the same synaptic conductance produces a larger synaptic potential. A second, often overlooked consequence is an alteration in the kinetics of the synaptic potential, with ramifications for temporal summation. These experiments show that even a relatively simple passive structure can exhibit a variety of interesting behaviors that are potentially significant for neural processing.
Acknowledgments
I thank Arnd Roth and Nelson Spruston for helpful comments on the manuscript, and John Clements for help with programming.
This work was begun in the laboratory of Michael Häusser (University College London) with the support of a short-term travel grant from the Wellcome Trust. Subsequent funding was provided by the John Curtin School of Medical Research.
References
- 1.Magee J.C. Dendritic integration of excitatory synaptic input. Nat. Rev. Neurosci. 2000;1:181–190. doi: 10.1038/35044552. [DOI] [PubMed] [Google Scholar]
- 2.Rall W., Burke R.E., Segev I. Matching dendritic neuron models to experimental data. Physiol. Rev. 1992;72(4, Suppl):S159–S186. doi: 10.1152/physrev.1992.72.suppl_4.S159. [DOI] [PubMed] [Google Scholar]
- 3.Rall W. Core conductor theory and cable properties of neurons. In: Kandel E.R., editor. Handbook of Physiology. Section 1: The Nervous System. American Physiological Society; Bethesda, MD: 1977. pp. 39–97. [Google Scholar]
- 4.Jack J.J.B., Noble D., Tsien R.W. Clarendon Press; Oxford: 1985. Electric Current Flow in Excitable Cells. [Google Scholar]
- 5.Migliore M., Shepherd G.M. Emerging rules for the distributions of active dendritic conductances. Nat. Rev. Neurosci. 2002;3:362–370. doi: 10.1038/nrn810. [DOI] [PubMed] [Google Scholar]
- 6.Bekkers J.M. Distribution and activation of voltage-gated potassium channels in cell-attached and outside-out patches from large layer 5 cortical pyramidal neurons of the rat. J. Physiol. 2000;525:611–620. doi: 10.1111/j.1469-7793.2000.t01-2-00611.x. [DOI] [PMC free article] [PubMed] [Google Scholar]
- 7.Stuart G., Spruston N. Determinants of voltage attenuation in neocortical pyramidal neuron dendrites. J. Neurosci. 1998;18:3501–3510. doi: 10.1523/JNEUROSCI.18-10-03501.1998. [DOI] [PMC free article] [PubMed] [Google Scholar]
- 8.Gentet L.J., Stuart G.J., Clements J.D. Direct measurement of specific membrane capacitance in neurons. Biophys. J. 2000;79:314–320. doi: 10.1016/S0006-3495(00)76293-X. [DOI] [PMC free article] [PubMed] [Google Scholar]
- 9.Antic S.D. Action potentials in basal and oblique dendrites of rat neocortical pyramidal neurons. J. Physiol. 2003;550:35–50. doi: 10.1113/jphysiol.2002.033746. [DOI] [PMC free article] [PubMed] [Google Scholar]
- 10.Golding N.L., Mickus T.J., Spruston N. Factors mediating powerful voltage attenuation along CA1 pyramidal neuron dendrites. J. Physiol. 2005;568:69–82. doi: 10.1113/jphysiol.2005.086793. [DOI] [PMC free article] [PubMed] [Google Scholar]
- 11.Bekkers J.M., Stevens C.F. Two different ways evolution makes neurons larger. In: Storm-Mathison J., Zimmer J., Ottersen O.P., editors. Progress in Brain Research. Elsevier; Amsterdam: 1990. pp. 37–45. [DOI] [PubMed] [Google Scholar]
- 12.Bloodgood B.L., Sabatini B.L. Neuronal activity regulates diffusion across the neck of dendritic spines. Science. 2005;310:866–869. doi: 10.1126/science.1114816. [DOI] [PubMed] [Google Scholar]
- 13.Li Z., Okamoto K., Sheng M. The importance of dendritic mitochondria in the morphogenesis and plasticity of spines and synapses. Cell. 2004;119:873–887. doi: 10.1016/j.cell.2004.11.003. [DOI] [PubMed] [Google Scholar]
- 14.Bekkers J.M., Häusser M. Targeted dendrotomy reveals active and passive contributions of the dendritic tree to synaptic integration and neuronal output. Proc. Natl. Acad. Sci. USA. 2007;104:11447–11452. doi: 10.1073/pnas.0701586104. [DOI] [PMC free article] [PubMed] [Google Scholar]
- 15.Bekkers J.M., Clements J.D. Quantal amplitude and quantal variance of strontium-induced asynchronous EPSCs in rat dentate granule neurons. J. Physiol. 1999;516:227–248. doi: 10.1111/j.1469-7793.1999.227aa.x. [DOI] [PMC free article] [PubMed] [Google Scholar]
- 16.Roth A., Häusser M. Compartmental models of rat cerebellar Purkinje cells based on simultaneous somatic and dendritic patch-clamp recordings. J. Physiol. 2001;535:445–472. doi: 10.1111/j.1469-7793.2001.00445.x. [DOI] [PMC free article] [PubMed] [Google Scholar]
- 17.Vetter P., Roth A., Häusser M. Propagation of action potentials in dendrites depends on dendritic morphology. J. Neurophysiol. 2001;85:926–937. doi: 10.1152/jn.2001.85.2.926. [DOI] [PubMed] [Google Scholar]
- 18.Vincent P., Marty A. Fluctuations of inhibitory postsynaptic currents in Purkinje cells from rat cerebellar slices. J. Physiol. 1996;494:183–199. doi: 10.1113/jphysiol.1996.sp021484. [DOI] [PMC free article] [PubMed] [Google Scholar]
- 19.Khaliq Z.M., Raman I.M. Relative contributions of axonal and somatic Na channels to action potential initiation in cerebellar Purkinje neurons. J. Neurosci. 2006;26:1935–1944. doi: 10.1523/JNEUROSCI.4664-05.2006. [DOI] [PMC free article] [PubMed] [Google Scholar]
- 20.Mejia-Gervacio S., Collin T., Marty A. Axonal speeding: shaping synaptic potentials in small neurons by the axonal membrane compartment. Neuron. 2007;53:843–855. doi: 10.1016/j.neuron.2007.02.023. [DOI] [PubMed] [Google Scholar]
- 21.Rall W. Branching dendritic trees and motoneuron membrane resistivity. Exp. Neurol. 1959;1:491–527. doi: 10.1016/0014-4886(59)90046-9. [DOI] [PubMed] [Google Scholar]
- 22.Gulledge A.T., Kampa B.M., Stuart G.J. Synaptic integration in dendritic trees. J. Neurobiol. 2005;64:75–90. doi: 10.1002/neu.20144. [DOI] [PubMed] [Google Scholar]
- 23.Häusser M., Clark B.A. Tonic synaptic inhibition modulates neuronal output pattern and spatiotemporal synaptic integration. Neuron. 1997;19:665–678. doi: 10.1016/s0896-6273(00)80379-7. [DOI] [PubMed] [Google Scholar]
- 24.Larkum M.E., Nevian T., Schiller J. Synaptic integration in tuft dendrites of layer 5 pyramidal neurons: a new unifying principle. Science. 2009;325:756–760. doi: 10.1126/science.1171958. [DOI] [PubMed] [Google Scholar]
- 25.Larkum M.E., Kaiser K.M.M., Sakmann B. Calcium electrogenesis in distal apical dendrites of layer 5 pyramidal cells at a critical frequency of back-propagating action potentials. Proc. Natl. Acad. Sci. USA. 1999;96:14600–14604. doi: 10.1073/pnas.96.25.14600. [DOI] [PMC free article] [PubMed] [Google Scholar]
- 26.Womack M.D., Khodakhah K. Dendritic control of spontaneous bursting in cerebellar Purkinje cells. J. Neurosci. 2004;24:3511–3521. doi: 10.1523/JNEUROSCI.0290-04.2004. [DOI] [PMC free article] [PubMed] [Google Scholar]