

Abstract
One major goal of ion channel research is to delineate the molecular events from the detection of the stimuli to the movement of channel gates. For ligand-gated channels, it is challenging to separate ligand binding from channel gating. Here we studied the cyclic adenosine monophosphate (cAMP)-dependent gating in hyperpolarization-activated cAMP-regulated (HCN) channel by simultaneously recording channel opening and ligand binding, using the patch-clamp fluorometry technique with a unique fluorescent cAMP analog that fluoresces strongly in the hydrophobic binding pocket and exerts regulatory effects on HCN channels similar to those imposed by cAMP. Corresponding to voltage-dependent channel activation, we observed a robust, close-to-threefold increase in ligand binding, which was more pronounced at subsaturating ligand concentrations than higher concentrations. This observation supported the cyclic allosteric models and indicated that protein allostery can be implemented through differentiating ligand binding affinities between resting and active states. The kinetics of ligand binding largely matched channel activation. However, during channel deactivation, ligand unbinding was slower than channel closing, suggesting a delayed response to membrane potential by the ligand binding machinery. Our results provide what we believe to be new insights into the cAMP-dependent gating in HCN channel and the interpretation of protein allostery for general ligand-gated channels and receptors.
Introduction
Allosteric regulation of protein function has been a central topic in the biophysical study of proteins with diverse functions, from enzymes to ion channels (1). Two popular models have been proposed for protein allostery: the sequential induced-fit model (2) and the cyclic allosteric models such as the classical Monod-Wyman-Changeux model or the more recent preexisting equilibrium model (3,4). The sequential induced-fit model claims that the protein in the resting state does not bind to ligand, and, when ligand is present, the interactions between protein and ligand trigger a series of conformational changes that result in ligand binding to the protein in the active state. On the other hand, rooted in the theories of statistical physics and protein energy landscape (5,6), cyclic allosteric models postulate that the protein molecules in both resting and active states coexist but bind to ligands with different affinities. Ligand binding stabilizes the active state and thus shifts the equilibrium of protein conformations from resting to active state. The first postulate by the cyclic allosteric models—the coexistence of protein molecules in different conformation and functional states—has been confirmed for a number of protein enzymes (7,8) as well as several types of ion channels. For example, the spontaneous transitions between closed and open states have been reported for ionotropic acetylcholine receptors and cyclic-nucleotide-gated channels (9,10). However, the direct evidence to support the second postulate, that ligand preferably binds to and stabilizes the protein in the active state, has been largely missing. This is mainly due to the technical difficulty in specifically dissecting out ligand binding in different functional states (11).
A unique advantage of ion channel research is that the transition between closed and open states can be recorded at high temporal resolution by electrical approaches (12). Ion channels mainly respond to two types of stimuli: changes in membrane potential and ligand concentration (13,14). Like many other ion channels, the hyperpolarization-activated cyclic adenosine monophosphate (cAMP)-regulated (HCN) channel contains the machineries for both voltage- and ligand-gating (15–18). Each HCN channel subunit contains a transmembrane domain, homologous to that of voltage-gated K channels, and a cyclic-nucleotide binding domain (CNBD) in the C-terminus. Within the transmembrane domain, the fourth transmembrane α-helix (S4) contains a series of positive charges and functions as the voltage sensor (19–22). On the other hand, intracellular cAMP molecules directly bind to the CNBD and regulate channel function (23,24). Thus, dually regulated by voltage and ligand, HCN channels are ideal targets for studying protein allostery (25–28). Relying on a fluorescent cAMP analog as a marker for ligand binding, previous studies have elegantly illustrated the correlation between ligand binding and channel activity in cyclic-nucleotide-gated and HCN channels (27,29). The experimental approach was called patch-clamp fluorometry, which combines the electrical recording of channel activities and the optical recording of fluorescent signals (29–31). Evolved from the earlier voltage-clamp fluorometry technique used in the study of voltage-gated channels, patch-clamp fluorometry has provided many insights into the mechanism of ligand gating (31–33).
In this study we took advantage of a cAMP analog, 8-NBD-cAMP, which fluoresces strongly in the hydrophobic nucleotide binding pocket in HCN channels but weakly in an aqueous environment. Compared with cAMP, 8-NBD-cAMP has similar regulatory effect on HCN channels. We aimed to test the cyclic allosteric model for the ligand-gating in HCN channel and asked whether cAMP binds to the active channel with a higher affinity and thus stabilizes the channel in its active state. Moreover, we improved the optical recording setup by focusing the excitation light beam to an area just surrounding the membrane patch region near the tip of the patch-clamp pipette (34). Both measures improved the signal/noise ratio of the optical recording in our study and helped us gain further insights into the cAMP binding and regulation of HCN channels.
Materials and Methods
Purification of mouse HCN2 (mHCN2) protein and biochemical binding assays
We cloned the DNA fragment containing the C-linker and CNBD of the mHCN2 channel into pSMT3 vector and expressed it in E. coli BL21 cells. After purifying the fusion protein using Ni-affinity chromatography, we removed the His-Smt3 tag with Ulp1 protease and further purified the mHCN2 protein with ion-exchange chromatography and size-exclusion chromatography. The purified protein was concentrated to over 10 mg/mL, flash-frozen in liquid nitrogen, and stored at −80°C.
We did extensive dialysis to remove the residual cAMP molecules bound to the mHCN2 protein before biochemical analysis. We first used isothermal titration calorimetry (ITC) (iTC200 Microcalorimeter by Microcal, Piscataway, NJ) to measure the binding affinity of cAMP and 8-NBD-cAMP to purified mHCN2 proteins (35). The ITC method detects the heat exchange during the interaction between ligand and protein molecules. However, because it is not suitable for measuring weak binding such as the binding of cAMP to mutant mHCN2 protein, we also used fluorescence anisotropy to measure cAMP binding affinity to mHCN2. This assay is based on the observation that for small fluorescent molecules, there is a significant reduction in rotational diffusion upon binding to a much larger protein molecule. The rotational diffusion of fluorescent molecules can be monitored using polarized excitation light. Fluorescence anisotropy changes as the concentration of protein being titrated. We incubated different concentrations mHCN2 protein with 8-NBD-cAMP. Fluorescence anisotropy was measured with the Beacon 2000 Fluorescence polarization system (Invitrogen, Carlsbad, CA). The dissociation constants were derived by fitting the binding curve with nonlinear regression analysis using PRISM (GraphPad Software, La Jolla, CA).
Patch-clamp fluorometry
For patch-clamp recording, we expressed mHCN2 channel in Xenopus oocytes. We injected 40–50 ng of cRNA into each stage VI oocyte. Macroscopic HCN channel current was recorded with the inside-out configuration at room temperature after 2–3 days of incubation at 17°C. We used the following pipette/bath solution: KCl, 107 mM; MgCl2, 1 mM; EGTA, 1 mM; HEPES, 10 mM; pH 7.4 adjusted with KOH. In some experiments, we replaced the KCl by KAsp in the bath solution to improve patch stability. No significant differences were noticed between two solutions.
The patch-clamp fluorometry setup was based on an Olympus BX50WI microscope (Center Valley, PA). A 473-nm DPSS laser was used as the excitation light source. For optical recording, we used CoolSNAP-HQ and Cascade 1K charge-coupled device (CCD) cameras (PhotoMetrics, Tucson, AZ) to collect fluorescence images and ImageJ (http://rsbweb.nih.gov/ij/) for data analysis. Before measuring fluorescence intensity, we first used TurboReg to align the series of images. For final presentation purposes, we modified original fluorescence images with green color later in Figs. 2 and 3 and Fig. S1 in the Supporting Material. The fluorescent cAMP analogs, 8-Fluo-cAMP and 8-NBD-cAMP, were obtained from Biolog (Hayward, CA). All other chemicals were from Sigma (St. Louis, MO).
Figure 2.

Activity-dependent increase in ligand binding is inversely related to the concentrations of ligands. (A) Bright field image of the membrane patch (indicated by arrow) and fluorescence images collected before (C1), at the beginning (V0), and near the end of the voltage step (V). (B) (Top) Voltage protocol and the timing of image collections. (Bottom) Corresponding current trace. Synchronized CCD camera exposure time is shown in the middle. (C) Increase in fluorescence intensity versus duration of the voltage steps applied. (D) Increase in fluorescence intensity versus 8-NBD-cAMP concentration applied (in μM). A 3-s-long voltage step was used to activate the channel.
Figure 3.
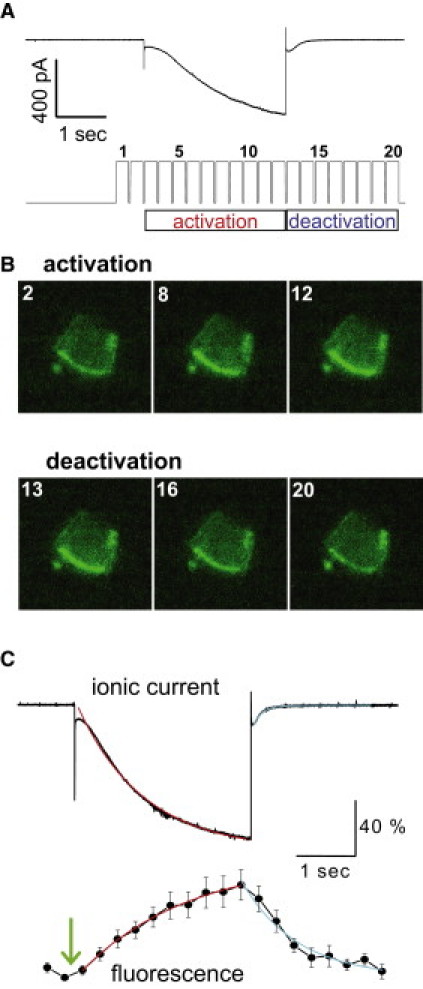
Comparing the time courses of the channel opening with dynamic ligand binding. (A) Twenty images were collected along the voltage step from −40 to −150 mV. (Top) Macroscopic current traces. (Bottom) Real-time recording of the transistor-transistor logic signal from the CCD camera exposure port showing the timing of image collection. (B) (Top) Corresponding fluorescence images collected before (#2, reference), in the middle (#8) and near the end of the 3-s hyperpolarizing voltage step (#12) to activate the channel. (Bottom) Fluorescence images collected during the channel deactivation phase (#13, #16, #20). (C) (Top) Normalized ionic current traces from different patches were averaged and fitted with a single exponential function. (Bottom) Averaged fluorescence intensities showing the time course of fluorescence intensity change.
Results
To specifically study cAMP binding to HCN channel protein, we purified mHCN2 C-terminal fragment including the CNBD and C-linker. We first used the ITC method to measure the binding affinity. Our results showed that the Kd values for cAMP and 8-NBD-cAMP were very close, 2.6 ± 0.4 and 3.7 ± 0.3 μM, respectively (Fig. 1 A). Moreover, we tested a mutant mHCN2 protein as the negative control for ligand binding, mHCN2/R591E. This positively charged residue is highly conserved across many different types of proteins and has been shown to be critical for cyclic-nucleotide binding (Fig. S1 A) (36). Using fluorescent 8-Fluo-cAMP as ligand, we determined the R591E mutation reduced the binding affinity by ∼1100 folds. To quantify the cAMP-dependent gating in HCN channels, we measured the half-maximal effective concentration, EC50 or K1/2, for cAMP to shift the voltage-dependent channel activation curve. For cAMP, the K1/2 value is well established to be ∼0.1 μM (25,37). We tested 8-NBD-cAMP on HCN channel and found that it had very similar effects on HCN channel gating, as shown by the values of K1/2 (0.10 vs. 0.13 μM) and the maximal shift in V1/2 (16.8 vs. 15.9 mV) (Fig. 1 B). Therefore, these results confirmed the effectiveness of 8-NBD-cAMP in the following study of cAMP-dependent gating in HCN channel. Moreover, we chose 8-NBD-cAMP because it fluoresces strongly in hydrophobic environments such as the nucleotide-binding pocket in HCN channel. Based on the emission spectra, we determined the ratio of the fluorescence intensity of 8-NBD-cAMP bound to HCN protein to that of free 8-NBD-cAMP in the saline buffer with the same concentration. The ratio was ∼90 (Fig. 1 C; Fig. S1 B).
Figure 1.

Comparing cAMP and 8-NBD-cAMP in the interactions with the HCN2 protein. (A) (Left) Original trace showing the heat exchange rate versus the time of cAMP injection. (Right) Binding curves showing the heat exchange versus the ratio of ligands to HCN2 protein. (B) Comparing the dose-response curves for cAMP (black, K1/2, 0.13 ± 0.04 μM) and 8-NBD-cAMP (red, K1/2, 0.10 ± 0.01 μM) in shifting the V1/2 of the functioning mHCN2 channel. (C) Excitation and emission spectra of 8-NBD-cAMP (5 μM) in complex with mHCN2 protein at different concentrations: 10 (red), 1 (green), 0.1 (blue), and 0.01 μM (magenta). Fluorescence intensity unit is in 105 a.u.
Next, we applied 8-NBD-cAMP to the intracellular side of the patch pipette and measured the fluorescence signal near the membrane patch in the recording pipette, which ought to correspond to the molecules bound to the HCN channel. With just 0.1 μM 8-NBD-cAMP applied and a holding potential of −40 mV, we observed a significant accumulation of fluorescence signal along the arc of the membrane (C1 in Fig. 2 A). To ensure that the fluorescence signal was directly correlated with 8-NBD-cAMP binding to the HCN channel on the membrane patch, we performed two negative control experiments with the mutant mHCN2-R591E channel that has a much-reduced binding affinity and uninjected oocytes (see Fig. S1, C and D). As expected, we did not observe any accumulation of fluorescence signal near the membrane patches from either of the negative controls, even though we detected robust HCN currents from mHCN2-R591E mutant channel. Next we studied whether the binding of 8-NBD-cAMP to mHCN2 channel is dependent on the channel activity. We applied a hyperpolarizing voltage step from −40 to −150 mV to activate the channel. Indeed, there was a steady increase in fluorescence intensity parallel to the channel activation (V0 and V in Fig. 2 A), which is in agreement with a recent report (27). With a longer voltage step of 8 s, the increase in cAMP binding became 169 ± 17%, corresponding to an approximately threefold increase in cAMP binding (Fig. 2, B and C). This observation further confirmed that the increase in 8-NBD-cAMP binding is in direct correlation with the extent of channel opening.
We then asked whether this activity-dependent increase in cAMP binding depends on the concentration of cAMP applied, which will help distinguish between those two models for protein allostery. The sequential induced-fit model predicts that a protein in the resting state does not bind to ligands, therefore the changes in ligand binding should not depend on ligand concentration. On the contrary, the cyclic allosteric models assume that the proteins in both resting and active states are able to bind to ligands but with different affinities. Thus, when ligand concentration is sufficiently high, proteins in the active and resting states should be saturated with ligands and thus, there should be no further increase in ligand binding. To test this, we applied different concentrations of 8-NBD-cAMP, and measured the activity-dependent increase in binding. Our results showed that when the cAMP concentration was close to or lower than the value of K1/2 (0.1 μM), we could detect a significant increase in cAMP binding. However, when cAMP concentration was above 0.5 μM, only five times higher than K1/2, the change in fluorescence intensity became much smaller and was abolished at the concentration of 3 μM (Fig. 2 D). Thus, this clear inverse relationship between cAMP concentration and the increase in activity-dependent ligand binding provided direct evidence for the cyclic allosteric models for the ligand-gating in HCN channels.
The above experiments only addressed the changes in cAMP binding in the steady state. To gain more insights into the dynamic channel opening and cAMP binding, we monitored the time course of cAMP binding to functioning HCN channels and compared it to that of channel activation/deactivation. For this purpose, we reduced the exposure time of the CCD camera from 0.5 to 0.26 s and collected a sequence of 20 images along the voltage protocol (Fig. 3, A and B). During the activation phase, we observed a close correlation between the increase in fluorescence intensity and the channel activation (Fig. 3 C). Surprisingly, during the deactivation phase, the kinetics of fluorescence intensity showed a marked slowdown compared to that of the current decrease. To further look into this discrepancy between electrical and optical recordings during channel deactivation, we applied a voltage protocol by activating the channel to −150 mV and then tested the deactivation by depolarizing voltage steps ranging from +50 to −50 mV and followed the time-course of ligand unbinding (Fig. 4, A–D). Indeed, the time constant for the decrease in fluorescence signal, which corresponds to cAMP unbinding, was approximately six times longer than that of channel deactivation (Fig. 4 E). This observation indicated that during HCN channel deactivation, channel closing responds to the depolarizing voltage steps rapidly; however, the dissociation of ligand from the binding pocket proceeds with a much slower pace in a voltage-independent manner.
Figure 4.

cAMP unbinding proceeds slower than channel closing during channel deactivation. (A) (Top) Hyperpolarizing voltage step from −40 mV to −150 mV was used to activate the channel. Channel deactivation was measured at the holding potential of +50 mV. (Dashed box) Phase of channel deactivation. (Bottom) Transistor-transistor logic output from the CCD camera exposure port showing the timing of image collection. Exposure time, 100 ms; frame rate, 6.6 frame/s. (B) Voltage protocol and current trace of channel deactivation measured at −50 mV. (C) Comparing the deactivation kinetics of tail current (I) and fluorescence signal from 0.1 μM 8-NBD-cAMP (F) (+50 mV). Each red circle represents the normalized fluorescence intensity of the corresponding image. (D) Deactivation kinetics of tail current (I) and fluorescence (F) measured at −50 mV. For comparison purpose, the fluorescence results were inverted. (E) Time constants for voltage-dependent channel deactivation (black) or ligand unbinding (red) as a function of the testing potentials during channel deactivation.
Finally, we asked whether we could perturb the ligand unbinding kinetics by simply altering the length of the proceeding hyperpolarizing voltage step during channel activation (Fig. 5 A). This experiment will further address whether the slow reduction in fluorescence intensity is more directly related to the channel activity or due to an unrelated mechanism. We adjusted the duration of the voltage steps from 0.2 to 2 s, which resulted in a clear separation of channel opening. Correspondingly, we observed an approximately twofold change in the time constant for ligand unbinding (Fig. 5 B). It was interesting to note that with shorter voltage steps and less channel activation, the ligand unbinding became significantly slower (Fig. 5 C). These results not only directly confirmed that the slow kinetic of ligand unbinding revealed by the fluorescence signal was relevant to channel function, but also revealed an intriguing relationship between the extent of channel activation and the following ligand unbinding during channel deactivation.
Figure 5.

The kinetics of ligand unbinding depends on the duration of the proceeding voltage activation step. (A) Representative current traces in response to a series of voltage steps from the holding potential of −40 mV to a hyperpolarizing −150 mV of different durations. The voltage protocol used is shown on the top. (B) The corresponding fluorescence intensity corresponding to the ligand unbinding process. The CCD camera exposure time of the 0.2 s activation step (black traces) was shown as an example (bottom). For comparison purpose, we used 100 ms exposure time and collected the data at a rate 5 frames/s for all recordings. (C) Time constants for channel deactivation (black) or ligand unbinding (red) as a function of the duration of the hyperpolarizing voltage steps.
Discussion
Through simultaneous monitoring ligand binding and channel opening, we directly showed that in HCN channel, the voltage-dependent channel opening and the increase in ligand binding are closely correlated. Moreover, our results revealed an inverse relationship between the ligand concentration and the increase in ligand binding. When cAMP concentration was low (≤0.1 μM, the value of K1/2), we detected a robust increase in the activity-dependent ligand binding. In contrast, with the ligand concentration increased by just fivefold, the change in ligand binding became less obvious, which suggested that both the closed and open states were saturated with ligands and no further increase in ligand binding could be detected. Thus, our results provided a direct support for the cyclic allosteric models and further confirmed that protein allostery can be implemented by adapting the ligand binding affinities according to the functional states of the whole protein.
Consistent with a previous study, we observed a similar kinetics in channel activation and the increase in ligand binding. However, ligand unbinding was much slower compared with the channel deactivation, which was different from previous report (27). This discrepancy could partially be related to the different cAMP analogs used by two studies. The cAMP analog used in this study carries the NBD group, which is of relatively small size and does not carry any extra electrostatic charges. Moreover, it shares similar chemical properties to the purine ring in the cAMP molecule to which it is attached. We measured the dissociation constant, Kd, by biochemical assays and the effective dissociation constant, K1/2, by electrophysiology recordings. We did not find any major differences between cAMP and this fluorescent analog. Moreover, 8-NBD-cAMP is almost nonfluorescent in saline solutions. As confirmed by two negative controls, it was not necessary to use another nonspecific dye to help define the membrane region, which improved the signal/noise ratio of the optical recording, especially at lower ligand concentrations. Taken together, the mismatch between channel closing and ligand unbinding in our study should be relevant to the HCN channel activities. Further support came from the results shown in Fig. 5, that the ligand unbinding kinetics was indeed correlated with the extent of channel activation.
What is the molecular basis for the mismatch between channel deactivation and ligand unbinding? It is highly possible that the coupling between voltage sensor and channel gate is a faster molecular process than the coupling between voltage sensor and the cAMP binding domain, which is most likely mediated by the interactions between S4-S5 linker and the C-linker region downstream from S6 (38,39). After the HCN channel gate closes, the C-linker and CNBD might still be in the process of adaptation to membrane repolarization, which results in the delay in releasing the bound ligands. Further pursuing the corresponding molecular basis should help delineate the details during cAMP-dependent gating in HCN channels. From the aspect of physiology, it is intriguing to speculate on the function of those lingering cAMP molecules still bound to the channels in the deactivation state. Those cAMP molecules could affect the channel's response to the subsequent stimulations, such as the changes in membrane potential, cAMP concentration, or other factors affecting HCN channel's function. Alternatively, it is possible that the slow cAMP unbinding directly affect the spatial and temporal profiles of the local cAMP signaling and thus exert important physiological functions. This is highly possible in the spatially restricted region where high densities of HCN channel express, e.g., in neuronal dendrites or sinus nodal cells (40–43).
Most ion channel research aims to clarify the molecular coupling between voltage and ligand stimulations to channel gating. For voltage-gated ion channels, the characterization of the gating current as well as later voltage-clamp fluorometry experiments on the movements of voltage sensors have provided many insights into the molecular events preceding the gate opening (22,44–46). Equivalently for ligand-gated ion channels, this research strategy of applying patch-clamp fluorometry using fluorescent ligands as an indicator for ligand binding is powerful in separately addressing ligand binding from ligand gating, which had been a difficult task in the study of ligand-gated ion channel (11). As a continuation to those pioneering studies using a combination of electrical and optical recording techniques in this field (27,29,31,47,48), our study provides what we believe to be novel insights into the cAMP-dependent gating in HCN channels and the implementation of protein allostery in general.
Acknowledgments
We thank Dr. De Felice, Dr. Logothetis, and Dr. Siegelbaum for reading the manuscript. We are grateful for the mHCN2 and mHCN2-R591E plasmids from Dr. Siegelbaum. We are thankful to S. Gruszecki, S. Shrestha, and H. Vaananen for their technical supports and to lab members for the comments on this manuscript.
Q.L., L.Z., and co-workers are supported by the startup funds from Virginia Commonwealth University. Q.L. is also supported by a New Scholar Award in Aging from the Ellison Medical Foundation.
The authors declare no competing financial interests.
Supporting Material
References
- 1.Changeux J.P., Edelstein S.J. Allosteric mechanisms of signal transduction. Science. 2005;308:1424–1428. doi: 10.1126/science.1108595. [DOI] [PubMed] [Google Scholar]
- 2.Koshland D.E. Application of a theory of enzyme specificity to protein synthesis. Proc. Natl. Acad. Sci. USA. 1958;44:98–104. doi: 10.1073/pnas.44.2.98. [DOI] [PMC free article] [PubMed] [Google Scholar]
- 3.Goh C.S., Milburn D., Gerstein M. Conformational changes associated with protein-protein interactions. Curr. Opin. Struct. Biol. 2004;14:104–109. doi: 10.1016/j.sbi.2004.01.005. [DOI] [PubMed] [Google Scholar]
- 4.Monod J., Wyman J., Changeux J.P. On the nature of allosteric transitions: a plausible model. J. Mol. Biol. 1965;12:88–118. doi: 10.1016/s0022-2836(65)80285-6. [DOI] [PubMed] [Google Scholar]
- 5.Cui Q., Karplus M. Allostery and cooperativity revisited. Protein Sci. 2008;17:1295–1307. doi: 10.1110/ps.03259908. [DOI] [PMC free article] [PubMed] [Google Scholar]
- 6.Dill K.A., Chan H.S. From Levinthal to pathways to funnels. Nat. Struct. Biol. 1997;4:10–19. doi: 10.1038/nsb0197-10. [DOI] [PubMed] [Google Scholar]
- 7.Henzler-Wildman K.A., Thai V., Kern D. Intrinsic motions along an enzymatic reaction trajectory. Nature. 2007;450:838–844. doi: 10.1038/nature06410. [DOI] [PubMed] [Google Scholar]
- 8.Fraser J.S., Clarkson M.W., Alber T. Hidden alternative structures of proline isomerase essential for catalysis. Nature. 2009;462:669–673. doi: 10.1038/nature08615. [DOI] [PMC free article] [PubMed] [Google Scholar]
- 9.Jackson M.B. Spontaneous openings of the acetylcholine receptor channel. Proc. Natl. Acad. Sci. USA. 1984;81:3901–3904. doi: 10.1073/pnas.81.12.3901. [DOI] [PMC free article] [PubMed] [Google Scholar]
- 10.Tibbs G.R., Goulding E.H., Siegelbaum S.A. Allosteric activation and tuning of ligand efficacy in cyclic-nucleotide-gated channels. Nature. 1997;386:612–615. doi: 10.1038/386612a0. [DOI] [PubMed] [Google Scholar]
- 11.Colquhoun D. Binding, gating, affinity and efficacy: the interpretation of structure-activity relationships for agonists and of the effects of mutating receptors. Br. J. Pharmacol. 1998;125:924–947. doi: 10.1038/sj.bjp.0702164. [DOI] [PMC free article] [PubMed] [Google Scholar]
- 12.Sakmann B., Neher E. Plenum Press; New York: 1995. Single-Channel Recording. [Google Scholar]
- 13.Stevens C.F. Molecular neurobiology. Channel families in the brain. Nature. 1987;328:198–199. doi: 10.1038/328198b0. [DOI] [PubMed] [Google Scholar]
- 14.Hille B. Sinauer; Sunderland, MA: 2001. Ion Channels of Excitable Membranes. [Google Scholar]
- 15.Biel M., Wahl-Schott C., Zong X. Hyperpolarization-activated cation channels: from genes to function. Physiol. Rev. 2009;89:847–885. doi: 10.1152/physrev.00029.2008. [DOI] [PubMed] [Google Scholar]
- 16.DiFrancesco D. Pacemaker mechanisms in cardiac tissue. Annu. Rev. Physiol. 1993;55:455–472. doi: 10.1146/annurev.ph.55.030193.002323. [DOI] [PubMed] [Google Scholar]
- 17.DiFrancesco D., Borer J.S. The funny current: cellular basis for the control of heart rate. Drugs. 2007;67(Suppl 2):15–24. doi: 10.2165/00003495-200767002-00003. [DOI] [PubMed] [Google Scholar]
- 18.Robinson R.B., Siegelbaum S.A. Hyperpolarization-activated cation currents: from molecules to physiological function. Annu. Rev. Physiol. 2003;65:453–480. doi: 10.1146/annurev.physiol.65.092101.142734. [DOI] [PubMed] [Google Scholar]
- 19.Bell D.C., Yao H., Siegelbaum S.A. Changes in local S4 environment provide a voltage-sensing mechanism for mammalian hyperpolarization-activated HCN channels. J. Gen. Physiol. 2004;123:5–19. doi: 10.1085/jgp.200308918. [DOI] [PMC free article] [PubMed] [Google Scholar]
- 20.Vemana S., Pandey S., Larsson H.P. S4 movement in a mammalian HCN channel. J. Gen. Physiol. 2004;123:21–32. doi: 10.1085/jgp.200308916. [DOI] [PMC free article] [PubMed] [Google Scholar]
- 21.Männikkö R., Elinder F., Larsson H.P. Voltage-sensing mechanism is conserved among ion channels gated by opposite voltages. Nature. 2002;419:837–841. doi: 10.1038/nature01038. [DOI] [PubMed] [Google Scholar]
- 22.Swartz K.J. Sensing voltage across lipid membranes. Nature. 2008;456:891–897. doi: 10.1038/nature07620. [DOI] [PMC free article] [PubMed] [Google Scholar]
- 23.Zagotta W.N., Olivier N.B., Gouaux E. Structural basis for modulation and agonist specificity of HCN pacemaker channels. Nature. 2003;425:200–205. doi: 10.1038/nature01922. [DOI] [PubMed] [Google Scholar]
- 24.DiFrancesco D. Dual allosteric modulation of pacemaker (F) channels by cAMP and voltage in rabbit SA node. J. Physiol. 1999;515:367–376. doi: 10.1111/j.1469-7793.1999.367ac.x. [DOI] [PMC free article] [PubMed] [Google Scholar]
- 25.Ulens C., Siegelbaum S.A. Regulation of hyperpolarization-activated HCN channels by cAMP through a gating switch in binding domain symmetry. Neuron. 2003;40:959–970. doi: 10.1016/s0896-6273(03)00753-0. [DOI] [PubMed] [Google Scholar]
- 26.Wang J., Chen S., Siegelbaum S.A. Activity-dependent regulation of HCN pacemaker channels by cyclic AMP: signaling through dynamic allosteric coupling. Neuron. 2002;36:451–461. doi: 10.1016/s0896-6273(02)00968-6. [DOI] [PubMed] [Google Scholar]
- 27.Kusch J., Biskup C., Benndorf K. Interdependence of receptor activation and ligand binding in HCN2 pacemaker channels. Neuron. 2010;67:75–85. doi: 10.1016/j.neuron.2010.05.022. [DOI] [PubMed] [Google Scholar]
- 28.Altomare C., Bucchi A., DiFrancesco D. Integrated allosteric model of voltage gating of HCN channels. J. Gen. Physiol. 2001;117:519–532. doi: 10.1085/jgp.117.6.519. [DOI] [PMC free article] [PubMed] [Google Scholar]
- 29.Biskup C., Kusch J., Benndorf K. Relating ligand binding to activation gating in CNGA2 channels. Nature. 2007;446:440–443. doi: 10.1038/nature05596. [DOI] [PubMed] [Google Scholar]
- 30.Taraska J.W., Zagotta W.N. Fluorescence applications in molecular neurobiology. Neuron. 2010;66:170–189. doi: 10.1016/j.neuron.2010.02.002. [DOI] [PMC free article] [PubMed] [Google Scholar]
- 31.Zheng J., Zagotta W.N. Patch-clamp fluorometry recording of conformational rearrangements of ion channels. Sci. STKE. 2003;2003:PL7. doi: 10.1126/stke.2003.176.pl7. [DOI] [PubMed] [Google Scholar]
- 32.Horne A.J., Fedida D. Use of voltage clamp fluorimetry in understanding potassium channel gating: a review of Shaker fluorescence data. Can. J. Physiol. Pharmacol. 2009;87:411–418. doi: 10.1139/y09-024. [DOI] [PubMed] [Google Scholar]
- 33.Cha A., Bezanilla F. Characterizing voltage-dependent conformational changes in the Shaker K+ channel with fluorescence. Neuron. 1997;19:1127–1140. doi: 10.1016/s0896-6273(00)80403-1. [DOI] [PubMed] [Google Scholar]
- 34.Blunck R., Starace D.M., Bezanilla F. Detecting rearrangements of Shaker and NaChBac in real-time with fluorescence spectroscopy in patch-clamped mammalian cells. Biophys. J. 2004;86:3966–3980. doi: 10.1529/biophysj.103.034512. [DOI] [PMC free article] [PubMed] [Google Scholar]
- 35.Xu X., Vysotskaya Z.V., Zhou L. Structural basis for the cAMP-dependent gating in the human HCN4 channel. J. Biol. Chem. 2010;285:37082–37091. doi: 10.1074/jbc.M110.152033. [DOI] [PMC free article] [PubMed] [Google Scholar]
- 36.Tibbs G.R., Liu D.T., Siegelbaum S.A. A state-independent interaction between ligand and a conserved arginine residue in cyclic nucleotide-gated channels reveals a functional polarity of the cyclic nucleotide binding site. J. Biol. Chem. 1998;273:4497–4505. doi: 10.1074/jbc.273.8.4497. [DOI] [PubMed] [Google Scholar]
- 37.Zhou L., Siegelbaum S.A. Gating of HCN channels by cyclic nucleotides: residue contacts that underlie ligand binding, selectivity, and efficacy. Structure. 2007;15:655–670. doi: 10.1016/j.str.2007.04.012. [DOI] [PMC free article] [PubMed] [Google Scholar]
- 38.Decher N., Chen J., Sanguinetti M.C. Voltage-dependent gating of hyperpolarization-activated, cyclic nucleotide-gated pacemaker channels: molecular coupling between the S4-S5 and C-linkers. J. Biol. Chem. 2004;279:13859–13865. doi: 10.1074/jbc.M313704200. [DOI] [PubMed] [Google Scholar]
- 39.Chen S., Wang J., Siegelbaum S.A. Voltage sensor movement and cAMP binding allosterically regulate an inherently voltage-independent closed-open transition in HCN channels. J. Gen. Physiol. 2007;129:175–188. doi: 10.1085/jgp.200609585. [DOI] [PMC free article] [PubMed] [Google Scholar]
- 40.Tsay D., Dudman J.T., Siegelbaum S.A. HCN1 channels constrain synaptically evoked Ca2+ spikes in distal dendrites of CA1 pyramidal neurons. Neuron. 2007;56:1076–1089. doi: 10.1016/j.neuron.2007.11.015. [DOI] [PMC free article] [PubMed] [Google Scholar]
- 41.Brown H.F., DiFrancesco D., Noble S.J. How does adrenaline accelerate the heart? Nature. 1979;280:235–236. doi: 10.1038/280235a0. [DOI] [PubMed] [Google Scholar]
- 42.DiFrancesco D., Tortora P. Direct activation of cardiac pacemaker channels by intracellular cyclic AMP. Nature. 1991;351:145–147. doi: 10.1038/351145a0. [DOI] [PubMed] [Google Scholar]
- 43.Magee J.C. Dendritic IH normalizes temporal summation in hippocampal CA1 neurons. Nat. Neurosci. 1999;2:848. doi: 10.1038/12229. [DOI] [PubMed] [Google Scholar]
- 44.Catterall W.A. Ion channel voltage sensors: structure, function, and pathophysiology. Neuron. 2010;67:915–928. doi: 10.1016/j.neuron.2010.08.021. [DOI] [PMC free article] [PubMed] [Google Scholar]
- 45.Bezanilla F. How membrane proteins sense voltage. Nat. Rev. Mol. Cell Biol. 2008;9:323–332. doi: 10.1038/nrm2376. [DOI] [PubMed] [Google Scholar]
- 46.Tombola F., Pathak M.M., Isacoff E.Y. How does voltage open an ion channel? Annu. Rev. Cell Dev. Biol. 2006;22:23–52. doi: 10.1146/annurev.cellbio.21.020404.145837. [DOI] [PubMed] [Google Scholar]
- 47.Chang Y., Weiss D.S. Site-specific fluorescence reveals distinct structural changes with GABA receptor activation and antagonism. Nat. Neurosci. 2002;5:1163–1168. doi: 10.1038/nn926. [DOI] [PubMed] [Google Scholar]
- 48.Muroi Y., Czajkowski C., Jackson M.B. Local and global ligand-induced changes in the structure of the GABAA receptor. Biochemistry. 2006;45:7013–7022. doi: 10.1021/bi060222v. [DOI] [PubMed] [Google Scholar]
Associated Data
This section collects any data citations, data availability statements, or supplementary materials included in this article.