

Abstract
The charge versus voltage relation of voltage-sensor domains shifts in the voltage axis depending on the initial voltage. Here we show that in nonconducting W434F Shaker K+ channels, a large portion of this charge-voltage shift is apparent due to a dramatic slowing of the deactivation gating currents, IgD (with τ up to 80 ms), which develops with a time course of ∼1.8 s. This slowing in IgD adds up to the slowing due to pore opening and is absent in the presence of 4-aminopyridine, a compound that prevents the last gating step that leads to pore opening. A remaining 10–15 mV negative shift in the voltage dependence of both the kinetics and the charge movement persists independently of the depolarizing prepulse duration and remains in the presence of 4-aminopyridine, suggesting the existence of an intrinsic offset in the local electric field seen by activated channels. We propose a new (to our knowledge) kinetic model that accounts for these observations.
Voltage-sensor domains (VSD) activate upon membrane depolarization by moving from a resting to an active conformation, and deactivate upon membrane repolarization by returning to their resting state. In general, activation and deactivation gating currents (IgA and IgD, respectively) are asymmetric, with IgD being slowed down or speeded up compared with IgA. In the well-studied nonconducting W434F Shaker K+ channel (1), IgD is slowed down with a voltage and time dependence that correlates with pore opening. It was recently shown that this slowing down is promoted by intersubunit interactions that stabilize the active/open state (2). In addition, when IgD is measured after prolonged depolarization, the voltage dependence of the charge versus voltage (Q-V) curve determined by integrating IgD is strongly shifted (∼50 mV) to negative potentials. This phenomenon, called relaxation, has been observed ubiquitously in voltage-gated channels (3–11), and in the voltage-sensitive Ci-VSP, which does not possess a pore, it develops concomitantly to a conformational change of the VSD to a more stable (relaxed) state (3). In the Shaker channel, relaxation was previously thought to correlate with C-type inactivation (6,9). However, since both ultrafast inactivating W434F Shaker channels and Ci-VSP exhibit similar relaxation, this phenomenon was later found to be an intrinsic property of the VSD that is independent of C-inactivation (3).
We investigated the relaxation in Shaker channels in detail by measuring gating currents from nonconducting non N-inactivating W434F Shaker channels expressed in Xenopus oocytes using the cut-open voltage-clamp technique (12). We measured IgA by pulsing from −120 mV to more-positive voltages, and IgD by prepulsing to 0 mV for various durations before applying a repolarizing pulse to more-negative potentials (Fig. 1 A). The peak current of deactivating Ig measured at −50 mV showed a dramatic decrease in amplitude (Fig. 1 B) as the duration of the prepulse increased, consistent with previous observations (6).
Figure 1.

Kinetic properties of gating currents in W434F Shaker channels. (A) Pulse protocols for recording activation and deactivation. (B) IgD at −50 mV measured after different prepulse durations Δt at 0 mV (in milliseconds; see protocol in panel A). In each graph, the vertical bar represents 20 nA and the applied prepulse duration is indicated. (C) Voltage dependence of τw of IgD as a function of the indicated depolarizing prepulse duration Δt, from 3ms (blue circles) to 30000 ms (red stars). τw values of IgA are shown as black squares. (C, Inset) The values τ are the τw of IgD at −50 mV plotted against the prepulse duration and fitted to a double exponential function. The fit gave two time constants tf = 4.3 ± 0.7 ms and ts = 1780 ± 420 ms (R2=0.997). The data are representative of at least five independent experiments.
We calculated a weighted time constant (τw) for the decaying phase of Ig for each trace by averaging two time constants obtained from a double exponential fit. The τw versus V plot is bell-shaped (Fig. 1 C), reaching its maximum value at the voltage that approximately corresponds to the midpoint of the Q-V curve. The duration of the conditioning prepulse has a dramatic, biphasic slowing effect on the deactivating τw-values. We plotted the deactivation τw-values obtained at −50 mV against the corresponding prepulse duration and fitted the curve to a double exponential function (Fig. 1 C, inset). The fit provided a good correlation (R2 = 0.997) with two time constants, tf∼4.3 ms and ts∼1.8 s. The fast value, tf, is very close to the time course of pore opening of conducting channels and thus corresponds to the open-pore stabilization (2,13). Of interest, the slow value, ts, correlates well with the time course of the reported Q-V shift (6) and the establishment of VSD relaxation (3). We observed similar results in slow inactivating wild-type channels, which shows that C-inactivation does not participate in the biphasic slowing down of IgD (see Fig. S3 in the Supporting Material).
To investigate whether these slower-developing kinetic changes of Ig are related to the reported Q-V shift, we compared the Q-V curves obtained by 1), integrating the deactivating Ig using the same integration time employed previously (50 ms); and 2), using a longer integration time of 300 ms. The results indicate that a ∼−40 mV Q-V shift, similar to previous observations, is obtained with the short integration time. In contrast, the use of a longer integration time shows only a moderate negative Q-V shift of 10–15 mV (Fig. 2). The magnitude of this shift is identical to that of the shift of the V dependence of deactivation τw, which does not depend on the prepulse duration (Fig. 1 C). This result indicates that in Shaker, the relaxation slows down the return of the VSD, which would explain the previously reported apparent immobilization.
Figure 2.
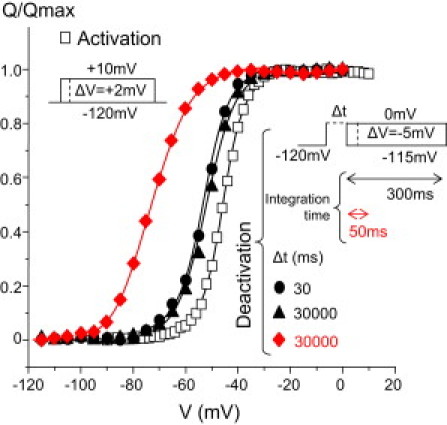
Depolarization-induced apparent Q-V shift. Q/Qmax curves were determined using the indicated activation (open squares, n = 7) and deactivation (solid symbols, n ≥ 4) protocols. For deactivation, the duration of the depolarizing prepulse Δt was 30 ms (circles) or 30000 ms (triangles and diamonds).The total Q during deactivation was calculated with integration times of 300 ms (black circles and triangles) or 50 ms (red diamonds).
Because this 10–15 mV negative shift in the V dependence of Q- and τw-values is independent of the depolarizing prepulse duration, it could result from conformational changes associated with pore opening at the bundle-crossing region, which are maintained in fast-inactivating W434F channels (13). To test this hypothesis, we measured IgA and IgD in the presence of 1 mM 4-aminopyridine (4-AP) to block the late gating transitions that lead to pore opening, without preventing most of the VSD movement (14). We measured IgD by using a 30 ms depolarizing prepulse to 0 mV or by using a holding potential of 0 mV and pulsing every minute. Under the latter conditions, the relaxation (which is established within the order of seconds) would have enough time to develop fully between each pulse. We found no difference in IgD kinetics using these two different protocols (Fig. 3). However, the kinetics were ∼1 order of magnitude faster in the presence of 4-AP than in its absence, in similarity to previous observations (14). Because no slowing down of IgD is observed upon prolonged depolarization, we conclude that the relaxation cannot take place from the active/voltage sensor but pore-closed state of the channel (which is the state favored by 4-AP at 0 mV).
Figure 3.
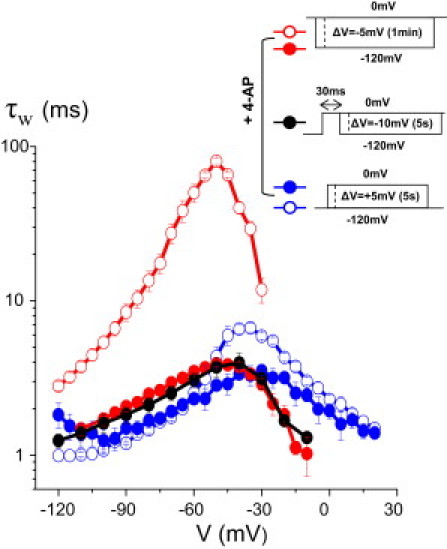
The weighted time constant (τw) of the gating currents were determined during activation (blue symbols), deactivation from a 0 mV holding potential (red symbols), or deactivation after a 30 ms prepulse to 0 mV (black symbols) in the presence (solid symbols, n ≥ 4) or absence (open symbols, n ≥ 6) of 1 mM 4-AP.
Of interest, in the presence of 4-AP, the V dependence of IgD and Q (see Fig. S4) undergoes a 10–15 mV negative shift as compared to the activation τw, which is identical to the shift discussed above. Because 4-AP speeds up the IgD kinetics by ∼1 order of magnitude, the observed shift of the τw and Q-V curve is unlikely to be due to an undetected slow component of Ig, although we cannot entirely exclude the possibility of a buried gating fraction. A possible explanation for this observation is that the fifth and/or sixth charged residues of the S4 segment (which do not contribute to the Ig) polarize the electric field when the VSD is in an active position, thus offsetting the local field seen by deactivating VSD.
The results presented here show that the VSD relaxation in Shaker produces a dramatic slowing down of the gating kinetics rather than a negative shift of the Q-V curve. Our results also strongly suggest that the relaxation occurs only from fully activated (bundle-crossing open) channels. The fact that the relaxation occurs only after pore opening where all the gating charge has moved indicates that the changes in the magnitude of the deactivation τw must occur via a separate pathway during repolarization. These results are predicted by the basic model proposed for the Na channel and Ci-VSP (3,4).
To account for all the observations presented here, we fitted a more elaborate kinetic model to the data. In this model, the deactivation of the VSD follows a different pathway due to the change in the apparent voltage sensed after the active state is reached. Longer depolarizations lead to channel opening, and by maintaining the depolarization, the channel evolves to the relaxed state by a voltage-independent transition. As in the original models (3,4), hyperpolarization recovers the original state by a separate pathway (see Supporting Material).
Acknowledgments
This work was supported by the National Institutes of Health grant GM030376.
Supporting Material
References and Footnotes
- 1.Perozo E., MacKinnon R., Stefani E. Gating currents from a nonconducting mutant reveal open-closed conformations in Shaker K+ channels. Neuron. 1993;11:353–358. doi: 10.1016/0896-6273(93)90190-3. [DOI] [PubMed] [Google Scholar]
- 2.Batulan Z., Haddad G.A., Blunck R. An intersubunit interaction between S4-S5 linker and S6 is responsible for the slow off-gating component in Shaker K+ channels. J. Biol. Chem. 2010;285:14005–14019. doi: 10.1074/jbc.M109.097717. [DOI] [PMC free article] [PubMed] [Google Scholar]
- 3.Villalba-Galea C.A., Sandtner W., Bezanilla F. S4-Based voltage sensors have three major conformations. Proc. Natl. Acad. Sci. USA. 2008;105:17600–17607. doi: 10.1073/pnas.0807387105. [DOI] [PMC free article] [PubMed] [Google Scholar]
- 4.Bezanilla F., Taylor R.E., Fernández J.M. Distribution and kinetics of membrane dielectric polarization. 1. Long-term inactivation of gating currents. J. Gen. Physiol. 1982;79:21–40. doi: 10.1085/jgp.79.1.21. [DOI] [PMC free article] [PubMed] [Google Scholar]
- 5.Shirokov R., Levis R., Ríos E. Two classes of gating current from L-type Ca channels in guinea pig ventricular myocytes. J. Gen. Physiol. 1992;99:863–895. doi: 10.1085/jgp.99.6.863. [DOI] [PMC free article] [PubMed] [Google Scholar]
- 6.Olcese R., Latorre R., Stefani E. Correlation between charge movement and ionic current during slow inactivation in Shaker K+ channels. J. Gen. Physiol. 1997;110:579–589. doi: 10.1085/jgp.110.5.579. [DOI] [PMC free article] [PubMed] [Google Scholar]
- 7.Piper D.R., Varghese A., Tristani-Firouzi M. Gating currents associated with intramembrane charge displacement in HERG potassium channels. Proc. Natl. Acad. Sci. USA. 2003;100:10534–10539. doi: 10.1073/pnas.1832721100. [DOI] [PMC free article] [PubMed] [Google Scholar]
- 8.Kuzmenkin A., Bezanilla F., Correa A.M. Gating of the bacterial sodium channel, NaChBac: voltage-dependent charge movement and gating currents. J. Gen. Physiol. 2004;124:349–356. doi: 10.1085/jgp.200409139. [DOI] [PMC free article] [PubMed] [Google Scholar]
- 9.Larsson H.P., Elinder F. A conserved glutamate is important for slow inactivation in K+ channels. Neuron. 2000;27:573–583. doi: 10.1016/s0896-6273(00)00067-2. [DOI] [PubMed] [Google Scholar]
- 10.Männikkö R., Pandey S., Elinder F. Hysteresis in the voltage dependence of HCN channels: conversion between two modes affects pacemaker properties. J. Gen. Physiol. 2005;125:305–326. doi: 10.1085/jgp.200409130. [DOI] [PMC free article] [PubMed] [Google Scholar]
- 11.Bruening-Wright A., Larsson H.P. Slow conformational changes of the voltage sensor during the mode shift in hyperpolarization-activated cyclic-nucleotide-gated channels. J. Neurosci. 2007;27:270–278. doi: 10.1523/JNEUROSCI.3801-06.2007. [DOI] [PMC free article] [PubMed] [Google Scholar]
- 12.Stefani E., Bezanilla F. Cut-open oocyte voltage-clamp technique. Methods Enzymol. 1998;293:300–318. doi: 10.1016/s0076-6879(98)93020-8. [DOI] [PubMed] [Google Scholar]
- 13.Stefani E. Coupling between charge movement and pore opening in voltage dependent potassium channels. Medicina (B. Aires) 1995;55:591–599. [PubMed] [Google Scholar]
- 14.Loboda A., Armstrong C.M. Resolving the gating charge movement associated with late transitions in K channel activation. Biophys. J. 2001;81:905–916. doi: 10.1016/S0006-3495(01)75750-5. [DOI] [PMC free article] [PubMed] [Google Scholar]
Associated Data
This section collects any data citations, data availability statements, or supplementary materials included in this article.