

Abstract
The food environment is associated with obesity risk and diet-related chronic diseases. Despite extensive research conducted on retail food stores, little is known about prepared food sources (PFSs). We conducted an observational assessment of all PFSs (N = 92) in low-income neighborhoods in Baltimore. The most common PFSs were carry-outs, which had the lowest availability of healthy food choices. Only a small proportion of these carry-outs offered healthy sides, whole wheat bread, or entrée salads (21.4%, 7.1%, and 33.9%, respectively). These findings suggest that carry-out-specific interventions are necessary to increase healthy food availability in low-income urban neighborhoods.
Keywords: food environment, prepared food, restaurants, carry-outs, low-income neighborhoods
BACKGROUND
Obesity and the Food Environment in the United States
Obesity is a leading cause of preventable death in the United States (Gostin 2007) and its prevalence has increased dramatically over the past two decades (Ogden et al. 2006; Wang and Beydoun 2007). Low-income urban African Americans (AA) suffer from obesity and associated chronic diseases at rates higher than national averages (Marshall 2005; Clark and El-Atat 2007; Clark et al. 2001; Grier and Kumanyika 2008). Many urban low-income minorities live in “obesogenic” food environments (Hill and Peters 1998), which include a lack of supermarkets and an abundance of small food stores. (Larson, Story, and Nelson 2009; Morland et al. 2002; Franco et al. 2009; Sloane et al. 2003; Pearce et al. 2007). These areas are also often referred to as food deserts, which have been defined as block groups that are more than one-quarter mile from a supermarket and are comprised of a population in which more than 40 percent are below the poverty line (Center for a Livable Future 2010). Living in these settings is associated with excess energy intake and an increased risk of obesity and chronic diseases (Thompson et al. 2004; Babey et al. 2008).
The Role of Prepared Food Sources in Low-Income AA Settings
In addition to the abundance of small food stores, higher proportions of prepared food sources (PFSs) have been found in predominantly black versus white neighborhoods, and this has been positively associated with racial differences in obesity (Lovasi et al. 2009), neighborhood characteristics (Powell, Chaloupka, and Bao 2007; Franco et al. 2008; Galvez et al. 2008; Morland et al. 2002) and healthy diets (Franco et al. 2009; Moore et al. 2009). While it is difficult to find affordable healthy foods in these settings, high caloric and fatty prepared foods (PFs) are readily available in corner stores and carry-outs (Lee et al. 2010; Cannuscio, Weiss, and Asch 2010; Azuma et al. 2010). Although PFs are generally more costly than those prepared at home, they are still consumed at high rates among those with lower incomes (Guthrie, Lin, and Frazao 2002; French, Harnack, and Jeffery 2000; Kant and Graubard 2004). A recent community food assessment in Baltimore revealed that African American residents spent roughly equal amounts at PFSs as supermarkets, $288 and $274 per month, respectively (Palmer et al. 2007).
Prepared Foods and Associations with Health Outcomes
Within carry-outs and fast-food restaurants, portion sizes have increased extensively to attract customers. Since the 1970s, standard soft drink servings have increased by 49 calories, French fries by 68 calories, and hamburgers by 97 calories (Young and Nestle 2007). The large portion sizes and high calorie and fat content of PFs contribute to many health outcomes associated with obesity (Guthrie, Lin, and Frazao 2002; Young and Nestle 2002; Jeffery et al. 2006; Zoumas-Morse et al. 2001; Nielsen and Popkin 2003; Rolls, Morris, and Roe 2002; Diliberti et al. 2004). Studies have found that frequently eating in PFSs or lower PFS prices are related to higher intake of fat, sodium, and sugar and lower intake of nutrient-dense foods, such as fruits and vegetables (French, Harnack, and Jeffery 2000; Kant and Graubard 2004; McCrory et al. 1999; Beydoun, Powell, and Wang 2009), and as a result, an increased risk for heart disease (Duffey et al. 2007). PF consumption has also been directly linked to three primary indicators of Diabetes Mellitus: high-fasting blood glucose, weight gain, and insulin resistance (Salmeron et al. 1997; Ludwig et al. 1999; Pereira et al. 2005).
Obesity and the Food Environment in Baltimore City, Maryland
Between 59.2 and 63.1 percent of Baltimore City adults are obese or overweight (Balakrishnan, Fichtenberg, and Ames 2008). Adult obesity prevalence is about 30 percent higher in Baltimore City than in Maryland and nationally (Balakrishnan et al. 2008). The 2005 Youth Risk Behavioral Surveillance Survey found 17.6 percent of Baltimore City youth had BMIs greater than the 95th percentile, as compared to 12.6 percent across Maryland (Eaton et al. 2006).
Among Baltimore City AAs, fruit and vegetable intake is extremely low. In 2008, Behavior Risk Factor Surveillance Survey data showed that 23 percent of AAs ate five or more servings of fruits and vegetables a day, compared to 31 percent of Caucasians (Centers for Disease Control and Prevention 2008). Conversely, Baltimore AAs consume many sugary drinks and fatty foods, and PFs provide more than half of their total calories (Gittelsohn and Sharma 2009).
Little is known about PFSs in low-income urban areas, despite their potential role in the obesity epidemic. Moreover, findings regarding the risks associated with PFs in these settings are inconsistent (Larson, Story, and Nelson 2009; Morland, Wing, and Diez Roux 2002; Mobley et al. 2006; Simmons et al. 2005). Such inconclusive findings may be due to the varying definitions of restaurants, the exclusion of carry-outs in their definition, and a lack of descriptive data associated with varying PFSs. This study addressed this gap by answering the following questions:
What types of PFSs are available in low-income Baltimore census tracts?
What healthy foods do these outlets carry?
How do PFSs differ from each other?
METHODS
Geographical Coverage and Sampling of Areas
We focused our analyses on East and West Baltimore; low-income areas comprised of 40 census tracts. These areas were selected for inclusion because they have been previously defined as food deserts (Antin and Hora 2005; Gittelsohn et al. 2007). Our population statistics are based on Census data aggregated to the neighborhood level, rather than analyzed at the individual census tract level (http://webapps.jhu.edu/census and www.bnia.org), and included comprehensive socioeconomic data on the residents within our target areas.
All neighborhoods included in the sample are approximately 90 percent AA (U.S. Census Bureau 2000). The median of median household income in our sample neighborhoods is lower than the city average ($19,070 versus $30,008). To understand the difference between very-low (VL) and moderately-low (ML)-income neighborhoods, income composition was dichotomized by the average median household income (< $19,070, > $19,070~$27,824) of study neighborhoods.
Data Collection
Data on PFSs within the study area was obtained through ground-truthing (Hosler and Dharssi 2010) and direct observation. Data collectors canvassed the area by car and foot, visually inspecting every street and identifying the location and business status (i.e., in-business, out-of-business, or under renovation) of all PFSs. There were no refusals. This provided an up-to-date list of PFSs, as a discrepancy existed between our list of operating sources and those listed in directories. PFs have been defined as ready-to-eat food items, which are prepared and can be purchased on-site (South Dakota Department of Revenue & Regulation 2010).
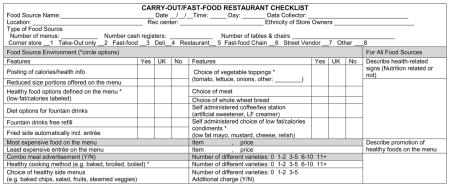
To assess food availability within these venues, we used a modified version of the previously validated Nutrition Environment Measures Study in Restaurants (NEMS-R) data collection instrument (Saelens et al. 2007). Our study team developed and utilized similarly refined NEMS instruments for Baltimore Healthy Stores (www.healthystores.org) and Baltimore Eating Zones research (Dennisuk et al. 2010). In contrast to the NEMS-R, which was designed to gather data on all foods and associated prices, our modified version was primarily focused on health promoting foods and features of PFSs. These modifications enabled observers to collect data in less than 10 minutes; an important asset given the large number of PFSs in Baltimore City and store owner resistance to detailed surveying.
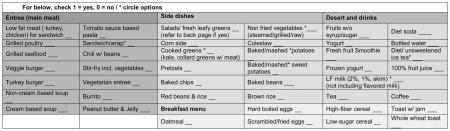
The modified instrument captured: type of PFS, availability of 44 key healthy foods by category (14 entrees; 12 side dishes; 7 breakfast foods; 3 desserts; 11drinks), features of the food source (e.g., health information posted, diet fountain drink options, salad bar presence), and types of healthy foods offered (e.g., whole wheat bread, low fat/low calorie condiments) (appendix). For the purposes of this study, an “entrée” was defined as a main dish of the meal, and may be a stand-alone item or accompanied by an appetizer, dessert, or side, and a “combo meal” was defined as an entrée meal that includes a side and a beverage.
Nutrition information (e.g., fat, calories) for specific foods and recipes was not captured by this instrument, which limited our ability to define foods as healthy or unhealthy. We, therefore, defined foods as healthy if they were estimated to be lower fat and/or sugar as compared to similar alternatives (i.e., comparable food types-beverage, entrée, side and size). We referenced the USDA National Nutrient Database (www.nal.usda.gov/fnic/foodcomp/search) to obtain standardized nutrient contents for the menu items that were common in the carry-out setting. According to the database, an average grilled chicken sandwich (with no condiments) has approximately 9 grams of fat, while and average roast beef sandwich (with no condiments) has an approximately of 18 grams of fat (www.nal.usda.gov/fnic/foodcomp/search). According to our definition, the chicken sandwich was “healthy,” and was, in turn, listed on our checklist of healthy items. We used the same methodology to classify other foods, which were listed on NEMS-R, as healthy, and included those foods on our modified checklist. Once our list was refined, we fielded it in seven sample PFSs to determine if it captured all healthy items that were common in our target venues. We adjusted the instrument based on our findings.
Four data collectors were trained to use the checklist. Data collection was primarily based on observational recall. To enhance reliability, pairs of researchers collected data and compared findings. As an additional method of data validation, PFS menus were obtained (when available), and photographs of displayed menus were taken (when menus were not available). Store owners/managers were asked to verbally consent to photography. All store owners/managers consented. The availability of health related information within each venue was assessed and recorded in addition to the menu analysis.
Data were collected from 92 PFSs in low-income neighborhoods in Baltimore, between May 2009 and April 2010. Storeowner/manager ethnicity was ascertained through informal verbal interactions. Visual identification was used to define ethnicity when necessary. Ethnic categories included Caucasian, Black, South Asian (e.g., Pakistani), East Asian (e.g., Chinese) and Hispanic.
We used the following inclusion criteria for PFSs: (1) The venue must serve PFs (as previously defined); and (2) the venue type must be listed as a limited-service restaurant by the 2007 North American Industry Classification System (NAICS; North American Industry Classification System 2008), in accordance with the methodology developed by Saelens et al. (2007) and Morland et al. (2002). We further classified PFSs into four categories fitting to the unique food environment of low-income neighborhoods in East and West Baltimore: carry-outs and market vendor; corner stores; fast-food chain restaurants; and sit-down restaurants.
A takeout-only carry-out is a restaurant that does not have tables and/or chairs and sells ready-to-eat foods. In this type of restaurant the patron orders and pays before eating. A carry-out restaurant with tables describes a restaurant with tables and chairs where the purchased food is provided after patrons order and pay. A market vendor is a carry-out that is located within a market, some specializing in specific foods. A corner store with a deli describes a retail food store that sells ready to eat prepackaged foods, such as deli meats and cheeses. A corner store with takeout describes a retail food store that sells foods requiring fryers or food warmers. A fast-food chain restaurant describes a corporation-operated “brand name” fast-food business at which the customer orders and pays before eating. A sit-down restaurant describes an establishment with tables and servers. The patron orders food and is served while seated, and pays after eating (does not include fast-food chain restaurants).
The Johns Hopkins Bloomberg School of Public Health Institutional Review Board approved this study.
Data Management and Analysis
STATA 10.1 (STATACorp, College Station, Texas) statistical software was used to perform descriptive statistics. Pearson’s chi square analyses were performed to test for differences in the availability of healthy foods by income strata, and the Fisher’s exact test was used for cells that had a frequency of five or less.
RESULTS
Characteristics of PFSs
Table 1 presents the characteristics of 92 PFSs in the East Baltimore City census tracts. In our study setting, there were 72 carry-outs, 11 corner stores with deli/take-out, 2 sit-down restaurants and 7 fast-food chain restaurants. Carry-out restaurants were the most common PFS (77.2%) and sit-down restaurants were the least common (2.2%). Most (95.7%) food sources had a single cash register. The most common owner ethnicity was Asian (65.2%) and 78.3 percent of those owners were Korean (51.1% of all owners). Other owner ethnicities varied (9.8% African American; 5.4% White/Caucasian; 3.2% Hispanic; 6.5% Middle Eastern; 14.1% unidentified). The majority of non-Korean owners sold ethnicity-specific foods. All Hispanic owners (n = 3) carried Hispanic foods and all Chinese-owned venues (n = 9) were Chinese take-outs.
TABLE 1.
Characteristics of PFSs in Low-Income Baltimore City Neighborhoods, N = 92
| Type of food sources | Total |
|
|---|---|---|
| n | % | |
| Carry-out restaurant | 72 | 78.3 |
| Take-out only | 49 | 53.3 |
| Carry-out w/tables | 8 | 8.7 |
| Market style | 15 | 16.3 |
| Corner store | 11 | 12.0 |
| Corner store w/deli | 7 | 7.6 |
| Corner store w/take-out | 4 | 4.3 |
| Fast-food chain restaurant | 7 | 7.6 |
| Sit-down restaurant | 2 | 2.2 |
Health Promoting Factors in PFSs
Healthy features varied between PFSs (tables 2 and 3). Low fat meats were available for sandwiches in 83.7 percent of the PFSs, but only 41.3 percent offered vegetable sandwich toppings. Healthy sides (e.g., cooked greens, side salad, fruits) were offered in 23.9 percent of the PFSs. Reduced portion size items were most commonly offered in the fast-food chain restaurants (85.7%), while only 42.9 percent of carry-outs and 40.0 percent of market vendors provided that option. Only 4.3 percent of restaurants had self-administered coffee/tea stations, where customers could choose the type and quantity of additives. The same low percentage (4.3%) offered the choice of low-fat condiments. Very few PFSs (5.4%) displayed health or nutrition-content signs.
TABLE 2.
Healthy Features of PFSs in Low-Income Baltimore Neighborhoods, N = 92
| Healthy choice offered | Total |
|
|---|---|---|
| n | % | |
| Low-fat meat offered for subs or sandwiches | 77 | 83.7 |
| Reduced-size portions offered on the menu | 37 | 40.2 |
| Vegetable toppings offered for sandwiches | 38 | 41.3 |
| Choice of healthy sides | 22 | 23.9 |
| Whole-wheat bread available for sandwiches | 10 | 10.9 |
| Promotion/advertisement of healthy foods | 5 | 5.4 |
| Health-related signs | 5 | 5.4 |
| Posting of calorie or other nutrition information for foods on the menu | 4 | 4.3 |
| Self-administered condiments | 4 | 4.3 |
TABLE 3.
Availability of Healthy Foods by Food Source Type in Low-Income Baltimore Neighborhoods, N = 92
|
n % |
|||||
|---|---|---|---|---|---|
| Carry-outs | Corner stores | Sit-down restaurants | Fast-food chains | Market vendors | |
| n = 57 | n = 11 | n = 2 | n = 7 | n = 15 | |
| Healthy eating promoting factors | |||||
| Low-fat meat offered for subs or sandwiches | 47 82.5 |
9 81.8 |
1 50.0 |
7 100.0 |
13 86.7 |
| Reduced-size portions offered on the menu | 24 42.1 |
1 9.1 |
0 0.0 |
6 85.7 |
6 40.0 |
| Vegetable toppings offered for sandwiches | 22 38.6 |
2 18.2 |
0 0.0 |
3 42.9 |
11 73.3 |
| Choice of healthy sides | 12 21.1 |
2 18.2 |
2 100.0 |
2 28.6 |
4 26.7 |
| Advertisement of healthy foods | 3 5.3 |
0 0.0 |
0 0.0 |
0 0.0 |
1 6.7 |
| Whole-wheat bread available for sandwiches | 4 7.0 |
2 18.2 |
0 0.0 |
0 0.0 |
4 26.7 |
| Posting of calorie or other nutrition information for foods on the menu | 2 3.5 |
1 9.1 |
0 0.0 |
1 14.3 |
0 0.0 |
| Designated Healthy menu | 7 12.3 |
0 0.0 |
0 0.0 |
0 0.0 |
1 6.7 |
| Health-related signs | 4 7.0 |
0 0.0 |
0 0.0 |
1 14.3 |
0 0.0 |
| Food | |||||
| Diet soda | 46 80.7 |
11 100.0 |
1 50.0 |
7 100.0 |
13 86.7 |
| Bottled water | 41 73.2 |
10 90.9 |
1 50.0 |
5 71.4 |
15 100.0 |
| Low-fat sandwich | 41 71.9 |
10 90.9 |
2 100.0 |
5 71.4 |
11 73.3 |
| 100% fruit juice | 36 64.3 |
9 81.8 |
0 0.0 |
3 42.9 |
10 66.7 |
| Grilled poultry | 31 54.4 |
6 54.5 |
1 50.0 |
4 57.1 |
9 60.0 |
| Side salad, fresh greens | 24 42.1 |
3 27.3 |
0 0.0 |
4 57.1 |
6 40.0 |
| Cooked greens | 20 35.7 |
0 0.0 |
2 100.0 |
2 28.6 |
3 20.0 |
| Broth-based soup | 20 35.1 |
2 18.2 |
0 | 0 | 8 53.3 |
| Entrée salads | 19 33.3 |
2 18.2 |
0 0.0 |
2 28.6 |
4 26.7 |
| Fruit without syrup | 6 10.5 |
3 27.3 |
0 0.0 |
1 14.3 |
2 13.3 |
Although we did not assess unhealthy foods using our checklists, high-fat foods such as fried chicken wings, fried lake trout, hamburgers and submarine sandwiches were commonly listed on the PFSs menus, which were derived from data collectors’ notes and photographs at our research venues. More than 78.3 percent of PFSs advertise at least one combo meal and 41.7 percent have more than 11. Fried sides were automatically included with entrées in 56.5 percent of PFSs.
Availability of Healthy Foods by Type of Prepared Food Source
Table 3 shows the availability of healthy foods by type of PFS. Healthy menus were found in 8.7 percent of PFSs; all of these venues were Chinese carry-outs that offered steamed/boiled entrees. A lower-fat meat sandwich option was the most commonly offered healthy food (fast-food chains 100%, carry-outs 82.5%, market vendors 86.7%, corner stores 81.8%, and sit-down restaurants 50%). A choice of vegetable toppings was available in 73.3 percent of market vendors, 42.9 percent of the fast-food chain restaurants, 38.6 percent of carry-outs; only 18.2 percent of corner stores offered the choice. Whole wheat sandwich bread was the least available healthy food (less than 11 percent of food sources). Healthy sides were available in all sit-down restaurants and were rarely available in carry-outs and corner stores (21.1% and 18.2%, respectively).
Availability of Healthy Foods by Income Status
Availability of healthy foods was significantly different between ML and VL strata (table 4). VL had significantly more availability of grilled/baked poultry, stir-fried vegetables, turkey burger, side salads, and corn sides than ML. On the other hand, ML had significantly more availability of scrambled/fried eggs, peanut butter and jelly, oatmeal, fresh fruit, and low fat milk than VL.
TABLE 4.
Availability of Foods by Income Strata within the Low-Income Baltimore Neighborhoods (N = 92)
| Healthier Foods | Very low-income neighborhoods (VL) n = 46 |
Moderately low-income neighborhoods (ML) n = 46 |
χ2 | p | ||
|---|---|---|---|---|---|---|
| n | % | n | % | |||
| Entrée | ||||||
| Low-fat meat for sandwich (turkey, chicken) | 32 | 69.6 | 37 | 80.4 | 1.449 | .229 |
| Grilled/baked poultry | 32 | 69.6 | 19 | 41.3 | 7.4357 | .006* |
| Broth-based soup | 18 | 39.1 | 13 | 28.3 | 1.2163 | .27 |
| Entrée salad | 14 | 30.4 | 13 | 28.3 | 0.1355 | .713 |
| Grilled/baked seafood | 10 | 21.7 | 6 | 13.0 | 1.2105 | .271 |
| Stir-fry incl. vegetables | 9 | 19.6 | 3 | 6.5 | 3.45 | .063 |
| Turkey burger | 6 | 13.0 | 2 | 4.3 | 2.1905 | .139 |
| Breakfast | ||||||
| Scrambled/fried eggs | 17 | 37.0 | 27 | 58.7 | 4.3561 | .037* |
| Peanut butter and jelly | 0 | 0.0 | 3 | 6.5 | 3.1011 | .078 |
| Oatmeal | 0 | 0.0 | 4 | 8.7 | 4.1818 | .041* |
| Whole-wheat toast | 3 | 6.5 | 1 | 2.2 | 2.0115 | .366 |
| Sides | ||||||
| Salads/fresh leafy greens | 22 | 47.8 | 15 | 32.6 | 2.2152 | .137 |
| Cooked greens (kale, collard greens) | 14 | 30.4 | 13 | 28.3 | 0.0529 | .974 |
| Coleslaw | 11 | 23.9 | 6 | 13.0 | 1.8039 | .179 |
| Baked/mashed potato | 8 | 17.4 | 9 | 19.6 | 0.0722 | .788 |
| Corn side | 10 | 21.7 | 5 | 10.9 | 1.9913 | .158 |
| Fruits | 4 | 8.7 | 9 | 19.6 | 2.2395 | .135 |
| Other | ||||||
| Diet soda | 37 | 80.4 | 41 | 89.1 | 1.348 | .246 |
| Bottled water | 39 | 84.8 | 34 | 73.9 | 1.6583 | .198 |
| 100% fruit juice | 31 | 67.4 | 27 | 58.7 | 1.5486 | .461 |
| Unsweetened tea | 8 | 17.4 | 11 | 23.9 | 0.597 | .44 |
| Low-fat milk (2%, 1%, skim) | 1 | 2.2 | 5 | 10.9 | 4.7143 | .095 |
Note. The median of median household income ($19,070; range $11,276–$27,824) provided the cut-off between very-low (VL) and moderately-low (ML) income levels.
p < .05.
DISCUSSION
Several studies have been conducted in restaurants in ethnically and socio-economically diverse populations (Saelens et al. 2007; Lewis et al. 2005; Economos et al. 2009; Hanni et al. 2009). This is one of the first studies, however, to describe the entire PFS environment in a low-income AA urban setting. We found many parallels between this research and our other research on food availability in corner stores in the same Baltimore City neighborhoods (Franco et al. 2008; Moore et al. 2009). For example, within low-income AA neighborhoods in Baltimore City, most food sources (prepared or retail) were Korean owned, had low healthy food availability and low health promoting features (Gittelsohn et al. 2007).
Most PFSs were carry-outs, which had the lowest healthy food availability. Our findings are comparable to other urban low-income settings in the U.S. A recent study conducted in low-income areas in Los Angeles found that fast-food outlets and carry-outs were the most common (30%) retail food outlets (Azuma et al. 2010). In Philadelphia, Chinese take-out restaurants and “stop-and-go” shops (delis that also sell beer) were commonly found in low-income AA neighborhoods (Cannuscio, Weiss, and Asch 2010). These studies categorized and localized PFSs in low-income urban settings but did not investigate PF store content or food offerings. Such data is necessary to develop effective carryout interventions that improve the availability of healthy food options and sustain the purchase of healthy foods through incentives like point of purchase promotions.
Our study found that 33.3 percent of carry-outs and 28.6 percent of fast-food restaurants had entrée salad availability. A NEMS-R study, including Atlanta PFSs (N = 102), produced similar findings for fast-food restaurants with entrée salad availability of 24.5 percent (Saelens et al. 2007). The NEMS-R study, however, did not stratify other PFSs and could not compare healthy food availability of carry-outs. The checklist provided insight into available healthier foods that are popular in low-income urban PFSs. For example, most commonly available cooked greens (string beans, collard greens or kale) and leafy green salads have a lower fat than other commonly offered sides (French fries and macaroni and cheese). Moreover, preparation methods can be modified in future pilot and feasibility trials. The availability of greens, in combination with the adjustment of cooking methods, could provide a low-calorie nutrient-rich alternative to common PFS sides.
We found that carry-outs sell similar foods as fast-food restaurants but had a significantly different physical layout. The majority of carry-outs stored and sold foods behind floor-to-ceiling glass partitions and most carry-out owners and managers spoke little English. These two features could limit the customer’s ability to order a customized healthier meal, or request healthier options. The glass barrier reduces the interaction between customers and storeowners, leaving owners to guess which foods may be popular. Baltimore Healthy Stores intervention observed similar barriers in Korean American owned corner stores during the intervention (Song et al. 2009, 2010). This issue warrants further exploration.
Also, limited space for menus could inhibit the ability of stores to convey nutritional information. Also, lack of equipment such as small refrigerators, could limit their ability to carry healthy items. Most PFSs also lacked self-serve condiment stations. In one of our intervention trials, healthy choices at self-condiment stations, in conjunction with health education, positively influenced consumer dietary habits (Ho et al. 2008).
Our study had several other limitations. While our modified NEMS-R environmental checklist was relatively simple and easy to implement, it did not capture the entire range of healthy or unhealthy components of PFSs. While we attempted to tailor the revised instrument to capture data on food items in specialized food sources (e.g., steamed vegetables at Chinese carry-outs, etc.); we could expand the checklist to be targeted to specific types of PFSs in order to capture the range of healthy and unhealthy options in these varying settings. Our instrument also did not capture enough food pricing data to perform food pricing analyses for a range of menu items. However, our study contributes to the limited literature on availability of foods in PFSs for which there are no standard data on food composition and portion size (i.e., owner defined small, medium and large). Future research is warranted in order to examine these issues.
As the instrument used was observation-based, it was difficult to accurately classify foods as healthy and unhealthy. We relied on assumptions regarding fat, caloric and fiber content of foods. Without direct knowledge of cooking or preparation methods, we cannot be certain that foods are low in fat and calories. We searched the USDA National Nutrient database to obtain standard recipes for the menu items’ caloric and fat content. Although, it is possible that a turkey sandwich can contain higher calories and fat compared to a corned beef sandwich based on the cooking method, we made an assumption that within the same menu category, the cooking method will be the same. Moreover, as opposed to corner stores, which often carry standardized packaged foods (Variyam 2008) that list nutritional information, the serving sizes of prepared foods are unknown and may vary greatly between each respective source. Future work should include analyses of prepared food nutrient content data to provide rationale for the classification of healthy and unhealthy food offerings. Additional studies are also needed to develop a healthy food index, which includes an analysis of cooking/preparation methods and serving sizes, scores based on estimated nutrient content, and ranking, based on a collective analysis of scores, which would be used to compare PFSs. Interventions, which target cooking/preparation methods and serving sizes, should be considered as a means to promote healthy eating in these venues.
Our checklist was not able to capture accurate pricing information because many PFSs did not have prices posted on the menu or were outdated. Many studies suggest that price may influence consumer behavior (Morland et al. 2002; Jetter and Cassady 2006; Ard et al. 2007; Zenk et al. 2006; Drewnowski and Darmon 2005). Antin and Hora (2005) conducted qualitative research among single mothers in low-income East Baltimore, and found that mothers with fewer than 3 children were eating out more often than mothers with 3 and more children. Overall, informants expressed that convenience and pricing were the most important factors in choosing a store. Without information pertaining to the price of all available foods, it is difficult to present a detailed description of its role in the prepared food environment.
We used neighborhood census data, which combines “some geographical and social aspects” (www.bnia.org), defined by the City Planning Department. This Baltimore City specific data explains low-income areas better than census tracts. In addition, the census data used are 10 years old and the areas may have changed as a result of immigration and the ongoing economic downturn. Since there is a temporal disconnect in the data, similar analyses can be performed after the release of 2010 national census data in near future.
The small sample size and PFS type also limited our ability to detect significant differences between food source types. Within our study setting, there were 11 corner stores, 2 sit-down restaurants and 7 fast-food chain restaurants, which resulted in very small sample sizes to compare with the 72 carry-outs. Despite the small sample sizes, this is the first data available on PFSs in low-income urban settings. Future studies should examine the distribution of PFSs over a greater expanse of Baltimore, and in other urban settings.
In spite of these limitations, our current study adds to previously published literature on PFSs, and can contribute to the development of carry-out interventions. This is especially relevant considering their prominence in low-income AA settings. Previous studies conducted in Baltimore focused on small and medium sized grocery stores (Song et al. 2009), recreation centers (Dennisuk et al. 2010) and schools. There have been a few environmental interventions conducted in restaurants (Albright, Flora, and Fortmann 1990; Horgen and Brownell 2002), department store food service areas (Eldridge et al. 1997) and fast-food restaurants (Wagner and Winett 1988), but their intervention sites were not located in low-income areas. The only previous PFS interventions in low-income areas that have shown some success were conducted by Hanni et al. (Hanni et al. 2009) in Salinas, California, focusing on Hispanic-owned taquerias. The taquerias intervention included a social marketing strategy, providing healthier menu options, to the taqueria owners. Researchers concluded that after participating in the intervention, taqueria storeowners’ perceptions regarding healthy food availability changed. As a result, owners voluntarily offered healthier menu items. However, taqueria owners in Salinas, California, are Latinos serving a Latino community, whereas, in many urban carry-outs, owners are Korean Americans serving an African American community; the latter situation may require a population-specific intervention since the owners’ changes in food preparation practices are not directly benefitting their own community.
Our environmental data on PFSs provided useful insight into the availability of healthy foods in low-income AA neighborhoods in Baltimore City. Additional formative research is needed to understand customers’ and storeowners’ views on healthier prepared foods in order to strengthen interventions in PFSs located in low-income urban AA settings.
Acknowledgments
This work was supported by the Baltimore Diabetes Research and Training Center and the Center for a Livable Future. The authors would like to thank local carry-out owners who were willing to let data collectors observe their store environments.
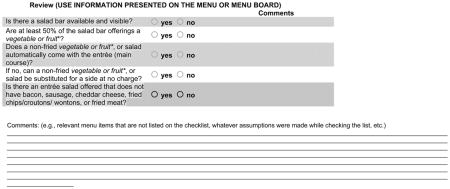
APPENDIX Prepared Food Sources Environmental Checklist
Contributor Information
SEUNG HEE LEE, Center for Human Nutrition, Bloomberg School of Public Health, Johns Hopkins University, Baltimore, Maryland, USA.
MEGAN T. ROWAN, Center for Human Nutrition, Bloomberg School of Public Health, Johns Hopkins University, Baltimore, Maryland, USA
LISA M. POWELL, Institute for Health Research and Policy, University of Illinois at Chicago, Chicago, Illinois, USA
SARA NEWMAN, Center for Human Nutrition, Bloomberg School of Public Health, Johns Hopkins University, Baltimore, Maryland, USA.
ANN CARROLL KLASSEN, Center for Human Nutrition, and Department of Health, Behavior and Society, Bloomberg School of Public Health, Johns Hopkins University, Baltimore, Maryland, USA.
KEVIN D. FRICK, Department of Health Policy and Management, Bloomberg School of Public Health, Johns Hopkins University, Baltimore, Maryland, USA
JENNIFER ANDERSON, Center for Human Nutrition, Bloomberg School of Public Health, Johns Hopkins University, Baltimore, Maryland, USA.
JOEL GITTELSOHN, Center for Human Nutrition, Bloomberg School of Public Health, Johns Hopkins University, Baltimore, Maryland, USA.
References
- Albright CL, Flora JA, Fortmann SP. Restaurant menu labeling: Impact of nutrition information on entree sales and patron attitudes. Health Education & Behavior. 1990;17(2):157. doi: 10.1177/109019819001700203. [DOI] [PubMed] [Google Scholar]
- Antin TM, Hora MT. Distance and beyond: Variables influencing conceptions of food store accessibility in Baltimore, Maryland. Practicing Anthropology. 2005;27(2):15–7. [Google Scholar]
- Ard JD, Fitzpatrick S, Desmond RA, Sutton BS, Pisu M, Allison DB, Franklin F, Baskin ML. The impact of cost on the availability of fruits and vegetables in the homes of schoolchildren in Birmingham, Alabama. American Journal of Public Health. 2007;97(2):367–72. doi: 10.2105/AJPH.2005.080655. [DOI] [PMC free article] [PubMed] [Google Scholar]
- Azuma AM, Gilliland S, Vallianatos M, Gottlieb R. Food access, availability, and affordability in 3 Los Angeles communities, project CAFE, 2004–2006. Preventing Chronic Disease. 2010;7(2):A27. [PMC free article] [PubMed] [Google Scholar]
- Babey SH, Diamant AL, Hastert TA, Harvey S. Designed for disease: The link between local food environments and obesity and diabetes. UCLA Center for Health Policy Research; UC Los Angeles: 2008. [accessed June 26, 2010]. http://escholarship.org/uc/item/7sf9t5wx. [Google Scholar]
- Balakrishnan A, Fichtenberg C, Ames A. Baltimore city health department data fact sheet, Baltimore city health Department’s office of epidemiology and planning. [accessed February 3, 2010];2008 http://www.baltimorehealth.org/info/2008_07_22.ObesityFactSheet.pdf.
- Beydoun MA, Powell LM, Wang Y. Reduced away-from-home food expenditure and better nutrition knowledge and belief can improve quality of dietary intake among U.S. adults. Public Health Nutrition. 2009;12(3):369–381. doi: 10.1017/S1368980008002140. [DOI] [PubMed] [Google Scholar]
- Cannuscio CC, Weiss EE, Asch DA. The contribution of urban foodways to health disparities. Journal of Urban Health. 2010;87(3):381–393. doi: 10.1007/s11524-010-9441-9. [DOI] [PMC free article] [PubMed] [Google Scholar]
- Center for a Livable Future. [accessed June 28, 2010];CLF’s Maryland food system mapping project: Food deserts in Baltimore. 2010 http://www.jhsph.edu/clf/PDF_Files/food_systems/Food_Deserts_notes.pdf.
- Centers for Disease Control and Prevention. [accessed February 8, 2010];Behavioral risk factor surveillance system survey data. 2008 http://www.cdc.gov/brfss/
- Clark JM, Bone LR, Stallings R, Gelber AC, Barker A, Zeger S, Hill MN, Levine DM. Obesity and approaches to weight in an urban African-American community. Ethnicity & Disease. 2001;11(4):676–686. [PubMed] [Google Scholar]
- Clark LT, El-Atat F. Metabolic syndrome in African Americans: Implications for preventing coronary heart disease. Clinical Cardiology. 2007;30(4):161–164. doi: 10.1002/clc.20003. [DOI] [PMC free article] [PubMed] [Google Scholar]
- Dennisuk L, Lee SH, Rowan M, Suratkar S, Christiansen K, Sharma S, Gittelsohn J. Food environment around recreation centers in low-income neighborhoods of Baltimore city. The FASEB Journal. 2010;24:558.16. (1 Meeting Abstracts) [Google Scholar]
- Diliberti N, Bordi PL, Conklin MT, Roe LS, Rolls BJ. Increased portion size leads to increased energy intake in a restaurant meal. Obesity Research. 2004;12(3):562–568. doi: 10.1038/oby.2004.64. [DOI] [PubMed] [Google Scholar]
- Drewnowski A, Darmon N. The economics of obesity: Dietary energy density and energy cost. The American Journal of Clinical Nutrition. 2005;82(1 Suppl):265S–273S. doi: 10.1093/ajcn/82.1.265S. [DOI] [PubMed] [Google Scholar]
- Duffey KJ, Gordon-Larsen P, Jacobs DR, Jr, Williams OD, Popkin BM. Differential associations of fast food and restaurant food consumption with 3-y change in Body Mass Index: The coronary artery risk development in young adults study. The American Journal of Clinical Nutrition. 2007;85(1):201–208. doi: 10.1093/ajcn/85.1.201. [DOI] [PubMed] [Google Scholar]
- Eaton DK, Kann L, Kinchen S, Ross J, Hawkins J, Harris WA, Lowry R, et al. Youth risk behavior surveillance-United States, 2005. Morbidity and Mortality Weekly Report. Surveillance Summaries/CDC. 2006;55(5):1–108. [PubMed] [Google Scholar]
- Economos CD, Folta SC, Goldberg J, Hudson D, Collins J, Baker Z, Lawson E, Nelson M. A community-based restaurant initiative to increase availability of healthy menu options in Somerville, Massachusetts: Shape up Somerville. Preventing Chronic Disease. 2009;6(3):A102. [PMC free article] [PubMed] [Google Scholar]
- Eldridge AL, Snyder MP, Faus NG, Kotz K. Development and evaluation of a labeling program for low-fat foods in a discount department store foodservice area. Journal of Nutrition Education. 1997;29:159–161. [Google Scholar]
- Franco M, Diez Roux AV, Glass TA, Caballero B, Brancati FL. Neighborhood characteristics and availability of healthy foods in Baltimore. American Journal of Preventive Medicine. 2008;35(6):561–567. doi: 10.1016/j.amepre.2008.07.003. [DOI] [PMC free article] [PubMed] [Google Scholar]
- Franco M, Diez-Roux AV, Nettleton JA, Lazo M, Brancati F, Caballero B, Glass T, Moore LV. Availability of healthy foods and dietary patterns: The multi-ethnic study of atherosclerosis. The American Journal of Clinical Nutrition. 2009;89(3):897–904. doi: 10.3945/ajcn.2008.26434. [DOI] [PMC free article] [PubMed] [Google Scholar]
- French SA, Harnack L, Jeffery RW. Fast food restaurant use among women in the pound of prevention study: Dietary, behavioral and demographic correlates. International Journal of Obesity. 2000;24(10):1353–1359. doi: 10.1038/sj.ijo.0801429. [DOI] [PubMed] [Google Scholar]
- Galvez MP, Morland K, Raines C, Kobil J, Siskind J, Godbold J, Brenner B. Race and food store availability in an inner-city neighbourhood. Public Health Nutrition. 2008;11(6):624–631. doi: 10.1017/S1368980007001097. [DOI] [PubMed] [Google Scholar]
- Gittelsohn J, Franceschini MCT, Rasooly IR, Ries AV, Ho LS, Santos VT, Jennings SM, Frick KD. Understanding the food environment in a low-income urban settings: Implications for food store interventions. Journal of Hunger and Environmental Nutrition. 2007;2(2/3):33–50. [Google Scholar]
- Gittelsohn J, Sharma S. Physical, consumer, and social aspects of measuring the food environment among diverse low-income populations. American Journal of Preventive Medicine. 2009;36(4 Suppl):S161–S165. doi: 10.1016/j.amepre.2009.01.007. [DOI] [PMC free article] [PubMed] [Google Scholar]
- Gostin LO. Law as a tool to facilitate healthier lifestyles and prevent obesity. JAMA: The Journal of the American Medical Association. 2007;297(1):87–90. doi: 10.1001/jama.297.1.87. [DOI] [PubMed] [Google Scholar]
- Grier SA, Kumanyika SK. The context for choice: Health implications of targeted food and beverage marketing to African Americans. American Journal of Public Health. 2008;98(9):1616–1629. doi: 10.2105/AJPH.2007.115626. [DOI] [PMC free article] [PubMed] [Google Scholar]
- Guthrie JF, Lin BH, Frazao E. Role of food prepared away from home in the american diet, 1977–78 versus 1994–96: Changes and consequences. Journal of Nutrition Education and Behavior. 2002;34(3):140–150. doi: 10.1016/s1499-4046(06)60083-3. [DOI] [PubMed] [Google Scholar]
- Hanni KD, Garcia E, Ellemberg C, Winkleby M. Targeting the taqueria: Implementing healthy food options at Mexican American restaurants. Health Promotion Practice. 2009;10(2 Suppl):91S–99S. doi: 10.1177/1524839908331268. [DOI] [PubMed] [Google Scholar]
- Hill JO, Peters JC. Environmental contributions to the obesity epidemic. Science. 1998;280(5368):1371–1374. doi: 10.1126/science.280.5368.1371. [DOI] [PubMed] [Google Scholar]
- Ho LS, Gittelsohn J, Rimal R, Treuth MS, Sharma S, Rosecrans A, Harris SB. An integrated multi-institutional diabetes prevention program improves knowledge and healthy food acquisition in northwestern ontario first nations. Health Education & Behavior: The Official Publication of the Society for Public Health Education. 2008;35(4):561–573. doi: 10.1177/1090198108315367. [DOI] [PubMed] [Google Scholar]
- Horgen KB, Brownell KD. Comparison of price change and health message interventions in promoting healthy food choices. Health Psychology. 2002;21(5):505–512. doi: 10.1037//0278-6133.21.5.505. [DOI] [PubMed] [Google Scholar]
- Hosler AS, Dharssi A. Identifying retail food stores’ to evaluate the food environment. American Journal of Preventive Medicine. 2010;39(1):41–44. doi: 10.1016/j.amepre.2010.03.006. [DOI] [PubMed] [Google Scholar]
- Jeffery RW, Baxter J, McGuire M, Linde J. Are fast food restaurants an environmental risk factor for obesity? The International Journal of Behavioral Nutrition and Physical Activity. 2006;3:2. doi: 10.1186/1479-5868-3-2. [DOI] [PMC free article] [PubMed] [Google Scholar]
- Jetter KM, Cassady DL. The availability and cost of healthier food alternatives. American Journal of Preventive Medicine. 2006;30(1):38–44. doi: 10.1016/j.amepre.2005.08.039. [DOI] [PubMed] [Google Scholar]
- Kant AK, Graubard BI. Eating out in America, 1987–2000: Trends and nutritional correlates. Preventive Medicine. 2004;38(2):243–249. doi: 10.1016/j.ypmed.2003.10.004. [DOI] [PubMed] [Google Scholar]
- Larson NI, Story MT, Nelson MC. Neighborhood environments: Disparities in access to healthy foods in the U.S. American Journal of Preventive Medicine. 2009;36(1):74–81. doi: 10.1016/j.amepre.2008.09.025. [DOI] [PubMed] [Google Scholar]
- Lee SH, Rowan MT, Newman S, Anderson J, Suratkar SR, Klassen AC, Frick K, Powell LM, Gittelsohn J. Description of prepared foods around recreation center in low income neighborhoods in Baltimore city. The FASEB Journal. 2010;24:744.7. (1 Meeting Abstracts) [Google Scholar]
- Lewis LB, Sloane DC, Nascimento LM, Diamant AL, Guinyard JJ, Yancey AK, Flynn G REACH Coalition of the African Americans Building a Legacy of Health Project. African Americans’ access to healthy food options in south Los Angeles restaurants. American Journal of Public Health. 2005;95(4):668–673. doi: 10.2105/AJPH.2004.050260. [DOI] [PMC free article] [PubMed] [Google Scholar]
- Lovasi GS, Hutson MA, Guerra M, Neckerman KM. Built environments and obesity in disadvantaged populations. Epidemiologic Reviews. 2009;31:7–20. doi: 10.1093/epirev/mxp005. [DOI] [PubMed] [Google Scholar]
- Ludwig DS, Majzoub JA, Al-Zahrani A, Dallal GE, Blanco I, Roberts SB. High glycemic index foods, overeating, and obesity. Pediatrics. 1999;103(3):E26. doi: 10.1542/peds.103.3.e26. [DOI] [PubMed] [Google Scholar]
- Marshall MC., Jr Diabetes in African Americans. Postgraduate Medical Journal. 2005;81(962):734–740. doi: 10.1136/pgmj.2004.028274. [DOI] [PMC free article] [PubMed] [Google Scholar]
- McCrory MA, Fuss PJ, Hays NP, Vinken AG, Greenberg AS, Roberts SB. Overeating in America: Association between restaurant food consumption and body fatness in healthy adult men and women ages 19 to 80. Obesity Research. 1999;7(6):564–571. doi: 10.1002/j.1550-8528.1999.tb00715.x. [DOI] [PubMed] [Google Scholar]
- Mobley LR, Root ED, Finkelstein EA, Khavjou O, Farris RP, Will JC. Environment, obesity, and cardiovascular disease risk in low-income women. American Journal of Preventive Medicine. 2006;30(4):327–332. doi: 10.1016/j.amepre.2005.12.001. [DOI] [PubMed] [Google Scholar]
- Moore LV, Diez Roux AV, Nettleton JA, Jacobs DR, Franco M. Fast-food consumption, diet quality, and neighborhood exposure to fast food: The multi-ethnic study of atherosclerosis. American Journal of Epidemiology. 2009;170(1):29–36. doi: 10.1093/aje/kwp090. [DOI] [PMC free article] [PubMed] [Google Scholar]
- Morland K, Wing S, Diez Roux A. The contextual effect of the local food environment on residents’ diets: The atherosclerosis risk in communities study. American Journal of Public Health. 2002;92(11):1761–1767. doi: 10.2105/ajph.92.11.1761. [DOI] [PMC free article] [PubMed] [Google Scholar]
- Morland K, Wing S, Diez Roux A, Poole C. Neighborhood characteristics associated with the location of food stores and food service places. American Journal of Preventive Medicine. 2002;22(1):23–29. doi: 10.1016/s0749-3797(01)00403-2. [DOI] [PubMed] [Google Scholar]
- Nielsen SJ, Popkin BM. Patterns and trends in food portion sizes, 1977–1998. JAMA: The Journal of the American Medical Association. 2003;289(4):450–453. doi: 10.1001/jama.289.4.450. [DOI] [PubMed] [Google Scholar]
- North American Industry Classification System. [accessed January 25 2010];2007 NAICS definition: 722211 limited-service restaurants. 2008 http://www.census.gov/cgibin/sssd/naics/naicsrch?code=722211&search=2007%20NAICS%20Search.
- Ogden CL, Carroll MD, Curtin LR, McDowell MA, Tabak CJ, Flegal KM. Prevalence of overweight and obesity in the united states, 1999–2004. JAMA: The Journal of the American Medical Association. 2006;295(13):1549–1555. doi: 10.1001/jama.295.13.1549. [DOI] [PubMed] [Google Scholar]
- Palmer A, Haering S, Smith J, McKenzie S. Understanding and addressing food security in southwest Baltimore. Baltimore: Mid-Atlantic Health Leadership Institute; 2007. [Google Scholar]
- Pearce J, Blakely T, Witten K, Bartie P. Neighborhood deprivation and access to fast-food retailing: A national study. American Journal of Preventive Medicine. 2007;32(5):375–382. doi: 10.1016/j.amepre.2007.01.009. [DOI] [PubMed] [Google Scholar]
- Pereira MA, Kartashov AI, Ebbeling CB, Van Horn L, Slattery ML, Jacobs DR. Fast-food habits, weight gain, and insulin resistance (the CARDIA study): 15-year prospective analysis. The Lancet. 2005;365(9453):36–42. doi: 10.1016/S0140-6736(04)17663-0. [DOI] [PubMed] [Google Scholar]
- Powell LM, Chaloupka FJ, Bao Y. The availability of fast-food and full-service restaurants in the united states: Associations with neighborhood characteristics. American Journal of Preventive Medicine. 2007;33(4 Suppl):S240–S245. doi: 10.1016/j.amepre.2007.07.005. [DOI] [PubMed] [Google Scholar]
- Rolls BJ, Morris EL, Roe LS. Portion size of food affects energy intake in normal-weight and overweight men and women. The American Journal of Clinical Nutrition. 2002;76(6):1207–1213. doi: 10.1093/ajcn/76.6.1207. [DOI] [PubMed] [Google Scholar]
- Saelens BE, Glanz K, Sallis JF, Frank LD. Nutrition environment measures study in restaurants (NEMS-R): Development and evaluation. American Journal of Preventive Medicine. 2007;32(4):273–281. doi: 10.1016/j.amepre.2006.12.022. [DOI] [PubMed] [Google Scholar]
- Salmeron J, Ascherio A, Rimm EB, Colditz GA, Spiegelman D, Jenkins DJ, Stampfer MJ, Wing AL, Willett WC. Dietary fiber, glycemic load, and risk of NIDDM in men. Diabetes Care. 1997;20(4):545. doi: 10.2337/diacare.20.4.545. [DOI] [PubMed] [Google Scholar]
- Simmons D, McKenzie A, Eaton S, Cox N, Khan MA, Shaw J, Zimmet P. Choice and availability of takeaway and restaurant food is not related to the prevalence of adult obesity in rural communities in Australia. International Journal of Obesity. 2005;29(6):703–710. doi: 10.1038/sj.ijo.0802941. [DOI] [PubMed] [Google Scholar]
- Sloane DC, Diamant AL, Lewis LB, Yancey AK, Flynn G, Nascimento LM, McCarthy WJ, Guinyard JJ, Cousineau MR REACH Coalition of the African American Building a Legacy of Health Project. Improving the nutritional resource environment for healthy living through community-based participatory research. Journal of General Internal Medicine. 2003;18(7):568–575. doi: 10.1046/j.1525-1497.2003.21022.x. [DOI] [PMC free article] [PubMed] [Google Scholar]
- Song HJ, Gittelsohn J, Kim MY, Suratkar S, Sharma S, Anliker J. Korean American storeowners’ perceived barriers and motivators for implementing a corner store-based program. Health Promotion Practice. 2010 doi: 10.1177/1524839910364369. Ahead of print #1524839910364369v1. [DOI] [PubMed] [Google Scholar]
- Song HJ, Gittelsohn J, Kim M, Suratkar S, Sharma S, Anliker J. A corner store intervention in a low-income urban community is associated with increased availability and sales of some healthy foods. Public Health Nutrition. 2009;12(11):2060–2067. doi: 10.1017/S1368980009005242. [DOI] [PMC free article] [PubMed] [Google Scholar]
- South Dakota Department of Revenue & Regulation. [accessed Aug 3, 2010];Prepared food fact sheet. 2010 http://www.state.sd.us/drr2/businesstax/publications/taxfacts/preparedfood.pdf.
- Thompson OM, Ballew C, Resnicow K, Must A, Bandini LG, Cyr H, Dietz WH. Food purchased away from home as a predictor of change in BMI z-score among girls. International Journal of Obesity and Related Metabolic Disorders: Journal of the International Association for the Study of Obesity. 2004;28(2):282–9. doi: 10.1038/sj.ijo.0802538. [DOI] [PubMed] [Google Scholar]
- U.S. Census Bureau. [accessed January 30, 2010];Census 2000. 2000 http://www.census.gov/main/www/cen2000.html.
- Variyam JN. Do nutrition labels improve dietary outcomes? Health Economics. 2008;17(6):695–708. doi: 10.1002/hec.1287. [DOI] [PubMed] [Google Scholar]
- Wagner JL, Winett RA. Prompting one low-fat, high-fiber selection in a fast-food restaurant. Journal of Applied Behavior Analysis. 1988;21(2):179. doi: 10.1901/jaba.1988.21-179. [DOI] [PMC free article] [PubMed] [Google Scholar]
- Wang Y, Beydoun MA. The obesity epidemic in the united states–gender, age, socioeconomic, racial/ethnic, and geographic characteristics: A systematic review and meta-regression analysis. Epidemiologic Reviews. 2007;29:6–28. doi: 10.1093/epirev/mxm007. [DOI] [PubMed] [Google Scholar]
- Young LR, Nestle M. The contribution of expanding portion sizes to the U.S. obesity epidemic. American Journal of Public Health. 2002;92(2):246–249. doi: 10.2105/ajph.92.2.246. [DOI] [PMC free article] [PubMed] [Google Scholar]
- Young LR, Nestle M. Portion sizes and obesity: Responses of fast-food companies. Journal of Public Health Policy. 2007;28(2):238–248. doi: 10.1057/palgrave.jphp.3200127. [DOI] [PubMed] [Google Scholar]
- Zenk SN, Schulz AJ, Israel BA, James SA, Bao S, Wilson ML. Fruit and vegetable access differs by community racial composition and socioeconomic position in Detroit, Michigan. Ethnicity & Disease. 2006;16(1):275–280. [PubMed] [Google Scholar]
- Zoumas-Morse C, Rock CL, Sobo EJ, Neuhouser ML. Children’s patterns of macronutrient intake and associations with restaurant and home eating. Journal of the American Dietetic Association. 2001;101(8):923–925. doi: 10.1016/S0002-8223(01)00228-0. [DOI] [PubMed] [Google Scholar]