

Abstract
How the autonomic nervous system influences the fractal dynamics of heart rate (HR) and blood pressure (BP) remains unclear. The purpose of our study was to separately assess cardiac vagal and sympathetic (cardiac vs. vascular) influences on fractal properties of HR and BP as described by scale exponents of detrended fluctuation analysis (DFA). R–R intervals, systolic and diastolic BP were measured in nine supine volunteers before and after administration of autonomic blocking agents (atropine, propranolol, atropine + propranolol, clonidine). Spectra of DFA scale exponents, α(t), were calculated for scales between 5 and 100 s. HR and BP scale structures differed at baseline, being α(t) of HR <1, with a minimum between 10 and 20 s followed by a higher plateau between 40 to 80 s, while α(t) of BP decreased with t from values >1. Comparison of atropine and propranolol with baseline and combined cardiac parasympathetic and sympathetic blockade (atropine + propranolol) indicated opposite influences of vagal and cardiac sympathetic outflows on HR exponents. The vagal outflow adds white-noise components, amplifying differences with BP exponents; the cardiac sympathetic outflow adds Brownian motion components at short scales and contributes to the plateau between 40 and 80 s. Overall sympathetic inhibition by clonidine decreased short- and long-term exponents of HR, and short-term exponents of BP, so that their α(t) spectra had different means but similar profiles. Therefore, cardiac vagal, cardiac sympathetic and vascular sympathetic outflows contribute differently to HR and BP fractal structures. Results are explained by different distribution and dynamics of acetylcholine receptors and of α- and β-adrenergic receptors between heart and vasculature.
Non-technical summary
It is still unknown how the autonomic nervous system influences the fractal dynamics of cardiovascular signals. We show that in supine volunteers vagal and sympathetic outflows contribute differently to the fractal structures of heart rate and blood pressure. The vagal outflow contributes with a ‘white-noise’ component to the heart rate dynamics, indirectly influencing also the fractal dynamics of blood pressure. The sympathetic outflow contributes with a Brownian motion component to the heart rate dynamics, increasing long-term fractal coefficients, without affecting long-term coefficients of blood pressure. Results are explained by the different distribution and dynamics of acetylcholine receptors and of α- and β-adrenergic receptors. Our findings may allow better delineating alterations of cardiovascular fractal dynamics in physiological and pathophysiological settings.
Introduction
A number of studies focused on complexity-based methods for describing features of heart rate (HR) variability not quantifiable by traditional spectral analysis. Among these features, a property of ‘fractal’ time series, called self-similarity, raised interest. Like a geometric fractal, in which small fragments are similar to the whole object, a time series is self-similar if it can be split into smaller pieces that show fluctuations statistically similar to the original, when properly rescaled. The assessment of self-similarity appeared as a promising tool for studying the HR dynamics because fractal-like anatomical structures in the heart and vasculature (West et al. 1997), integration of local and global regulatory mechanisms and interactions among vascular beds, suggest that the HR may reflect self-similar processes (Goldberger, 1996), operating over different scales of time.
The characteristics of HR self-similarity are usually studied by applying the detrended fluctuation analysis (DFA) method (Goldberger et al. 2000). DFA describes the self-similarity of most theoretical fractal signals in a very concise way. In fact, it provides a single scale exponent, α, which fully characterizes the degree of correlation among time scales (Eke et al. 2002). Applying DFA on real HR data, however, it appeared that a single α exponent cannot fully describe the HR dynamics (Peng et al. 1995). On the contrary, evidence has been provided that the HR may belong to the class of multifractal signals, a family of processes which require more than one exponent to characterize their scaling properties (Ivanov et al. 1999). Furthermore, a recent study highlighted that a single exponent is inadequate to describe the HR dynamics, showing that α provided by DFA is poorly reproducible and does not reliably reflect the autonomic influences on HR (Tan et al. 2009). Therefore it has been proposed to estimate a short- and a long-term exponent, called α1 and α2, to better describe the HR dynamics. In this way, the ‘self-similarity’ of HR is assumed to have different characteristics if analysed over short (about less than 12 beats) or long time scales (Peng et al. 1995). This ‘two-coefficient’ model is now used in most studies of HR variability. Recently, however, also the ‘two-coefficient’ model has been viewed as an oversimplification of a more complex phenomenon. This led different authors to independently propose methods based on DFA for estimating a continuous spectrum of scale exponents (Viswanathan et al. 1997; Echeverria et al. 2003; Bojorges-Valdez et al. 2007; Castiglioni et al. 2009). Unlike the ‘single-’ or ‘two-’ coefficient models, this more recent DFA approach does not assume a mono-fractal or bi-fractal nature for the data. Actually it provides a fractal description which may change continuously with the time scale. Therefore, a spectrum of scale exponents may represent a more appropriate tool for describing the multi-scale structure of cardiovascular signals, and for investigating its physiological determinants.
In particular, a spectrum of DFA scale exponents could be usefully employed to delineate the influences of autonomic outflows to the heart and vasculature on the complex dynamics of HR and blood pressure (BP). In this regard, it has been shown that fluctuations in the burst rate of human muscle sympathetic nerve activity present a fractal nature (Fadel et al. 2004). If we assume similar dynamics in the cardiac sympathetic outflow, we might hypothesize a direct sympathetic influence on the pattern of DFA scale exponents of HR. However, it is still unclear whether the sympathetic outflow contributes to the scale exponents of HR and BP. Moreover, the role of the vagal outflow is also unknown. Therefore, this study addresses the following questions: do sympathetic and vagal outflows contribute to the complex pattern of HR scale exponents? Do they also influence BP scale exponents? Do cardiac and vascular sympathetic outflows provide different contributions to the fractal dynamics of HR and BP? Selective autonomic blockade may answer these questions, allowing us to interpret DFA results better. Therefore, in this study we separately assess the effects of high dose atropine, propranolol and clonidine, on the whole spectrum of HR and BP scale exponents, as provided by DFA, in healthy supine volunteers at rest.
Methods
Subjects and protocol
The study was approved by the ethics committee of the Hospices Civils de Lyon. Data collection was described previously (Parlow et al. 1995). Briefly, nine healthy male physicians aged from 25 to 46 years, familiar with the study setting, participated in the study, after signing informed consent. None had any abnormal finding on history, physical examination or electrocardiography, or was receiving any medication. All had normal resting brachial arterial pressure measured by sphygmomanometer, with no significant difference between the two arms or significant orthostatic drop. They were instructed to avoid tobacco, alcohol and caffeine for 12 h and strenuous exercise for 24 h before each experiment.
Experimental sessions were performed in 3 days at approximately 2 week intervals. One volunteer took part only in the first day experiments. Subjects remained at rest in a supine position in a dimly lit room during all the recordings. Each experiment consisted of 15–20 min of baseline recording followed by 15–20 min of recording after drug administration. On day 1, recordings were obtained at baseline (B1) and after parasympathetic blockade with 40 μg kg−1i.v. atropine sulfate (Atropine) to block the parasympathetic system; on day 2, at baseline (B2), and after β-adrenergic blockade with 200 μg kg−1i.v. propranolol (Propranolol) to block cardiac β1 and vascular β2 peripheral adrenergic receptors. Propranolol was also used at the end of the Atropine condition on day 1: in fact, an additional recording was performed after beta-blockade with 200 μg kg−1i.v. propranolol and a reinforcing dose of atropine sulfate (10 μg kg−1) to obtain combined cardiac parasympathetic and sympathetic blockade (Atropine + Propranolol). Baseline is the reference condition with intact autonomic outflows. Combined cardiac autonomic blockade is the reference condition with suppressed cardiac autonomic outflow. On day 3, recordings were obtained at baseline (B3) and 120 min after 6 μg kg−1per os clonidine hydrochloride (Clondine) orally to centrally block the sympathetic outflow to heart and vasculature and to centrally increase the cardiac parasympathetic activity (Toader et al. 2008).
Data collection and power spectrum
Electrocardiogram (ECG) and finger BP at the heart level (Finapres 2300, Ohmeda) were recorded during the experiments. Ectopic beats were identified on the ECG and removed from ECG and BP. R–R interval, systolic blood pressure (SBP), mean arterial pressure (MAP) and diastolic blood pressure (DBP) were derived beat by beat from ECG and finger BP. Means and standard deviations (s.d.) were calculated in each condition. A respiratory signal was derived from the ECG (Moody et al. 1986); the breathing rate was estimated as the central frequency of the respiratory spectrum between 0.08 and 0.50 Hz. Power spectra of R–R interval, SBP and DBP beat-to-beat series were assessed as in Di Rienzo et al. (1996). Briefly, beat-to-beat series were interpolated evenly at 10 Hz, and split into 90%-overlapped, 300-s-long Hann data windows. Power spectra were calculated in each window by fast Fourier transform, smoothed by a wide-band approach, and averaged. The resulting periodogram was integrated over very low (VLF: 0.025–0.05 Hz), low (LF: 0.05–0.15 Hz) and high (HF: 0.15–0.40 Hz) frequency bands. The ratio between LF and HF powers of R–R interval spectra, the LF/HF power ratio, was computed as an index of sympatho-vagal balance (Task Force of the European Society of Cardiology and the North American Society of Pacing and Electrophysiology, 1996).
Scale-exponent spectrum
A time series x(t) is self-affine if it has the same statistical properties of a−Hx(at) for any a > 0. The coefficient H, called the Hurst exponent, defines the vertical rescaling factor, 1/aH, which should be applied to preserve the statistical properties of x(t) if the time axis has been rescaled by a. The H exponent may range between 0 and 1, and when H = 1 the series is defined self-similar. However, the literature on HR variability conventionally uses the term self-similarity even if H differs from 1 (Goldberger, 1996), and we follow this convention. Evaluating the self-similarity of a time series means to identify whether it can be modelled as a non-stationary fractional Brownian motion or as stationary fractional Gaussian noise (Eke et al. 2000), and to estimate H. This was done by DFA (Peng et al. 1995) because this method can be directly applied without knowing in advance whether the series should be modelled as Gaussian noise or Brownian motion. In fact DFA estimates a coefficient, α, equal to H for fractional Gaussian noise, and to H + 1 for fractional Brownian motion (Eke et al. 2002). This is useful because the HR self-similar dynamics may range between white noise (fractal process with α = 0.5) and Brownian motion (integral of white noise, with α = 1.5). A relation holds between α and another fractal index used in HRV studies, the spectral slope of coarse-graining analysis βCG (Eke et al. 2002): α = (βCG + 1)/2.
DFA was applied over the whole beat-to-beat series of each experimental condition. Briefly, the integral of the series, y(k), was computed after mean subtraction, and split into boxes of length n beats. A least-square trend line yn(k) was fitted in each box. The function
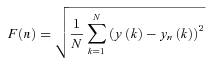 |
(1) |
was calculated for box sizes n ≥ 4 beats on a subset nk (k = 1, … , 26) spaced evenly on a log scale between n1 = 4 and n26 = 304 (Goldberger et al. 2000). For monofractal processes, F(n) increases proportionally to nα and α is estimated as the slope of the regression line between log F(n) and log n. In this study we obtained a spectrum of exponents, αB(n), defined over the ‘beat domain’ n, as the derivative of log F(n) with respect to log n (Castiglioni et al. 2009):
| (2) |
The αB(n) spectrum was calculated for the R–R interval, SBP, MAP and DBP, covering the range between n2 = 5 and n25 = 256 beats. To compare our data with the literature (Peng et al. 1995; Goldberger et al. 2000; Huikuri et al. 2000; Beckers et al. 2006a), short- and long-term exponents, α1 and α2, were also calculated as slopes of regression lines between log F(n) and log n separately over n ≤ 11 and n > 11.
The time duration of each block of n beats depends on the mean R–R interval, and increases with it. This means that if two series are sampled at different heart rates, then exponents calculated at the same beat scale ‘n’ actually represent different time scales ‘t’. This problem may be particularly important when comparing conditions which induce large and opposite effects on heart rate, such as Atropine and Propranolol. It is not unlikely that heart rates around 110 beats min−1 in Atropine may decrease up to 45 beats min−1 in Propranolol. In such cases, if we compare the DFA exponents corresponding to the beat scale n = 40 beats, we are actually comparing Atropine at a temporal scale around 20 s with Propranolol at a temporal scale around 1 min. Therefore, we converted the αB(n) spectrum from the beat domain ‘n’ to the time domain ‘t’ in order to compare scale exponents on the same time scale. This was done by defining a spectrum of scale exponents α(t) as:
| (3) |
with  the mean R–R interval of the series. Finally, α(tn) values were linearly interpolated to obtain a continuous function of time, and re-sampled over 25 points ti exponentially distributed between t1 = 5 s and t25 = 100 s. It has been shown (Castiglioni et al. 2009) that αB(n) can be estimated without substantial estimation bias up to scales n equal to one seventh the record length. This assures an unbiased estimation of α(tn) up to the larger time scale considered in this study (100 s) given the length of each experimental condition (15–20 min). The whole procedure is illustrated in Fig. 1.
Figure 1. Estimation of a spectrum of scale exponents, α(t).
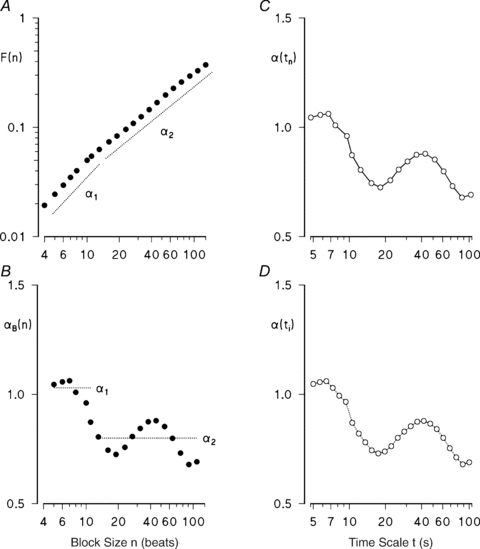
A shows the amplitude of detrended fluctuations, F(n), calculated for a series of R–R intervals, vs. the block size n (in beats), on a log–log scale. The panel also shows short- and long-term exponents, α1 and α2: these coefficients are traditionally estimated as the slopes of regression lines between log F(n) and log n calculated over n ≤ 11 and n > 11. B shows the spectrum of scale exponents, αB(n), calculated in the ‘beat-domain’ as the derivative of log F(n) vs. log n; α1 and α2 are reported as reference. A minimum around n = 20 and a maximum around n = 50 beats are clearly visible in αB(n); these features are almost undetectable in F(n). C shows the spectrum of scale exponents in the ‘time domain’, α(tn), derived from αB(n) by substituting the beat index n with the time instant  , where
  is the mean R–R interval; these values are linearly interpolated (continuous line). D shows α(t) re-sampled over 25 times ti exponentially distributed between t1 = 5 s and t25 = 100 s.
Statistical analysis
Similarity of baseline conditions of the first, second and third experimental days (B1, B2 and B3) was preliminarily verified by assessing the significance of the factor ‘day’ in repeated measures with the Friedman's test, separately on α1 and α2, for R–R interval, SBP and DBP. Significances of the six tests ranged between P = 0.14 (worst case) and P = 0.60, confirming that the baseline recordings, B1, B2 and B3, are substantially similar.
To describe the shape of DFA exponents in baseline, scale-exponent spectra calculated in B1, B2 and B3 were averaged for each subject. To avoid assumptions on the statistical distribution of scale exponents, the Sign test (Krauth, 1988) was applied to compare α(ti) values during autonomic blockade with values during the corresponding baseline conditions. For R–R interval, we also similarly compared Atropine or Propranolol with the second reference condition, Atropine + Propranolol. In this case, first, we applied the Friedman's test to assess the significance of differences among the three conditions. When the repeated-measures factor was significant, post hoc analysis was performed by the Sign test with Holm's procedure to correct the significance threshold for multiple comparisons (Holm, 1979). Medians and s.e. of the median were calculated with the ‘R’ implementation (The R Foundation for Statistical Computing, Vienna, Austria) of the McKean and Schrader estimator (Wilcox, 2005).
To simplify the presentation of results, effects of autonomic blockade on all the other variables (means, s.d.s, spectral powers and respiratory frequency) were presented and statistically tested in the same way. The statistical significance was set at P < 0.05.
Results
Figure 2 illustrates changes in time courses and in scale-exponent spectra of R–R interval and SBP, occurring in one subject. Interestingly, atropine produces similar changes on the scaling structures of R–R interval and SBP, raising short-scale coefficients to the level of Brownian motion, even if the effects on the amplitude of fluctuations are dramatically different, decreasing the HR variability and increasing the BP variability importantly.
Figure 2. R–R interval and systolic blood pressure (SBP) recordings, and their scale exponents spectra α(t) for the same subject in baseline of day 1, during parasympathetic blockade (Atropine), β-adrenergic blockade (Propranolol) and α-2 adrenergic stimulation (Clondine).
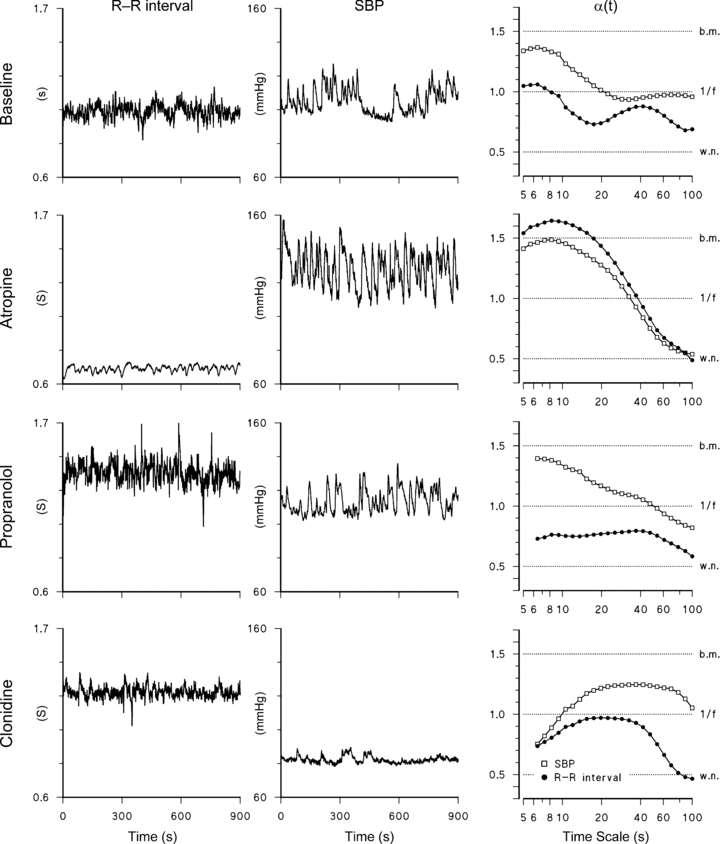
Dotted horizontal lines indicate theoretical α levels for white noise (w.n.), ‘1/f’ noise and Brownian motion (b.m.). Note the huge increase in blood pressure variability and decrease in heart rate variability following atropine, and the decrease in blood pressure variability following clonidine; α(t) is plotted only at scales t > 6 s in propranolol and clonidine conditions because of the low HR.
Baseline
Results over the group are shown in Fig. 3 as median and s.e. of the median. Scale-exponent spectra of the R–R interval and BP show markedly different patterns in baseline. The R–R interval scale exponents are always lower than 0.9, with a minimum between 10 and 20 s followed by a broad maximum between 40 and 80 s. By contrast, SBP exponents decrease monotonically with log t from 1.3 at t = 5 s to 0.8 at t = 100 s. DBP scale exponents decrease with a trend similar to SBP.
Figure 3. Spectra of DFA scale exponents upon baseline (average of B1, B2 and B3).
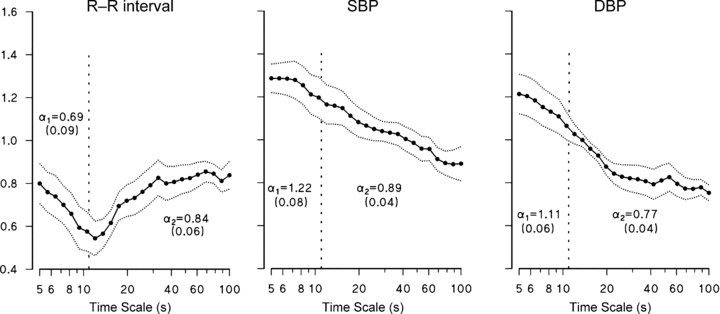
Median ± standard error of the median over the group; as a reference, ranges employed in most studies for the estimation of short- and long-term exponents, α1 and α2, and their values as median (s.e. of median) are also shown.
Atropine
Atropine increases HR and BP significantly (Table 1), and tends to increase the respiratory rate but without reaching statistical significance (P = 0.06). It affects HR variability (decreasing s.d. and spectral powers) but not BP variability. Atropine dramatically increases the DFA spectrum of R–R interval, which reaches the highest values for time scales shorter than 20 s (Fig. 4A). Changes are significant up to t = 37 s. This large increase completely removes the minimum between 10 and 20 s. Atropine also increases significantly the DFA spectrum of SBP and DBP for time scales between 7 and 30 s (Fig. 4B and C).
Table 1.
Indexes of heart rate and blood pressure variability, and respiratory rate, in baseline (average of B1, B2 and B3) and in each autonomic blockade: values as median ( s.e. of the median) over the group
| Baseline | Atropine | Propranolol | Clonidine | |
|---|---|---|---|---|
| R–R interval | ||||
| Mean (ms) | 1029 (61) | 631 (36) ** | 1234 (86) ** | 1339 (122) * |
| s.d. (ms) | 50 (13) | 15 (3) ** | 62 (35) | 69 (27) |
| VLF (ms2) | 912 (261) | 58 (57) ** | 1149 (515) | 853 (341) |
| LF (ms2) | 935 (825) | 7 (9) ** | 1259 (1701) | 482 (524) |
| HF (ms2) | 434 (586) | 1 (8) ** | 1074 (3941) | 1367 (1900) |
| LF/HF | 1.3 (0.7) | 9.6 (5.6) | 1.4 (0.7) | 0.6 (0.2) * |
| SBP | ||||
| Mean (mmHg) | 114 (5) | 134 (7) * | 118 (3) | 93 (5) ** |
| s.d. (mmHg) | 7.4 (0.7) | 7.7 (0.9) | 6.6 (1.8) | 3.6 (0.5) ** |
| VLF (mmHg2) | 30.6 (8.5) | 29.5 (13.9) | 29.5 (13.4) | 4.5 (1.5) ** |
| LF (mmHg2) | 9.3 (1.7) | 7.1 (3.5) | 7.6 (2.8) | 1.2 (0.3) ** |
| HF (mmHg2) | 1.1 (0.2) | 0.7 (1.4) | 0.7 (0.3) * | 0.8 (0.8) |
| DBP | ||||
| Mean (mmHg) | 57 (5) | 76 (4) * | 62 (3) ** | 54 (7) |
| s.d. (mmHg) | 3.3 (0.6) | 3.9 (0.7) | 3.4 (0.8) | 2.0 (0.5) |
| VLF (mmHg2) | 5.0 (1.7) | 6.7 (2.5) | 5.1 (2.6) | 1.5 (0.8) * |
| LF (mmHg2) | 2.9 (0.7) | 2.0 (1.0) | 2.6 (1.0) | 0.5 (0.2) ** |
| HF (mmHg2) | 0.4 (0.3) | 0.2 (0.2) | 0.4 (0.7) | 0.5 (0.2) |
| Respiration | ||||
| Breathing rate (breaths min−1) | 12.5 (1.5) | 14.2 (1.4) | 10.0 (1.1) | 12.6 (1.2) |
The * and ** indicate significant differences at the 0.05 and 0.01 levels between each autonomic blockade and the corresponding baseline (B1, B2 or B3) as obtained by the Sign test. See Methods for abbreviations.
Figure 4. Effects of atropine, propranolol and clonidine on DFA scale exponents.
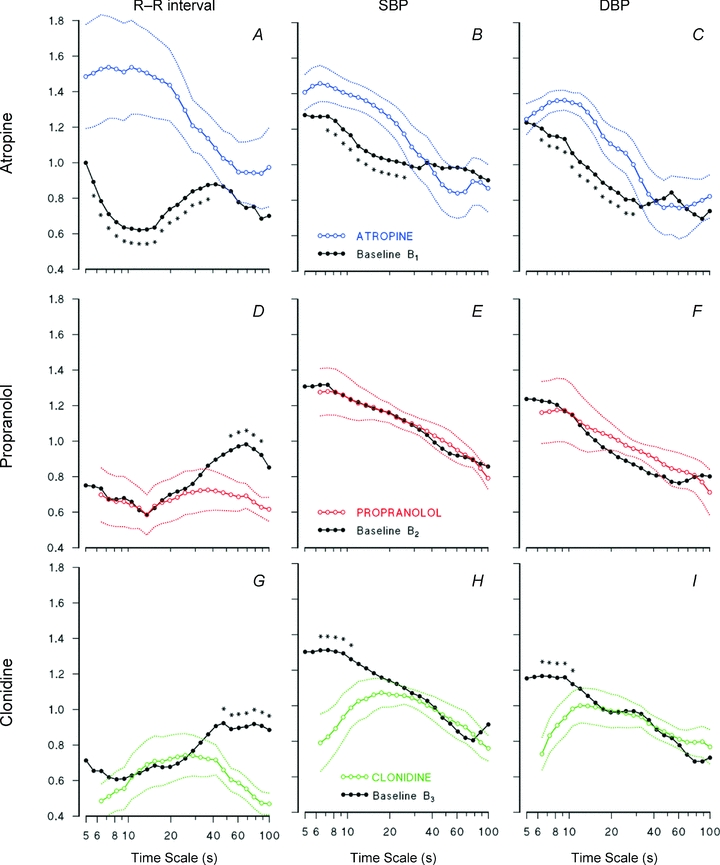
R–R interval, SBP and DBP in: Atropine condition vs. baseline of day 1 (A–C); Propranolol condition vs. baseline of day 2 (D–F); Clondine condition vs. baseline of day 3 (G–I). Continuous lines: medians over the group; dotted lines: ranges ± s.e. of the median. Asterisks indicate significant differences (P < 0.05). Please note that major effects on R–R interval occur around the minimum (between 10 and 20 s) for vagal blockade, and around the maximum (between 40 and 80 s) for sympathetic blockade.
Propranolol
Propranolol induces bradycardia without changing indexes of HR variability (Table 1). It decreases scale exponents of R–R interval between 40 and 80 s (Fig. 4D), without affecting BP exponents (Fig. 4E and F).
Clonidine
Clonidine induces bradycardia and decreases the LF/HF powers’ ratio of HR (Table 1). Moreover, it affects importantly BP variability, consistently reducing mean, standard deviation, VLF and LF powers of SBP, and LF power of DBP (Table 1). Clonidine, like propranolol, decreases significantly the scale-exponents of R–R interval at the largest time scales, between 40 and 80 s (Fig. 4G). Differently to propranolol, however, clonidine also tends to decrease R–R interval exponents at the shorter time scales. Clonidine also influences scale exponents of BP significantly, decreasing short-term coefficients up to 10 s.
Table 2 reports values and statistics of short- and long-term scale exponents in baseline and for each autonomic blockade for comparison with the traditional approach, which assumes the validity of the two-coefficient model. Important details are lost if the scale structure is described by two coefficients only. For instance, atropine raises significantly both α1 and α2 coefficients of R–R interval, but only scales shorter than 37 s actually increase. Moreover, one might conclude that atropine has a rather different effect on the BP scale structure, because it only significantly increases α1. Actually, however, atropine affects BP and R–R interval almost over the same temporal scales (Fig. 4A–C). Finally, the two-coefficient model is unable to reveal that scale exponents of R–R interval with temporal scales around 60 s are reduced similarly by propranolol and clonidine.
Table 2.
Short- and long-term scale exponents α1 and α2 in baseline (average of B1, B2 and B3) and in each autonomic blockade: values as median ( s.e. of the median) over the group
| Baseline | Atropine | Propranolol | Clonidine | |
|---|---|---|---|---|
| R–R interval | ||||
| α1 | 0.69 (0.08) | 1.45 (0.25) * | 0.64 (0.13) | 0.66 (0.11) |
| α2 | 0.84 (0.06) | 1.02 (0.16) * | 0.68 (0.07) | 0.52 (0.07) * |
| SBP | ||||
| α1 | 1.22 (0.08) | 1.41 (0.08) * | 1.24 (0.1) | 0.99 (0.12) * |
| α2 | 0.89 (0.05) | 1.00 (0.12) | 0.83 (0.06) | 0.85 (0.07) |
| DBP | ||||
| α1 | 1.11 (0.06) | 1.25 (0.05) * | 1.13 (0.14) | 0.91 (0.08) * |
| α2 | 0.77 (0.04) | 0.87 (0.11) | 0.73 (0.09) | 0.86 (0.08) |
The * indicates significant difference at the 0.05 level (Sign test) between autonomic blockade and baseline (B1, B2 or B3).
Combined blockade
In the Atropine + Propranolol condition (Fig. 5, left), the spectrum of R–R interval scale exponents reaches the highest values between 7 and 20 s. It is lower than in Atropine, when only the cardiac sympathetic outflow is present, but greater than in Propranolol, when only the vagal outflow is present. No significant differences were found in the spectra of BP scale exponents when the Atropine + Propranolol condition was compared with Atropine or Propranolol (Fig. 5, centre and left).
Figure 5. Blockade by atropine and by propranolol compared to combined blockade: median values over the group of scale exponents spectra.
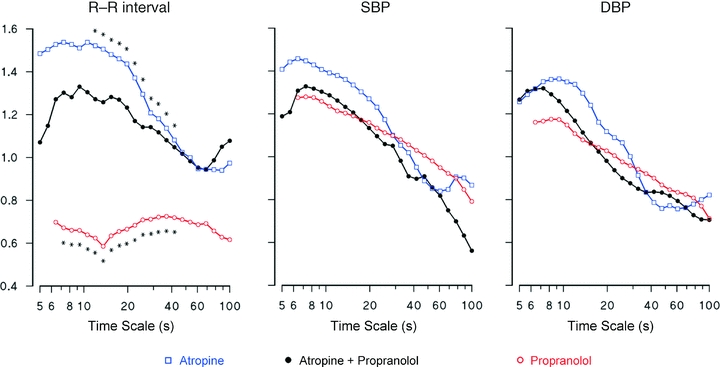
Asterisks show differences with combined blockade (P < 0.05).
Discussion
This study delineates the autonomic influences on the spectrum of scale exponents of cardiovascular beat-to-beat series, in healthy supine volunteers at rest. Its uniqueness consists in three distinctive elements. First, the analysis included both HR and BP, revealing differences in their scale structures. Second, three pharmacological agents separated the effects of cardiac sympathetic, vagal and combined cardiac autonomic blockade, and the effects of a central block of the overall (vascular and cardiac) sympathetic outflow. Third, the estimation of a spectrum of scale exponents avoided limits of the ‘two-coefficient’ model. Actually, the effects of autonomic blockade on DFA have been addressed only partially in the past, in human studies considering HR only, and assuming the validity of the ‘two-coefficient’ model even during the autonomic blockade.
Atropine
Effects of vagal blockade were previously studied on short- and long-term coefficients in the rat model (Beckers et al. 2006b), and only on α1 of HR in humans (Tulppo et al. 2001b). We found that blockade of muscarinic acetylcholine receptors with atropine altered the spectrum of HR scale exponents almost entirely (Fig. 4A). This result provides further support to the claim that in supine subjects the vagal outflow affects more components of HR variability than the respiratory sinus arrhythmia only (Pomeranz et al. 1985). Vagal blockade had its maximal influence between 10 and 20 s, where it increased the coefficients from white-noise (α = 0.5) to Brownian-motion levels (α = 1.5). Therefore, the large increase in α1 previously reported after passive head-up tilt or after low-intensity exercise (Tulppo et al. 2001a) can be completely explained in terms of cardiac vagal deactivation. Our results extend the observation that high dose atropine increases α1 (Tulppo et al. 2001b) indicating that Atropine increases a much larger range of time scales.
Coarse-graining analysis previously showed that in supine volunteers atropine increased the spectral slope βCG of HR up to 1.85 (Yamamoto et al. 1995). This value corresponds to a monofractal α = 1.43 (see the relation between α and βCG in Methods). Interestingly, after atropine our scale exponents agree with this high value (Fig. 4A).
Vagal outflow also influences the scale exponents of BP (Fig. 4B and C). This is unexpected, because atropine does not change BP spectral powers. Thus, our results indicate that when the vagal tone is high (supine rest), the vagal outflow can influence the short-term scale exponents of BP, even if it is unable to alter the BP spectral powers significantly. To understand how this is possible, we should consider that two physiological mechanisms are assumed to influence the fast BP dynamics, and that the effects on BP variability of these mechanisms are quantified differently by spectral analysis and DFA. One of these mechanisms is respiration. Breathing movements mechanically induce a respiratory oscillation in BP. Atropine, which eliminates the respiratory sinus arrhythmia almost completely, is not expected to affect respiration importantly, as previously suggested (Koller et al. 1988). Although we did not directly measure parameters related to the depth of respiration, breathing rate (see Table 1) and amplitude of the ECG-derived respiratory signal (0.68 ± 0.65 in baseline vs. 0.58 ± 0.68 in Atropine, P = 0.50 Sign test) did not change significantly in Atropine, supporting this hypothesis. Thus, atropine is also not expected to greatly affect the mechanically generated respiratory oscillation of BP. The power spectrum is much more sensitive than DFA to pure harmonic components, like a regular respiratory fluctuation. Since the respiratory peak is the component with higher power in the HF band, and atropine does not influence respiration importantly, atropine does not change the HF power of BP significantly. The second mechanism is the direct mechanical link between fast HR variations and BP. Lengthening or shortening of R–R interval may change the DBP value within the same beat because of the exponential diastolic decay associated with the windkessel mechanism. They may change the following SBP value because the diastolic filling period of atria also changes. This mechanism may allow short-term fractal components of HR dynamics to influence the BP scaling structure at the same time scales (as observed in Fig. 4A–C). Therefore it is possible that the vagal outflow not only influences the DFA exponents of HR directly, but also the BP scaling structure indirectly through this mechanical HR–BP link. By contrast, in the BP power spectrum, a vagally induced fractal component may be masked by a much larger respiratory oscillation.
At short time scales, differences between scale structures of HR and BP vanished with atropine. To clearly illustrate this points, the α(t) functions previously shown in Fig. 3 are redrawn in Fig. 6, this time overlapping the HR and BP scale structures in the same panels (for conciseness, the figure represents the BP fractal structure by using MAP only instead of SBP and DBP separately). In fact, HR variability depends on both vagal and sympathetic activities on the sinus node, while BP variability reflects mainly the sympathetic outflow on the vessels through changes in vascular tone. Therefore, we may expect that scale exponents of HR and BP differ importantly in baseline, given the high vagal tone and the low sympathetic tone upon supine rest. Atropine may remove most of the differences between HR and BP scale structures because it removes the vagal outflow from HR.
Figure 6. Comparison between scale-exponent spectra of mean arterial pressure, MAP (open square) and R–R interval (filled circle) in Baseline (average of B1, B2 and B3 conditions), parasympathetic blockade (Atropine), β-adrenergic blockade (Propranolol) and α2-adrenergic stimulation (Clondine).
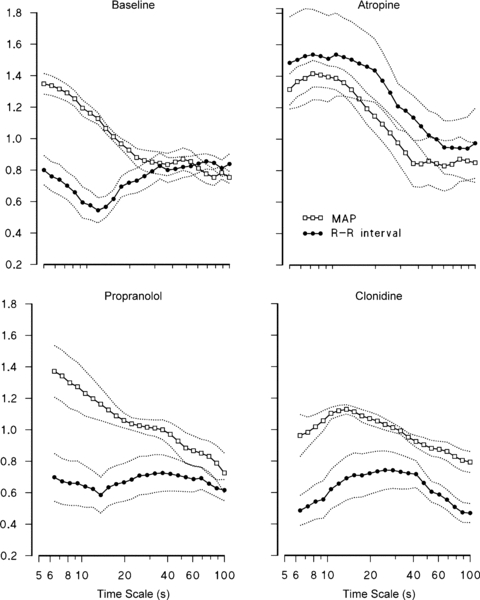
Medians with s.e. of medians over the group.
If compared with the combined blockade (similar to the heart denervation), Atropine shows the effects of adding the cardiac sympathetic outflow on the intrinsic HR dynamics. This comparison indicates that the sympathetic outflow contributes with a Brownian motion component because α(t) is closer to 1.5 in Atropine than in the Atropine + Propranolol condition (Fig. 5, left panel). It also suggests that the high value of scale exponents for time scales between 7 and 20 s is not exclusively due to the sympathetic outflow, appearing as an intrinsic feature of the ‘denervated heart’ dynamics.
Propranolol
The cardiac sympathetic outflow is removed by propranolol, which blocks primarily β1 receptors on the heart and β2 receptors on the vessels. Since α-adrenergic receptors are present, the sympathetic system still exerts its action on the vasculature. This justifies why propranolol changed the scale exponents of R–R interval only (Fig. 4D–F). In particular, propranolol decreased the plateau at scales between 40 and 80 s, which therefore seems to depend on the cardiac sympathetic activity. Removing the cardiac sympathetic outflow, without affecting the vascular sympathetic activity, eliminates the sympathetic component that BP and HR have in common. This would explain why propranolol extends the difference between the scale-exponent spectra of R–R interval and BP over the whole range of time scales considered (see also Fig. 6).
A previous study showed a slight, not statistically significant, decrease of the coarse-graining fractal index of HR, βCG, after propranolol (Yamamoto & Hughson, 1994). This agrees with the local decrease of α(t) for t > 40 s (Fig. 4D). Our study recognized a significant effect because, at difference with βCG, α(t) can show changes concentrated over specific time scales.
Comparison between Propranolol and combined blockade (Fig. 5, left panel) shows that the vagal outflow contributes to the DFA spectrum of HR with a ‘white-noise’ component which completely hides the intrinsic cardiac dynamics. This contribution is quite different from the ‘Brownian motion’ contribution of the sympathetic outflow. A possible explanation is given by results obtained stimulating the vagus nerve and the right stellate ganglion in dogs with trains of pulses (Berger et al. 1989). This technique showed differences between the transfer function from vagal outflow to HR and the transfer function from sympathetic outflow to HR. The transfer function from vagal outflow to HR is almost flat at high stimulation rates, indicating that a ‘white’ vagal outflow contributes to the HR dynamics with a ‘white-noise’ component. By contrast, the transfer function between cardiac sympathetic outflow and HR has been described as a one-pole low-pass filter with cut-off frequency around 0.015 Hz, i.e. 66 s (Malpas, 2002). This means that if the sympathetic outflow would be ‘white’, its contribution to HR dynamics would be a filtered ‘white noise’. The cut-off frequency of the low-pass filter has been associated with the dynamics of removal from cardiac tissues of noradrenaline released by the sympathetic nerve endings. The dynamics of noradrenaline removal is much slower than the dissipation rate of acetylcholine released by the vagal terminals (Levy et al. 1993). Interestingly, in terms of Laplace transform, the transfer function of a one-pole low-pass filter with cut-off frequency fCO is proportional to 1/(s + fCO). At frequencies much higher than fCO (i.e. when s ≫ fCO), this transfer function becomes proportional to 1/s, which is the Laplace transform of an integration block (Oppenheim et al. 1997). This means that because of the slow noradrenaline dissipation rate, or more generally because of the sluggishness of the adrenergic signal transduction system, the contribution of ‘white’ sympathetic outflow could be approximated by integrated ‘white noise’, i.e. Brownian motion, at time scales much shorter than t = 66 s. Figure 5 (left panel) supports this explanation showing significant Brownian motion contributions at scales shorter than 40 s.
At scales longer than 40 s, Atropine and combined blockade have similar HR coefficients. In particular, the coefficient is the same (α = 0.95) at t = 60 s. In Atropine, the HR dynamics are composed of the effects of sympathetic outflow mixed with the intrinsic cardiac variability. Since Atropine has the same scale coefficient of the intrinsic cardiac dynamics (Atropine + Propranolol), we may conclude that the contribution of the sympathetic outflow alone should be also equal to 0.95 at this time scale. The contribution of the vagal outflow is substantially lower. In fact, the scale coefficient at t = 60 s is 0.69 in Propranolol. The effects of vagal outflow are combined with the intrinsic HR variability in Propranolol. Thus, the pure contribution of the vagal outflow may be even lower than 0.69 because the intrinsic cardiac dynamics have a higher coefficient. Also the difference between the contributions of cardiac sympathetic (α = 0.95) and vagal (α < 0.69) outflows at t = 60 s could be explained by the low-pass filter characterizing the transfer function from sympathetic outflow to HR. At this time scale the filter cannot be approximated by a ‘1/s’ integration block (which would have increased α by one, as in the case of white noise and Brownian motion). However, the filter may still be responsible for a fractional integration (Kleinz & Osler, 2000) increasing α by a fraction of one only.
The filter may also explain why, with respect to baseline, Propranolol decreased HR scale coefficients at scales greater than 40 s only (Fig. 4D). In baseline, α(t) reflects the combined effects of cardiac sympathetic outflow, cardiac vagal outflow and intrinsic HR variability. For instance, the baseline value at t = 60 s is α = 0.84, a value which may result from the superimposition of the effects of cardiac sympathetic outflow (α = 0.95) with the effects of vagal outflow mixed to the intrinsic HR dynamics (α = 0.69). This means that reductions of sympathetic outflow should result in reductions of α(t). However, as the frequency increases, the low-pass filter may decrease the relative weight of the sympathetic outflow with respect to the vagal outflow in the baseline HR variability. This would imply that removal of cardiac sympathetic outflow by propranolol has progressively lower effects on HR scale coefficients going towards the shorter scales. This appears clearly in Fig. 4D. In particular, the effects of the sympathetic outflow on HR scale coefficients seem negligible with respect to the effects of vagal outflow at scales shorter than 25 s. In this range, scale coefficients of baseline and Propranolol are practically superimposable.
Clonidine
Clonidine resets the sympathetic vascular activity to a lower set-point, and decreases the cardiac sympathetic activity. The decreased sympathetic activity is associated with a reduction of long-term scale exponent of R–R interval, as observed also after propranolol (compare panels D and G in Fig. 4). The physiological mechanisms responsible for this phenomenon may be the same as we have suggested for explaining the effects of propranolol on HR scale coefficients. In particular, the low-pass filter in the transfer function between cardiac sympathetic outflow and HR may explain why the effects of removing the cardiac sympathetic outflow at scales shorter than 25 s are negligible.
Clonidine also increases the cardiac vagal activity (Toader et al. 2008). This may have contributed to lowering LF/HF powers’ ratio (Table 1). The increase in cardiac vagal activity may have also caused the ‘deflection’ of HR coefficients at scales shorter than 10 s (Fig. 4G). In fact, vagal blockade by atropine (Fig. 4A) and vagal tone reduction after change of posture or exercise (Tulppo et al. 2001a; Castiglioni et al. 2009) had the opposite effects, increasing short-term coefficients.
Previous studies showed that clonidine increased the baroreflex sensitivity on the heart (cardiac baroreflex) in this group of volunteers (Parlow et al. 1995), and prevented the post-operative reduction of cardiac baroreflex in hypertensive patients (Parlow et al. 1999). Clonidine enhances the baroreflex control of HR probably thanks to the increased cardiac parasympathetic activity combined with sympathetic inhibition. The hypothesis of a lowered vascular sympathetic activity is in line with the observed reduction of LF power of BP (Table 1). In BP, this spectral component mainly reflects the sympathetic regulation of peripheral resistances through the sympathetic vasomotor baroreflex (Japundzic et al. 1990; Di Rienzo et al. 1991; Mancia et al. 1999; Castiglioni et al. 2007). In any case, the consistent reduction of BP variability, quantified by lower s.d. and VLF powers (Table 1), would indicate that the buffering action of the cardiac baroreflex is improved. This suggests that a reduced vasomotor sympathetic baroreflex goes with a more efficient cardiac parasympathetic baroreflex. Since BP changes induced by regulating peripheral resistances through the sympathetic vasomotor outflow may be negligible, most of the residual BP variability may reflect HR fluctuations mechanically. This may happen through the same physiological mechanisms we have mentioned discussing the effects of vagal blockade on BP, i.e. either through the exponential diastolic decay associated with the windkessel mechanism, or through changes of the diastolic filling period. These mechanisms may have transmitted on BP dynamics the effects induced on HR dynamics by the increased cardiac vagal tone. Therefore, the significant decrease of BP scale coefficients at scales shorter than 10 s (Fig. 4E and F) may indirectly result from vagal influences through changes in HR dynamics. A tight mechanical link between HR and BP following clonidine might thus explain why the profiles of DFA scale exponents of R–R interval and BP appear similar (see also Fig. 6).
Scale-exponent spectrum vs. power spectrum
Although the scale-exponent spectrum is a function of the time scale t, in seconds, and the power spectrum of the frequency f, in hertz, their components can be easily associated with each other, being t = 1/f. This allows analysing the two spectra together, which provides complementary information. In fact, while the spectral power in a given frequency band provides ‘local’ information on the amplitude of fluctuations, scale exponents around a given temporal scale provide ‘local’ information on the degree of correlation of the fluctuations. Together, these two tools may give a more complete picture of the cardiovascular dynamics.
For instance, consider the parasympathetic influences on HR and BP variability: while power spectral analysis confirmed that the vagal outflow accounts for most of the HF and LF powers of HR, without affecting BP powers, the scale-exponent spectrum showed that the vagal outflow lowers the degree of correlation over the same range of fluctuations for both HR and BP. Vagal influences on BP dynamics were not detected in studies based on traditional power spectral analysis only (Japundzic et al. 1990) because, as we discussed previously, they affect more the degree of correlation among BP fluctuations and thus the scale exponent spectrum, rather than the HF power, which mainly depends on breathing mechanics.
Power spectra and scale-exponent spectra also provide complementary views of the influence of clonidine on BP variability. Clonidine does not alter the power of faster BP oscillations (HF power), but decreases BP scale exponents at short time scales (Fig. 4H and I). We have suggested that the influence on BP scale exponents may be the effect of the increased activity of cardiac vagal motoneurons (Toader et al. 2008), which increases the white-noise component of HR directly, and the white-noise component of BP indirectly through changes in diastolic decays and diastolic filling periods. The power of this ‘white-noise’ component is expected to be lower than the power of the respiratory spectral peak. Since CO2 sensitivity is not fundamentally affected by clonidine (Bailey et al. 1991), clonidine does not change significantly the HF power of BP and HR.
On the other hand, clonidine decreased significantly the VLF powers of BP (Table 1) without changing long-term scale exponents. This may suggest that the resetting of sympathetic vascular activity to a lower set-point reduced the amplitude but did not alter the correlation structure of BP fluctuations.
Limitations
Subjects were resting supine in a familiar environment, which implies a very low sympathetic tone. Thus, effects of sympathetic blockade are less evident than in conditions with enhanced sympathetic activity. However, even so, our study identified clear effects of the cardiac sympathetic outflow by comparing vagal and combined blockade, i.e. after removal of masking vagal influences. Another limitation regards the duration of our recordings, necessarily less extended than in studies based on 24 h Holter recordings. This limits the range of time scales over which DFA can be applied. In any case, our recordings are substantially longer than the data segments of a few minutes analysed in most DFA studies which recently evaluated the effects of manoeuvers stimulating the autonomic tone, and which, for this reason, could only consider the effects on α1 (Tulppo et al. 2001a,b, 2005).
Conclusions and perspective
It is known that physiological (Tulppo et al. 2001a, 2005; Beckers et al. 2006a) or pathological (Vikman et al. 1999; Makikallio et al. 1999; Castiglioni et al. 2007) changes in the autonomic control may modify the structure of HR scale exponents. This study delineated the influences of the autonomic nervous system by considering a whole spectrum of scale exponents, separating vagal and sympathetic contributions, and distinguishing cardiac from vascular sympathetic influences. It showed that both cardiac sympathetic and vagal outflows affect the structure of HR scale-exponents, but with opposite contributions (Brownian motion for the sympathetic system, white noise for the parasympathetic system); that the vagal outflow may indirectly influence the scaling structure of BP; that the cardiac sympathetic activity may increase long-term scale exponents of HR; and that the sympathetic activity (both cardiac and vascular) does not seem to have substantial effects on long-term scale exponents of BP. These findings will allow better delineating alterations of cardiovascular fractal dynamics in physiological and pathophysiological settings.
Acknowledgments
Jean Paul Viale and Joel Parlow helped upon collection of the data.
Glossary
Abbreviations
- BP
blood pressure
- DBP
diastolic blood pressure
- DFA
detrended fluctuation analysis
- HF
high frequency
- HR
heart rate
- LF
low frequency
- MAP
mean arterial pressure
- SBP
systolic blood pressure
- VLF
very low frequency
Author contributions
All authors contributed to conception, design and interpretation of data; to drafting the article or revising it critically; and to final approval of the version to be published. Additionally, P.C. analysed the data and led the writing of the manuscript; A.C. and L.Q. performed the experiments and collected the data.
References
- Bailey PL, Sperry RJ, Johnson GK, Eldredge SJ, East KA, East TD, Pace NL, Stanley TH. Respiratory effects of clonidine alone and combined with morphine, in humans. Anesthesiology. 1991;74:43–48. doi: 10.1097/00000542-199101000-00008. [DOI] [PubMed] [Google Scholar]
- Beckers F, Verheyden B, Aubert AE. Aging and nonlinear heart rate control in a healthy population. Am J Physiol Heart Circ Physiol. 2006a;290:H2560–H2570. doi: 10.1152/ajpheart.00903.2005. [DOI] [PubMed] [Google Scholar]
- Beckers F, Verheyden B, Ramaekers D, Swynghedauw B, Aubert AE. Effects of autonomic blockade on non-linear cardiovascular variability indices in rats. Clin Exp Pharmacol Physiol. 2006b;33:431–439. doi: 10.1111/j.1440-1681.2006.04384.x. [DOI] [PubMed] [Google Scholar]
- Berger RD, Saul JP, Cohen RJ. Transfer function analysis of autonomic regulation. I. Canine atrial rate response. Am J Physiol Heart Circ Physiol. 1989;256:H142–H152. doi: 10.1152/ajpheart.1989.256.1.H142. [DOI] [PubMed] [Google Scholar]
- Bojorges-Valdez ER, Echeverria JC, Valdes-Cristerna R, Pena MA. Scaling patterns of heart rate variability data. Physiol Meas. 2007;28:721–730. doi: 10.1088/0967-3334/28/6/010. [DOI] [PubMed] [Google Scholar]
- Castiglioni P, Di Rienzo M, Veicsteinas A, Parati G, Merati G. Mechanisms of blood pressure and heart rate variability: an insight from low-level paraplegia. Am J Physiol Regul Integr Comp Physiol. 2007;292:R1502–R1509. doi: 10.1152/ajpregu.00273.2006. [DOI] [PubMed] [Google Scholar]
- Castiglioni P, Parati G, Civijian A, Quintin L, Di Rienzo M. Local scale exponents of blood pressure and heart rate variability by detrended fluctuation analysis: effects of posture, exercise and ageing. IEEE Trans Biomed Eng. 2009;56:675–684. doi: 10.1109/TBME.2008.2005949. [DOI] [PubMed] [Google Scholar]
- Di Rienzo M, Castiglioni P, Parati G, Mancia G, Pedotti A. Effects of sino-aortic denervation on spectral characteristics of blood pressure and pulse interval variability: a wide-band approach. Med Biol Eng Comput. 1996;34:133–141. doi: 10.1007/BF02520018. [DOI] [PubMed] [Google Scholar]
- Di Rienzo M, Parati G, Castiglioni P, Omboni S, Ferrari AU, Ramirez AJ, Pedotti A, Mancia G. Role of sinoaortic afferents in modulating BP and pulse-interval spectral characteristics in unanesthetized cats. Am J Physiol Heart Circ Physiol. 1991;261:H1811–H1818. doi: 10.1152/ajpheart.1991.261.6.H1811. [DOI] [PubMed] [Google Scholar]
- Echeverria JC, Woolfson MS, Crowe JA, Hayes-Gill BR, Croaker GD, Vyas H. Interpretation of heart rate variability via detrended fluctuation analysis and alphabeta filter. Chaos. 2003;13:467–475. doi: 10.1063/1.1562051. [DOI] [PubMed] [Google Scholar]
- Eke A, Herman P, Bassingthwaighte JB, Raymond GM, Percival DB, Cannon M, Balla I, Ikrenyi C. Physiological time series: distinguishing fractal noises from motions. Pflugers Arch. 2000;439:403–415. doi: 10.1007/s004249900135. [DOI] [PubMed] [Google Scholar]
- Eke A, Herman P, Kocsis L, Kozak LR. Fractal characterization of complexity in temporal physiological signals. Physiol Meas. 2002;23:R1–R38. doi: 10.1088/0967-3334/23/1/201. [DOI] [PubMed] [Google Scholar]
- Fadel PJ, Orer HS, Barman SM, Vongpatanasin W, Victor RG, Gebber GL. Fractal properties of human muscle sympathetic nerve activity. Am J Physiol Heart Circ Physiol. 2004;286:H1076–H1087. doi: 10.1152/ajpheart.00577.2003. [DOI] [PubMed] [Google Scholar]
- Goldberger AL. Non-linear dynamics for clinicians: chaos theory, fractals, and complexity at the bedside. Lancet. 1996;347:1312–1314. doi: 10.1016/s0140-6736(96)90948-4. [DOI] [PubMed] [Google Scholar]
- Goldberger AL, Amaral LA, Glass L, Hausdorff JM, Ivanov PC, Mark RG, Mietus JE, Moody GB, Peng CK, Stanley HE. PhysioBank, PhysioToolkit, and PhysioNet: components of a new research resource for complex physiologic signals. Circulation. 2000;101:E215–E220. doi: 10.1161/01.cir.101.23.e215. [DOI] [PubMed] [Google Scholar]
- Holm S. A simple sequentially rejective multiple test procedure. Scand J Statist. 1979;6:65–70. [Google Scholar]
- Huikuri HV, Makikallio TH, Peng CK, Goldberger AL, Hintze U, Moller M. Fractal correlation properties of R-R interval dynamics and mortality in patients with depressed left ventricular function after an acute myocardial infarction. Circulation. 2000;101:47–53. doi: 10.1161/01.cir.101.1.47. [DOI] [PubMed] [Google Scholar]
- Ivanov PC, Amaral LA, Goldberger AL, Havlin S, Rosenblum MG, Struzik ZR, Stanley HE. Multifractality in human heartbeat dynamics. Nature. 1999;399:461–465. doi: 10.1038/20924. [DOI] [PubMed] [Google Scholar]
- Japundzic N, Grichois ML, Zitoun P, Laude D, Elghozi JL. Spectral analysis of blood pressure and heart rate in conscious rats: effects of autonomic blockers. J Auton Nerv Syst. 1990;30:91–100. doi: 10.1016/0165-1838(90)90132-3. [DOI] [PubMed] [Google Scholar]
- Kleinz M, Osler TJ. A child's garden of fractional derivatives. The College Mathematics Journal. 2000;31:82–88. [Google Scholar]
- Koller EA, Drechsel S, Hess T, Macherel P, Boutellier U. Effects of atropine and propranolol on the respiratory, circulatory, and ECG responses to high altitude in man. Eur J Appl Physiol Occup Physiol. 1988;57:163–172. doi: 10.1007/BF00640657. [DOI] [PubMed] [Google Scholar]
- Krauth J. Distribution-Free Statistics. An Application-Oriented Approach. Amsterdam: Elsevier; 1988. [Google Scholar]
- Levy MN, Yang T, Wallick DW. Assessment of beat-by-beat control of heart rate by the autonomic nervous system: molecular biology technique are necessary, but not sufficient. J Cardiovasc Electrophysiol. 1993;4:183–193. doi: 10.1111/j.1540-8167.1993.tb01222.x. [DOI] [PubMed] [Google Scholar]
- Makikallio TH, Hoiber S, Kober L, Torp-Pedersen C, Peng CK, Goldberger AL, Huikuri HV. Fractal analysis of heart rate dynamics as a predictor of mortality in patients with depressed left ventricular function after acute myocardial infarction. TRACE Investigators. TRAndolapril Cardiac Evaluation. Am J Cardiol. 1999;83:836–839. doi: 10.1016/s0002-9149(98)01076-5. [DOI] [PubMed] [Google Scholar]
- Malpas SC. Neural influences on cardiovascular variability: possibilities and pitfalls. Am J Physiol Heart Circ Physiol. 2002;282:H6–H20. doi: 10.1152/ajpheart.2002.282.1.H6. [DOI] [PubMed] [Google Scholar]
- Mancia G, Parati G, Castiglioni P, Di Rienzo M. Effect of sinoaortic denervation on frequency-domain estimates of baroreflex sensitivity in conscious cats. Am J Physiol Heart Circ Physiol. 1999;276:H1987–H1993. doi: 10.1152/ajpheart.1999.276.6.H1987. [DOI] [PubMed] [Google Scholar]
- Moody G, Mark R, Bump M, Weinstein J, Berman A, Mietus J, Goldberger A. Vol. 13. Washington, DC: IEEE Computer Society Press; 1986. Clinical validation of the ECG-derived respiration (EDR) technique; pp. 507–510. Computers in Cardiology Conference Proceeding. [Google Scholar]
- Oppenheim AV, Willsky AS, Nawab SH. Signals and Systems. 2nd ed. Upper Saddle River, NJ: Prentice-Hall; 1997. [Google Scholar]
- Parlow J, Viale JP, Annat G, Hughson R, Quintin L. Spontaneous cardiac baroreflex in humans. Comparison with drug-induced responses. Hypertension. 1995;25:1058–1068. doi: 10.1161/01.hyp.25.5.1058. [DOI] [PubMed] [Google Scholar]
- Parlow JL, Begou G, Sagnard P, Cottet-Emard JM, Levron JC, Annat G, Bonnet F, Ghignone M, Hughson R, Viale JP, Quintin L. Cardiac baroreflex during the postoperative period in patients with hypertension: effect of clonidine. Anesthesiology. 1999;90:681–692. doi: 10.1097/00000542-199903000-00008. [DOI] [PubMed] [Google Scholar]
- Peng CK, Havlin S, Stanley HE, Goldberger AL. Quantification of scaling exponents and crossover phenomena in nonstationary heartbeat time series. Chaos. 1995;5:82–87. doi: 10.1063/1.166141. [DOI] [PubMed] [Google Scholar]
- Pomeranz B, Macaulay RJ, Caudill MA, Kutz I, Adam D, Gordon D, et al. Assessment of autonomic function in humans by heart rate spectral analysis. Am J Physiol Heart Circ Physiol. 1985;248:H151–H153. doi: 10.1152/ajpheart.1985.248.1.H151. [DOI] [PubMed] [Google Scholar]
- Tan CO, Cohen MA, Eckberg DL, Taylor JA. Fractal properties of human heart period variability: physiological and methodological implications. J Physiol. 2009;587:3929–3941. doi: 10.1113/jphysiol.2009.169219. [DOI] [PMC free article] [PubMed] [Google Scholar]
- Task Force of the European Society of Cardiology and the North American Society of Pacing and Electrophysiology. Heart rate variability. Standards of measurement, physiological interpretation, and clinical use. Eur Heart J. 1996;17:354–381. [PubMed] [Google Scholar]
- Toader E, Cividjian A, Rentero N, McAllen RM, Quintin L. Cardioinhibitory actions of clonidine assessed by cardiac vagal motoneuron recordings. J Hypertens. 2008;26:1169–1180. doi: 10.1097/HJH.0b013e3282fd10e0. [DOI] [PubMed] [Google Scholar]
- Tulppo MP, Hughson RL, Makikallio TH, Airaksinen KE, Seppanen T, Huikuri HV. Effects of exercise and passive head-up tilt on fractal and complexity properties of heart rate dynamics. Am J Physiol Heart Circ Physiol. 2001a;280:H1081–H1087. doi: 10.1152/ajpheart.2001.280.3.H1081. [DOI] [PubMed] [Google Scholar]
- Tulppo MP, Kiviniemi AM, Hautala AJ, Kallio M, Seppanen T, Makikallio TH, Huikuri HV. Physiological background of the loss of fractal heart rate dynamics. Circulation. 2005;112:314–319. doi: 10.1161/CIRCULATIONAHA.104.523712. [DOI] [PubMed] [Google Scholar]
- Tulppo MP, Makikallio TH, Seppanen T, Shoemaker K, Tutungi E, Hughson RL, Huikuri HV. Effects of pharmacological adrenergic and vagal modulation on fractal heart rate dynamics. Clin Physiol. 2001b;21:515–523. doi: 10.1046/j.1365-2281.2001.00344.x. [DOI] [PubMed] [Google Scholar]
- Vikman S, Makikallio TH, Yli-Mayry S, Pikkujamsa S, Koivisto AM, Reinikainen P, Airaksinen KE, Huikuri HV. Altered complexity and correlation properties of R-R interval dynamics before the spontaneous onset of paroxysmal atrial fibrillation. Circulation. 1999;100:2079–2084. doi: 10.1161/01.cir.100.20.2079. [DOI] [PubMed] [Google Scholar]
- Viswanathan GM, Peng CK, Stanley HE, Goldberger AL. Deviations from uniform power law scaling in nonstationary time series. Phys Rev E Stat Phys Plasmas Fluids Relat Interdiscip Topics. 1997;55:845–849. doi: 10.1103/physreve.55.845. [DOI] [PubMed] [Google Scholar]
- West GB, Brown JH, Enquist BJ. A general model for the origin of allometric scaling laws in biology. Science. 1997;276:122–126. doi: 10.1126/science.276.5309.122. [DOI] [PubMed] [Google Scholar]
- Wilcox RR. Introduction to Robust Estimation and Hypothesis Testing. 2nd ed. Amsterdam: Elsevier Academic Press; 2005. [Google Scholar]
- Yamamoto Y, Hughson RL. On the fractal nature of heart rate variability in humans: effects of data length and β-adrenergic blockade. Am J Physiol Regul Integr Comp Physiol. 1994;266:R40–R49. doi: 10.1152/ajpregu.1994.266.1.R40. [DOI] [PubMed] [Google Scholar]
- Yamamoto Y, Nakamura Y, Sato H, Yamamoto M, Kato K, Hughson RL. On the fractal nature of heart rate variability in humans: effects of vagal blockade. Am J Physiol Regul Integr Comp Physiol. 1995;269:R830–R837. doi: 10.1152/ajpregu.1995.269.4.R830. [DOI] [PubMed] [Google Scholar]