Abstract
Fenestrations are pores in liver sinusoidal endothelial cells that filter substrates and debris between the blood and hepatocytes. Fenestrations have significant roles in aging and the regulation of lipoproteins. However their small size (<200 nm) has prohibited any functional analysis by light microscopy. We employed structured illumination light microscopy to observe fenestrations in isolated rat liver sinusoidal endothelial cells with great clarity and spatial resolution. With this method, the three dimensional structure of fenestrations (diameter 123±24 nm) and sieve plates was elucidated and it was shown that fenestrations occur in areas of abrupt cytoplasmic thinning (165±54 nm vs 292±103 nm in non-fenestrated regions, P<0.0001). Sieve plates were not preferentially co-localized with fluorescently labeled F-actin stress fibers and endothelial nitric oxide synthase but appeared to occur in primarily attenuated non-raft regions of the cell membrane. Labyrinthine structures were not seen and all fenestrations were short cylindrical pores. In conclusion, three dimensional structured illumination microscopy has enabled the unlimited power of fluorescent immunostaining and colocalization to reveal new structural and functional information about fenestrations and sieve plates.
Keywords: Structured illumination microscopy, liver sinusoidal endothelial cell, fenestrations, nitric oxide synthase, actin
1. Introduction
Liver sinusoidal endothelial cells (LSECs) separate blood in the hepatic sinusoid from the extracellular space of Disse and surrounding sheets of hepatocytes. In order to maximize the transfer of substrates between blood and hepatocytes, LSECs have a unique morphology with cytoplasmic extensions that are very thin and perforated with pores called fenestrations. Fenestrations are fully patent, non-diaphragmed pores that connect the luminal membrane with the extracellular membrane of LSECs. Most fenestrations are clustered together in groups of 10–100 called liver sieve plates, which occupy 2–20% of the LSEC surface (Cogger and Le Couteur, 2009; Fraser et al., 1995; Wisse et al., 1985).
Fenestrations are smaller than the optical diffraction limit (~250 nm) and there are no known cell surface markers available to specifically label them, therefore observation of fenestrations has been limited to electron microscopy (EM), and recently, atomic force microscopy (AFM). While both techniques can yield ultrastructural morphology, they also have significant limitations. EM requires fixatives and treatment of tissue with resins and dehydration, resulting in a lack of temporal information, and the inability to utilize versatile and specialized probes including genetically encoded fluorescent proteins and concentration-sensitive ion indicators (Braet et al., 2007; Cogger and Le Couteur, 2009). AFM yields formidable topographic physical information, but again without specific markers. In addition, the cytoplasmic extensions of the LSECs are technically difficult to assess by AFM because they are extremely thin (Braet et al., 2007). Furthermore, both imaging techniques are relatively low-throughput which handicaps exhaustive studies (Cogger and Le Couteur, 2009).
Here we have used ultra-high resolution light microscopy (Huser, 2008; Lippincott-Schwartz and Manley, 2009) to overcome these limitations. Three-dimensional structured illumination microscopy (SIM) is a relatively fast, easy-to-use multi-color ultra-resolution light microscopy technique (Schermelleh et al., 2008). It uses patterned illumination from a coherent light source to convert otherwise unobservable structures below the resolution limit of light microscopy into observable ones by generating difference/beat frequencies called Moiré fringes. By varying the light pattern and observing a sufficient number of Moiré fringes, a higher resolution image can be reconstructed resulting in a resolution two times better than conventional light microscopy, which is well within the average diameter of fenestrations. Importantly, in comparison with electron microscopy, SIM can be used with any conventional fluorophore and cell preparation is identical to other established light microscopy methods (Carlton, 2008). We investigated the three dimensional structure of fenestrations and sieve plates as well as determining their co-localization with two potential markers of fenestrations, F-actin (Braet et al., 1996) and endothelial nitric oxide synthase (eNOS) (Yokomori et al., 2001). SIM has the potential to revolutionize research into LSECs and their fenestrations.
2. Materials and Methods
2.1 Materials
Reagents included Type 1A Collagenase (Sigma Chemical, St. Louis, MO #C9891), RPMI (Gibco Invitrogen #11875-093), CellMask Orange (Invitrogen, #C10045), Prolong Gold (Invitrogen # P36930), eNOS antibodies (BD Biosciences, #610298), Alexa Fluor 488 Phalloidin (Invitrogen, #A12379), and Alexa Fluor 532 Phalloidin (Invitrogen, #A22282).
2.2 Cell Culture
Experiments were performed in adherence with the guidelines outlined in the National Institutes of Health “Guide for the Care and Use of Laboratory Animals” (Revised 1985) prepared by the National Academy of Sciences as described previously (DeLeve et al., 2006). The experiments followed protocols approved by the Animal Care and Use Committee of the University of Southern California. Male Sprague Dawley rats (body wt 250–280 g) were anesthetized with pentobarbital and then treated with 200 μL porcine intestine heparin (1,000 U/ml). The liver was perfused for 10 min with calcium-free Geys buffered saline at 37°C at 10 ml/min, followed by perfusion in a recirculating fashion for 20 min with GBS containing 0.05% type 1a collagenase (Sigma Chemicals, St. Louis, MO). The livers were mechanically dissociated, pressed through polypropylene mesh, and centrifuged, and the digest was resuspended in 50 ml GBS. The resulting digest was used to isolate LSECs by gradient centrifugation and centrifugal elutriation. Purity was 98% as determined by positive staining for fluorescent acetylated low-density lipoprotein and a peroxidase stain to reveal contaminating Kupffer cells. Viability was 95% and yield averaged >100 million cells. Cells were plated on #1.5 coverslips and cultured overnight in serum-free media. The following day the LSECs were fixed with 4% fresh paraformaldehyde in PBS. Following fixation the cells were prepared for visualization using SIM.
2.3 Fluorescence studies
To visualize the filamentous actin within LSECs the fixed cells were permeabilized with 0.05% saponin in blocking solution and then incubated with Alexa Fluor 488 Phalloidin (Invitrogen, #A12379) or Alexa Fluor 532 Phalloidin (Invitrogen, #A22282) for 10 minutes at room temperature. For cell membrane visualization, 0.5 ug/ml of Cell Mask Orange (Invitrogen, #C10045) was applied to the fixed cells for 10 minutes at room temperature. Cells were mounted with Prolong Gold (Invitrogen, #P36930) prior to examination. To visualize eNOS distribution, fixed cells were permeabilized with 0.05% saponin in blocking solution for 1 hour prior to an overnight incubation (4°C) with rabbit polyclonal anti-eNOS (BD Biosciences, #610298) (1:50). The following day cells then were treated with goat anti-rabbit antibody conjugated to Alexa Fluor 532 (Invitrogen, #A11009) or goat anti-rabbit antibody conjugated to Alexa Fluor 488 (Invitrogen, #A11034) for 45 minutes at room temperature. Cells were mounted with Prolong Gold (Invitrogen, #P36930) and examined with SIM.
2.4 Structured illumination microscopy
The structured illumination microscope is based on a prototype of the commercial model Deltavision|OMX V2.0 (Applied Precision Inc, Issaquah, WA). It delivers 488 and 532 nm lasers with variable power to the environmentally isolated microscope system using a multimode optical fiber and fiber shaker. The laser light passes through a movable phase grating where the grating’s image plane is projected onto the sample using a collimation lens, a 100× 1.40 NA oil objective (UpanSApo, Olympus, Japan), and 1.514 index immersion oil. Fluorescence emission is collected by the same objective, split by channel, and filtered using a FF01-512/25-25 fluorescence filter (Semrock, Rochester, NY) for the 488 excitation channel or a FF01-593/40-25 (Semrock, Rochester, NY) fluorescence filter for the 532 excitation channel. Each channel was imaged by a dedicated Cascade II 512 EM-CCD camera (Photometrics, Tuscon AZ), which used 10–70 ms exposures, 1 pre-amp gain, and variable EM gain. Acquisition and all mechanics were controlled by the OMXN controller software (Applied Precision Inc, Issaquah, WA) while reconstructions were made with the OMX specific SoftWoRx v4.5.0 software package (Applied Precision Inc, Issaquah, WA). The reconstruction algorithms takes into account the specific optical transform functions for each channel, which are wavelength-dependent. Each channel required 5 exposures for a given angle (5 lateral translations of the interference pattern by 72 degrees), and 3 different angular grating positions (in steps of 60 degrees) for a total of 3×5=15 exposures per optical slice. As each channel uses a different EMCCD camera, there were slight differences in the observed grating angles between channels. To obtain 3D images, the sample is translated vertically in steps of 125 nm, resulting in 16 vertical slices for a 2 μm thick sample.
2.5 Image analysis
Image analysis was performed using Volocity (Perkin-Elmer) and ImageJ software (http://rsb.info.nih.gov/ij/).
2. 6 Statistics
All data are presented as mean ± standard deviation and comparisons of two groups performed using a Students t-test.
3. Results
3.1 SIM of LSECs and sieve plates
Conventional deconvolution fluorescence microscopy of LSECs stained with the lipophilic fluorophore Cell Mask Orange showed that freshly isolated LSECs plated on glass substrates were intact and growing in a near confluent monolayer (Fig. 1A). Further examination of the cells by fluorescence microscopy showed many areas of interest indicating the potential presence of sieve plates and these areas were further examined at higher magnification by both conventional confocal fluorescence deconvolution microscopy and SIM (Fig. 1B, 1C). The improved resolution using SIM is apparent and fenestrations could be seen in the cytoplasm particularly along the edges of the cells. Further magnification of sieve plates using SIM is shown in Fig. 2A–C. Fenestrations were easily resolved. For comparison, images using conventional microscopy (Fig. 2D) and scanning EM (Fig. 2E, 2F) are shown. Conventional microscopy did not resolve fenestrations while SIM had similar resolution to scanning EM and fenestrations were of similar size and structure. The mean diameter of the fenestrations using SIM was 123±24 nm and varied between 69–171 nm with a roughly normal distribution. There were 26±14 fenestrations in each sieve plate (n=10 sieve plates; n=259 fenestrations). Surprisingly, the width to which individual fenestra could be resolved was less than the optical resolution of the 3D-SIM system, which was determined to be ~ 110 nm by calibration with individual 100 nm fluorescent beads. We believe this discrepancy is due to the fact that fenestra are characterized by an inverted contrast when compared to fluorescent beads, i.e. they are dark objects within a brightly fluorescent background. Because of this, the signal-to-noise ratio for fenestra is significantly more favorable compared to weakly fluorescent objects, resulting in an apparent higher resolution.
Fig. 1.
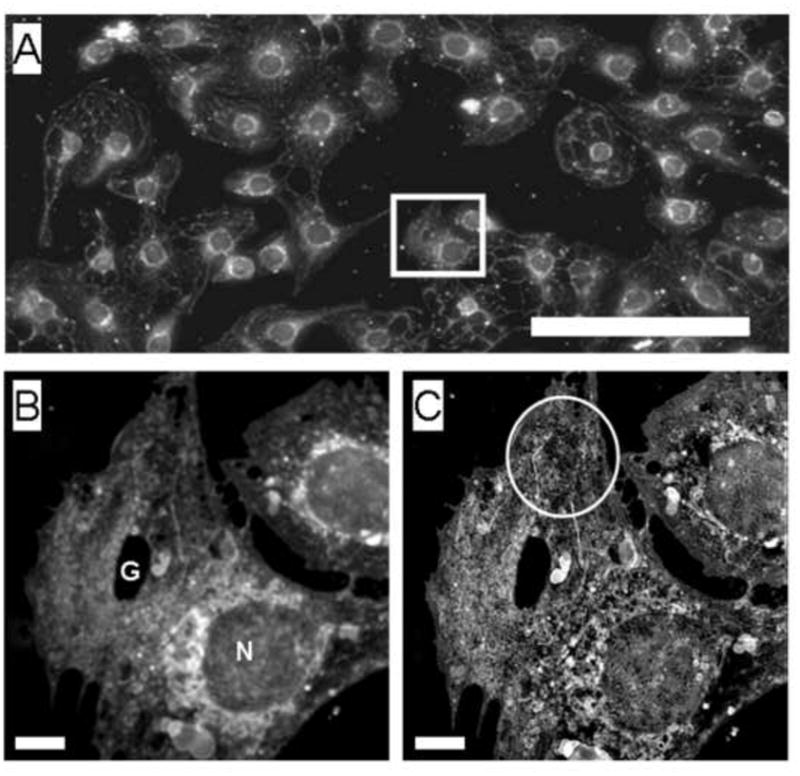
(A) Conventional deconvolution microscopy of LSECs stained with CellMask Orange, used to stain the cell membrane, showed that LSECs were intact and growing in a near- confluent monolayer. (Scale bar 20 μm). A selected cell of interest is examined at higher magnification below.
(B) The selected cells from the image above were visualized using fluorescence deconvolution.
(C) SIM image of the same cells showing improved resolution including fenestrations (circled). (Scale bar 2 μm, N nucleus, G gap).
Fig. 2.
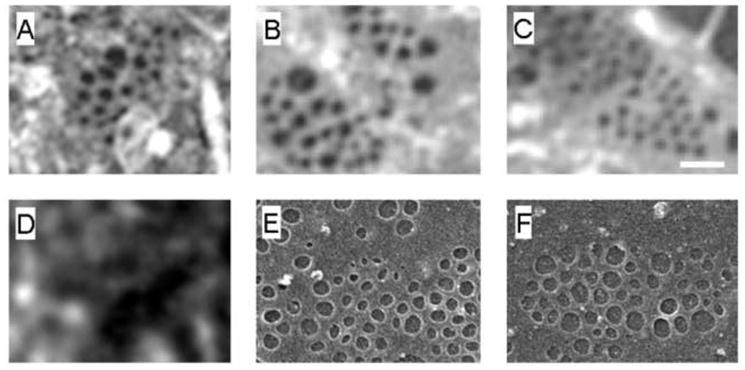
(A, B, C) SIM images of representative sieve plates showing clusters of fenestrations.
(D) In comparison, conventional microscopy cannot resolve sieve plates.
(E, F) Scanning electron microscopy of representative sieve plates. (Scale bar 200 nm)
3.2 SIM of sieve plates and fenestrations
SIM was used to reconstruct LSECs stained with Cell Mask Orange. Fig. 3A–D shows a representative set of images rotated in space so that both the top and underneath surfaces of the cell can be visualized. There are multiple sieve plates in the non-nucleated region of the LSEC and the cell membrane between the sieve plates contain thickened white structures. Supplementary video 1 shows an LSEC rotating through space. 3D reconstruction of a sieve plate is shown in Fig. 4A–D and the supplementary videos 2–4 show several sieve plates rotating through space. These images show that the fenestrations extend through the entire cytoplasm without any bridging diaphragms. No labyrinthine complexes of fenestrations were observed and all fenestrations were short straight pores with circular and/or polygonal shape and a slightly crenulated lumenal membrane surface. It is also apparent that the sieve plates form within a focal area of cytoplasmic attenuation with the sieve plate and the surrounding rim of cell about one half as thick as the surrounding cell cytoplasmic extension (165±54 nm vs 292±103 nm P<0.001).
Fig. 3.
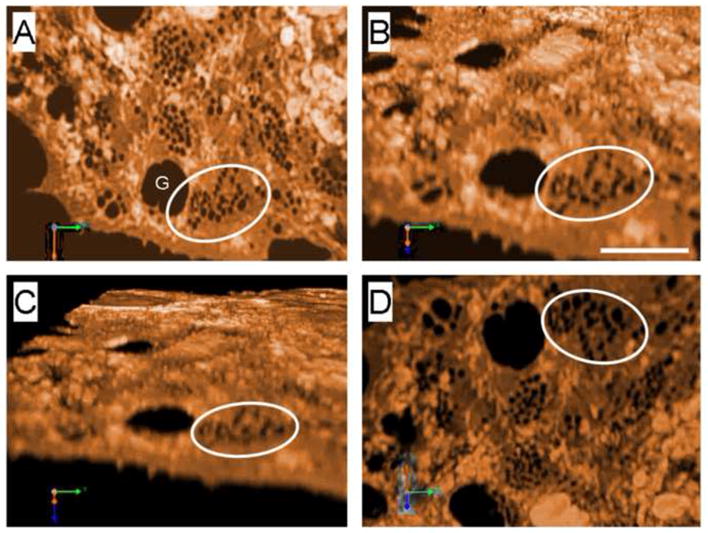
SIM of LSEC showing fenestrations clustered in sieve plates (the circle identifies the same sieve plate in each image). The image has been rotated so that Fig. 3A shows the top surface while Fig. 3D shows the underneath surface of the LSEC. (Scale bar 2 μm, G gap). A 3D movie is shown in the supplementary files.
Fig. 4.
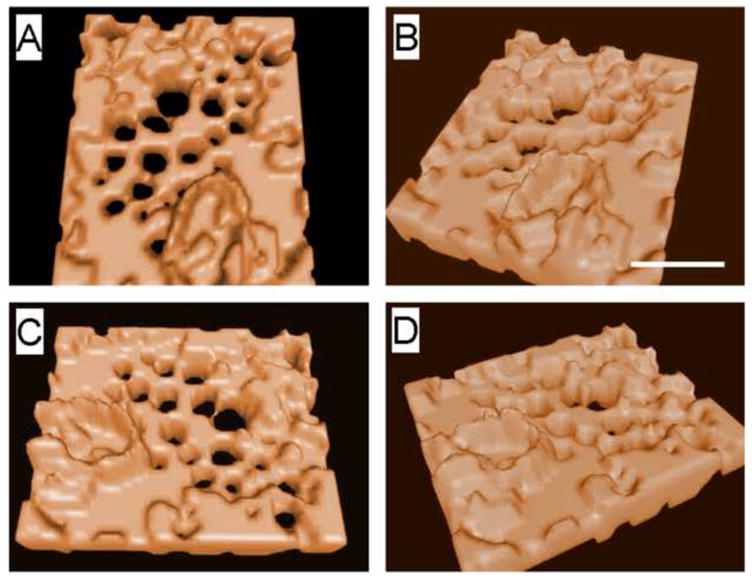
3D isosurface rendering of the sieve plate revealing that the lumen of the fenestrations span right through the cells. The sieve plate lies in an area of cytoplasmic attenuation. The 3D reconstruction can be rotated in all directions as shown. (Scale bar 300 nm). 3D movies are shown in the supplementary files.
3.3 Actin and eNOS immunofluorescence
SIM was further used to study the location of key proteins found in LSECs and considered to be associated with, or to regulate, fenestrations (F-actin and eNOS). Phalloidin staining of the LSECs for F-actin revealed large numbers of F-actin stress fibers surrounding the nucleus and traversing the cytoplasm (Fig 5A). SIM imaging showed thick bands of F-actin that were forming rings around either individual liver sieve plates or large gaps in the cytoplasm (Fig. 5B). eNOS was widely distributed throughout the cells and tended to be mostly co-localized with the actin cytoskeleton surrounding the liver sieve plates (Fig. 5C–F).
Fig. 5.
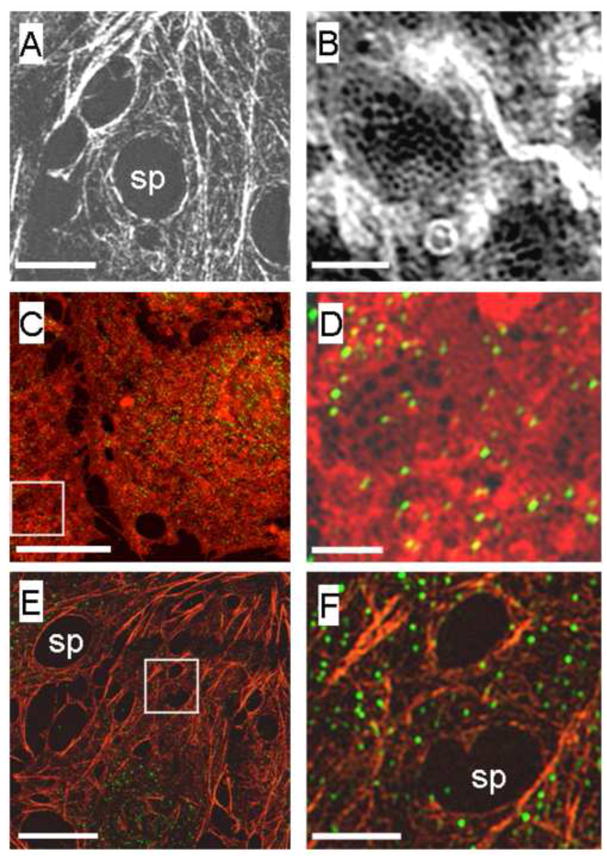
(A, B) SIM fluorescence images of phalloidin-labeled isolated LSEC showing F-actin stress fibers surrounding the sieve plates and at higher magnification (B) actin fibers can be seen forming a lace-like network around individual fenestrations. (Scale bars A: 2 μm, B: 500 nm).
(C, D) SIM fluorescence images of an isolated LSEC labeled with Cell Mask Orange (orange) and eNOS (green). A low magnification image of the LSEC reveals scattered eNOS staining all over the cell membrane of the LSEC. A higher magnification image of the boxed area in C is shown as D. This highlights that there is only limited staining for eNOS in the sieve plates and there does not appear to be significant colocalization of eNOS with fenestrations. (Scale bars C: 5 μm, D: 500 nm)
(E, F) SIM fluorescence images of an isolated LSEC stained for both F-actin and eNOS. The pattern of F-actin distribution is shown in orange-stress fibers and large gaps are apparent around liver sieve plates and scattered eNOS staining is seen in green. The boxed area in E is magnified and shown as F. At higher resolution, actin staining is apparent around individual fenestrations but eNOS does not appear to be colocalized with fenestrations. (Scale bars E:2 μm, F: 500 nm)
4. Discussion
To validate the use of SIM for observation of LSECs we determined whether fenestrations are preserved in LSECs fixed for light microscopy with paraformaldehye rather than fixation with glutaraldehyde for EM. LSECs were isolated from rat livers using collagenase and standard methodology. Conventional deconvolution fluorescence microscopy of LSECs did not resolve fenestrations while SIM was able to clearly resolve sieve plates and fenestrations. Moreover, sieve plates and fenestrations imaged by SIM had similar morphology and dimensions to those imaged using standard scanning EM.
Fenestration morphology and dimensions were then assessed using SIM. Previously, size and morphology of fenestrations have been somewhat difficult to measure. With scanning EM, it may be impossible to differentiate smaller fenestrations from caveolae and other membrane pits and this distinction can only be made by demonstrating the presence or absence of complete discontinuity of the cytoplasm by transmission EM. Furthermore, scanning EM may underestimate the size of fenestrations particularly in intact liver samples because of drying methods and gold coating (Braet et al., 2007). Transmission EM is limited by the number of fenestrations that are counted on cross section and the inability to determine whether the fenestration has been transected at its longest diameter (Cogger and Le Couteur, 2009). Recently, AFM was able to image fenestrations in fixed wet isolated LSECs (Braet et al., 2007), however AFM cannot be used with fluorescent markers. In addition, AFM exerts rather high pressure that might damage the fragile LSEC membrane.
In the SIM studies presented here, intact sieve plates and fenestrations were distributed throughout the non-nucleated regions of the LSECs. The mean diameter of the fenestrations was 123±24 nm and there were 26±14 fenestrations in each sieve plate. Using EM, fenestrations have been reported to have diameters ranging from 50–170 nm in different species (Cogger and Le Couteur, 2009) and with AFM, LSECs had a diameter of 223 nm and a depth of 183 nm (Braet et al., 2007). These results are consistent with those observed in this study using SIM. There also have been reports that fenestrations form labyrinthine structures (Braet et al., 2007; Yokomori et al., 2004) however we were not able to detect any such structures with SIM.
SIM was used to generate three dimensional images of LSECs and sieve plates. This showed that fenestrations extend through the entire cytoplasm without any bridging diaphragms. It was also apparent that sieve plates form within a focal area of cytoplasmic attenuation such that the sieve plate and the surrounding rim of cell is about one half as thick as the surrounding cell cytoplasmic extension. We speculate that as F-actin cytoskeleton retracts in response to agents that increase the porosity of LSECs such as vascular endothelial growth factor and cytoskeleton disruptors (Cogger and Le Couteur, 2009), the intervening cytoplasm is stretched thinly. Fenestrations might develop spontaneously from this process of membrane thinning, analogous to the manufacture of expanded film ultrafiltration membranes (Baker, 2004). We also noted discrete thickened areas in the membrane surrounding the sieve plates that co-localized with F-actin and eNOS which we postulate are lipid rafts. Further experiments are underway to examine this hypothesis.
There have been a few studies that have attempted to identify proteins surrounding fenestrations or in the cell membranes that line the luminal surface of the fenestrations. Studies using immunogold EM have reported that caveolin-1 and eNOS are expressed in or around fenestrations (Yokomori et al., 2001; Yokomori et al., 2003). However a recent study found only limited expression of caveolin-1 in LSECs and moreover their fenestrations had normal morphology in caveolin-1 knockout mice (Warren et al., 2010). Caveolin-1 and F-actin expression was found around fenestration-like structures in SK Hep1 cells which are a liver tumor cell line with many characteristics of endothelial cells (Cogger et al., 2008). Liver sieve plates and possibly individual fenestrations are surrounded by F-actin and disruption of the actin cytoskeleton was shown to have profound effects on the morphology of fenestrations (Braet et al., 1996). Beyond these preliminary studies, little more is known about the regulatory and structural proteins involved in maintenance of fenestrations.
Here, SIM was further used to study the location of eNOS and F-actin in LSECs with respect to sieve plates and fenestrations. This is a major advantage of the SIM method in that it can be performed in conjunction with immunofluorescence. Phalloidin staining of the LSECs for F-actin revealed large numbers of F-actin stress fibers surrounding the nucleus and traversing the cytoplasm. SIM imaging showed thick bands of F-actin that were forming rings around either individual liver sieve plates or large gaps in the cytoplasm. In the past, EM imaging of detergent digests of LSECs suggested that sieve plates and fenestrations themselves are supported by the actin cytoskeleton (Nagai et al., 2004). A variety of actin-based structures involved with the maintenance of fenestrations have been identified such as the fenestration-associated cytoskeleton ring, sieve plate associated cytoskeleton, fenestration-forming center, and defenestration-associated center. It has been proposed that these are involved in the maintenance of fenestrations (Braet et al., 2003). Recently it has been shown that filamentous actin is absent in the cytoplasm separating fenestrations in the sieve plates (Braet et al., 2007). Our multicolor SIM results performed in cells that have not undergone digestion to reveal the underlying cytoskeleton, confirm that there are thick bands of F-actin surrounding the sieve plates. Furthermore, we were able to discern staining around individual fenestrations and in the cytoplasm between fenestrations. The lacelike pattern of staining around the fenestrations is unusual and emphasizes the important role of the actin cytoskeleton in regulating the morphology of fenestrations.
Using immunogold EM of tangential sections of LSECs, eNOS was located on the cell membranes lining fenestrations (Yokomori et al., 2001) although in this particular study, the fenestrations could not be as clearly defined as we have found possible with SIM. Reports using immunofluorescence have varied. One study found that eNOS is localized primarily in the perinuclear area in cultured LSECs with minimal localization at the cell membrane (Merkel et al., 2005) while another found that eNOS was distributed throughout the cytoplasm (Kwok et al., 2009). Any association between eNOS and fenestrations was not able to be resolved with confocal microscopy. SIM permitted the analysis of the expression and distribution of eNOS over large areas of LSECs. There was obvious colocalization with F-actin in those sections of cytoplasm without liver sieve plates. However, there was minimal expression within sieve plates or around the fenestrations. It should be noted that these results show an additional advantage of SIM compared to immunogold EM, in that much larger areas of the cell can be easily analyzed for localization of a protein with cell structures smaller than the resolution of light microscopy.
In conclusion, SIM confirmed that fenestrations are present in isolated LSECs fixed for light microscopy and provided very high resolution optical images of fenestrations and sieve plates on a non-invasive imaging platform. Three-dimensional reconstruction proved that fenestrations are patent pores, thus allowing easy differentiation of fenestrations from other pores and pits. Preparation of LSECs for SIM and visualization and analysis of fenestrations using SIM is essentially the same as for conventional fluorescence microscopy and significantly simpler and faster than comparable EM methodologies. SIM provides a major advance in the study of the morphology of cellular structures previously invisible to light microscopy. Fenestrations in the LSEC with a diameter of less than 200 nm are one such structure and this has limited research into the biology and regulation of fenestrations (Cogger and Le Couteur, 2009). Given the increasing recognition of the importance of fenestrations in disease, aging, drug metabolism, lipoprotein metabolism, and immunity (Cogger and Le Couteur, 2009; Hilmer et al., 2005; Le Couteur et al., 2005; Le Couteur et al., 2008; Warren et al., 2006) there is a need for improved methodologies for their study. Using SIM, fenestrations were easily resolved and clearly visible clustered in sieve plates. Sieve plates form in focal areas of marked thinning of the cytoplasm surrounded by F-actin cytoskeleton structures co-localized with eNOS. On the other hand, individual fenestrations within the sieve plate were surrounded by a thin lacelike rim of F-actin while eNOS was not detected within the sieve plates. This work exemplifies the great promise that the use of other exotic, light specific probes should begin to reveal many more details of fenestration morphology. Furthermore, the natural extension to time-lapse live-cell super-resolution light microscopy will reveal kinetic and functional imaging to help fully understand these elusive yet metabolically important cellular sieves.
Supplementary Material
Acknowledgments
This work was supported in part by the American Heart Association through the Grant-in-Aid program, and in part by funding from the National Science Foundation. The Center for Biophotonics, an NSF Science and Technology Center, is managed by the University of California, Davis, under Cooperative Agreement No. PHY 0120999. Support is also acknowledged from: the UCD Clinical Translational Science Center under grant number UL1 RR024146 from the National Center for Research Resources (NCRR); National Institutes of Health grant DK66423; National Institutes of Health and National Institute of Aging grant AG026582; the Australian National Health and Medical Research Council and; the Ageing and Alzheimers Research Foundation (a division of the Medical Foundation of the University of Sydney).
Abbreviations
- LSEC
liver sinusoidal endothelial cell
- SIM
structured illumination microscopy
- EM
electron microscopy
- eNOS
endothelial nitric oxide synthase
- AFM
atomic force microscopy
Appendix A Supplementary data
Video 1. 3D movie of liver sinusoidal endothelial cell
Videos 2–4. 3D movies of sieve plates containing fenestrations.
Footnotes
Publisher's Disclaimer: This is a PDF file of an unedited manuscript that has been accepted for publication. As a service to our customers we are providing this early version of the manuscript. The manuscript will undergo copyediting, typesetting, and review of the resulting proof before it is published in its final citable form. Please note that during the production process errors may be discovered which could affect the content, and all legal disclaimers that apply to the journal pertain.
Contributor Information
Victoria C Cogger, Email: victoria.cogger@sydney.edu.au.
Gregory P McNerney, Email: greg.mcnerney@cbst.ucdavis.edu.
Tun Nyunt, Email: mtnyunt@ucdavis.edu.
Laurie D DeLeve, Email: deleve@usc.edu.
Peter McCourt, Email: peter.mccourt@uit.no.
Bård Smedsrød, Email: bard.smedsrod@uit.no.
David G Le Couteur, Email: david.lecouteur@sydney.edu.au.
Thomas R Huser, Email: trhuser@ucdavis.edu.
References
- Baker RW. Membrane technology and applications. John Wiley & Sons; Hoboken: 2004. Membrane transport theory; pp. 15–87. [Google Scholar]
- Braet F, De Zanger R, Jans D, Spector I, Wisse E. Microfilament-disrupting agent latrunculin A induces and increased number of fenestrae in rat liver sinusoidal endothelial cells: comparison with cytochalasin B. Hepatology. 1996;24:627–35. doi: 10.1053/jhep.1996.v24.pm0008781335. [DOI] [PubMed] [Google Scholar]
- Braet F, Muller M, Vekemans K, Wisse E, Le Couteur DG. Antimycin A-induced defenestration in rat hepatic sinusoidal endothelial cells. Hepatology. 2003;38:394–402. doi: 10.1053/jhep.2003.50347. [DOI] [PubMed] [Google Scholar]
- Braet F, Wisse E, Bomans P, Frederik P, Geerts W, Koster A, Soon L, Ringer S. Contribution of high-resolution correlative imaging techniques in the study of the liver sieve in three-dimensions. Microsc Res Tech. 2007;70:230–42. doi: 10.1002/jemt.20408. [DOI] [PubMed] [Google Scholar]
- Carlton PM. Three-dimensional structured illumination microscopy and its application to chromosome structure. Chromosome Res. 2008;16:351–65. doi: 10.1007/s10577-008-1231-9. [DOI] [PubMed] [Google Scholar]
- Cogger VC, Le Couteur DG. Fenestrations in the liver sinusoidal endothelial cell. In: Arias I, et al., editors. The Liver: Biology and Pathobiology. John Wiley & Sons, Ltd; Hokoben NJ: 2009. pp. 387–404. [Google Scholar]
- Cogger VC, I, Arias M, Warren A, McMahon AC, Kiss DL, Avery VM, Le Couteur DG. The response of fenestrations, actin, and caveolin-1 to vascular endothelial growth factor in SK Hep1 cells. Am J Physiol Gastrointest Liver Physiol. 2008;295:G137–G145. doi: 10.1152/ajpgi.00069.2008. [DOI] [PMC free article] [PubMed] [Google Scholar]
- DeLeve LD, Wang X, McCuskey MK, McCuskey RS. Rat liver endothelial cells isolated by anti-CD31 immunomagnetic separation lack fenestrae and sieve plates. Am J Physiol. 2006;291:G1187–9. doi: 10.1152/ajpgi.00229.2006. [DOI] [PubMed] [Google Scholar]
- Fraser R, Dobbs BR, Rogers GW. Lipoproteins and the liver sieve: the role of fenestrated sinusoidal endothelium in lipoprotein metabolism, atherosclerosis, and cirrhosis. Hepatology. 1995;21:863–874. [PubMed] [Google Scholar]
- Hilmer SN, V, Cogger C, Fraser R, McLean AJ, Sullivan D, Le Couteur DG. Age-related changes in the hepatic sinusoidal endothelium impede lipoprotein transfer in the rat. Hepatology. 2005;42:1349–1354. doi: 10.1002/hep.20937. [DOI] [PubMed] [Google Scholar]
- Huser T. Nano-biophotonics: new tools for chemical nano-analytics. Curr Opin Chem Biol. 2008;12:497–504. doi: 10.1016/j.cbpa.2008.08.012. [DOI] [PMC free article] [PubMed] [Google Scholar]
- Kwok W, Lee SH, Culberson C, Korneszczuk K, Clemens MG. Caveolin-1 mediates endotoxin inhibition of endothelin-1-induced endothelial nitric oxide synthase activity in liver sinusoidal endothelial cells. Am J Physiol Gastrointest Liver Physiol. 2009 doi: 10.1152/ajpgi.00106.2009. [DOI] [PMC free article] [PubMed] [Google Scholar]
- Le Couteur DG, Fraser R, Hilmer S, Rivory LP, McLean AJ. The hepatic sinusoid in aging and cirrhosis - Effects on hepatic substrate disposition and drug clearance. Clin Pharmacokinet. 2005;44:187–200. doi: 10.2165/00003088-200544020-00004. [DOI] [PubMed] [Google Scholar]
- Le Couteur DG, Warren A, Cogger VC, Smedsrod B, Sorensen KK, De Cabo R, Fraser R, McCuskey RS. Old age and the hepatic sinusoid. Anat Rec (Hoboken) 2008;291:672–83. doi: 10.1002/ar.20661. [DOI] [PubMed] [Google Scholar]
- Lippincott-Schwartz J, Manley S. Putting super-resolution fluorescence microscopy to work. Nat Methods. 2009;6:21–3. doi: 10.1038/nmeth.f.233. [DOI] [PMC free article] [PubMed] [Google Scholar]
- Merkel SM, Kamoun W, Karaa A, Korneszczuk K, Schrum LW, Clemens MG. LPS inhibits endothelin-1-mediated eNOS translocation to the cell membrane in sinusoidal endothelial cells. Microcirculation. 2005;12:433–42. doi: 10.1080/10739680590960377. [DOI] [PubMed] [Google Scholar]
- Nagai T, Yokomori H, Yoshimura K, Fujimaki K, Nomura M, Hibi T, Oda M. Actin filaments around endothelial fenestrae in rat hepatic sinusoidal endothelial cells. Med Electron Microsc. 2004;37:252–5. doi: 10.1007/s00795-004-0262-3. [DOI] [PubMed] [Google Scholar]
- Schermelleh L, Carlton PM, Haase S, Shao L, Winoto L, Kner P, Burke B, Cardoso MC, Agard DA, Gustafsson MG, Leonhardt H, Sedat JW. Subdiffraction multicolor imaging of the nuclear periphery with 3D structured illumination microscopy. Science. 2008;320:1332–6. doi: 10.1126/science.1156947. [DOI] [PMC free article] [PubMed] [Google Scholar]
- Warren A, Cogger VC, Arias IM, McCuskey RS, Le Couteur DG. Liver sinusoidal endothelial fenestrations in caveolin-1 knockout mice. Microcirculation. 2010;17:32–8. doi: 10.1111/j.1549-8719.2009.00004.x. [DOI] [PMC free article] [PubMed] [Google Scholar]
- Warren A, Le Couteur DG, Fraser R, Bowen DG, McCaughan GW, Bertolino P. T lymphocytes interact with hepatocytes through fenestrations in murine liver sinusoidal endothelial cells. Hepatology. 2006;44:1182–90. doi: 10.1002/hep.21378. [DOI] [PubMed] [Google Scholar]
- Wisse W, De Zanger RB, Charels K, Van Der Smissen P, McCuskey RS. The liver sieve: considerations concerning the structure and function of endothelial fenestrae, the sinusoidal wall and the space of Disse. Hepatology. 1985;5:683–692. doi: 10.1002/hep.1840050427. [DOI] [PubMed] [Google Scholar]
- Yokomori H, Oda M, Ogi M, Kamegaya Y, Tsukada N, Ishii H. Endothelial nitric oxide synthase and caveolin-1 are co-localized in sinusoidal endothelial fenestrae. Liver. 2001;21:198–206. doi: 10.1034/j.1600-0676.2001.021003198.x. [DOI] [PubMed] [Google Scholar]
- Yokomori H, Oda M, Yoshimura K, Nagai T, Ogi M, Nomura M, Ishii H. Vascular endothelial growth factor increases fenestral permeability in hepatic sinusoidal endothelial cells. Liver Int. 2003;23:467–475. doi: 10.1111/j.1478-3231.2003.00880.x. [DOI] [PubMed] [Google Scholar]
- Yokomori H, Yoshimura K, Funakoshi S, Nagai T, Fujimaki K, Nomura M, Ishii H, Oda M. Rho modulates hepatic sinusoidal endothelial fenestrae via regulation of the actin cytoskeleton in rat endothelial cells. Lab Invest. 2004;84:857–64. doi: 10.1038/labinvest.3700114. [DOI] [PubMed] [Google Scholar]
Associated Data
This section collects any data citations, data availability statements, or supplementary materials included in this article.


