Abstract
Estimating disease burden in the older population can be problematic, due to a dearth of measurements that take into account population dynamics, small population sizes, and age-related disease distribution issues. Age itself explains a substantial amount of the variability in population disease rates. However, in many common techniques to account for age, such as age standardization and age categorization, age is treated as a nuisance parameter. In this paper, we present a method, the Slope-Intercept Method for Population Log-linear Estimation (SIMPLE), to assess disease burden in the Medicare population of the US. We demonstrate the utility and potential limitations of this straightforward and crude method in assessing age-related morbidity, mortality, and case-fatality on multiple geographic levels. We highlight several examples of when this measure is most applicable using examples abstracted from a comprehensive administrative database of hospitalizations in older adults. Traditional measurements of disease burden are compared to the measurements extracted from this modeling method for comparison purposes. We also present spatial and temporal associations between the two measurements the SIMPLE method produces.
Keywords: methodology, age, elderly, infection, population statistics, demography
1. Introduction
Age is one of the most important risk factors for many diseases [1]. There are many options available to account for age in studies of older adults, although each has its strengths and limitations. Thus, characterizing age-related changes in diseases for the older population remains a constant challenge in biomedical research.
Many of the methods used to account for compositional differences in the age distribution of disease or mortality in older adults use age-specific rates that depend upon age categorization. Age categorization itself has strengths and limitations. One of its major strengths is that age categorization allows the researcher to easily view large-scale changes in morbidity or mortality rates within different age groups across a population or a subset of the population. However, a major weakness of age categorization is that the resulting rates depend upon the location of age boundaries that are, essentially, arbitrarily assigned. An illustration of this limitation is shown in Figure 1. This graph shows the estimated hospitalization rates for pneumonia and influenza for the time period July 2003 through June 2004 by age category for the population age 60 and above. The 20-year age categories are shown in blue (60-79 and 80-99). There are two sets of 10-year age groups, those starting with the digit 0 (red) and those starting with a 5 (green). Five-year age groups are shown with solid black lines. The five-year age groups show an approximately exponential increase in rates with age, although in the 10- and 20-year age groups, this association is harder to discern visually. The 20-year age groupings show an increase from the 60-80 to the 80-99 age group, but given the fact that there are only two such age categories, the pattern of this increase cannot be assessed. There are distinct differences in hospitalization rates comparing the age groups that begin with the 0 to those that begin with a 5, particularly in the older age groups (85+). There is also a 14.3% difference in hospitalization rates between the 5-year age groups 85-89 and 90-94, which is contained entirely within the larger 10-year 85-94 category. These results are indicative of the type of variation that can occur when using age categories. That is, the results largely depend upon the width and position of the age categories used. The resulting differences that can occur from using different sized and located age boundaries could have substantial consequences on the estimation of disease burden, and ultimately, for allocating public health resources.
Figure 1.
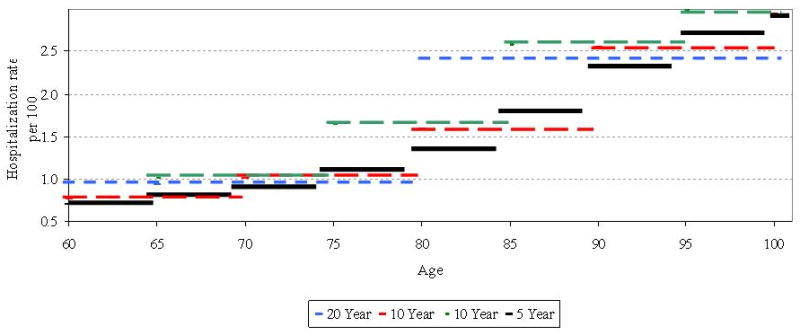
Age-specific hospitalization rates for pneumonia and influenza by width of age interval for 2003-2004
2. Age Standardization
One of the most commonly used methods to account for differences in the age distribution of disease and mortality is age standardization. Standardizing rates generally entails applying age-specific rates or counts comparing two or more populations using a single, common population standard. There are two types of standardization: direct and indirect. Although useful and practical to alleviate the issue of compositional differences among populations under study, can lead to different conclusions based on the standard chosen [2,3], as well as the boundaries for the age groupings. From a conceptual standpoint, standardization treats age essentially as a nuisance variable. However, in the older population, age itself accounts for a considerable portion of the variability in disease susceptibility [4,5]. The technique of age standardization does not attempt to quantify the contribution of age to disease rates, which is an important part of disease distribution in the older population.
3. The Slope-Intercept Method for Population Log-linear Estimation
Quantifying the increase in disease rates with age in the older population is challenging, as the exact nature of the increase varies by disease. Complicating this task is the need to have not just some measure of disease burden that capitalizes on the approximate exponential increase of rates with age in many diseases, but the measure should be meaningful in and of itself. This section will explain the Slope-Intercept Method for Population Log-linear Estimation (SIMPLE) of disease burden in the older population as a method for quantifying the age acceleration in disease rates and using that measure to estimate disease burden in the population of adults age 65 and above using data extracted from Medicare hospitalization claims.
3.1. Data Sources and Statistical Analysis
Approximately 52 million hospitalization records of were abstracted from the Centers for Medicare and Medicaid Services (CMS) from the US Department of Health and Human Services MEDPAR database. Data were available for the population age 65 and over for the period 2003-2006. Total cases were tabulated by state, region, single year of age, and month. Corresponding population counts by state, region, single year of age were obtained from the Population Estimates Program of the US Census Bureau from 2003 through 2006 for ages 65 to 99. The total number of cases in each state or region, year, and age was divided by the corresponding population to estimate hospitalization incidence. Cases were then categorized by International Classification of Disease (ICD-9CM) code and tabulated by state, region, single year of age, and month. The broad causes of mortality examined in this study were injuries (ICD codes 800-999), cancer (ICD codes 140-239), respiratory illnesses (ICD codes 480-487), and all-cause hospitalizations (all ICD codes).
Hospitalization rates of many diseases increase nearly exponentially with age in the 65+ population. For this reason, the SIMPLE approach was employed, which takes the log of the age-specific cause-specific mortality rates, which are regressed against a function of age to obtain a set of slopes and intercepts for each state or region and year, according to the model below in Equation 1.
| [1] |
The SIMPLE approach produces two complementary population measures. First, β0ij, the intercept, denotes the log of the estimated hospitalization rate for influenza and influenza-related disease in the older population at age 65 for each state or region and influenza season. The slope extracted from the model, β1ij, is the log of the rate of change in hospitalization rates with age for each influenza season and state or region. SAS version 9.1 (Cary, NC) was used for all analyses, and where applicable, statistical significance was defined as p ≤ 0.05.
3.2. Model Diagnostics: Respiratory Infections Example
To assess validity of this method and to determine whether this method accurately and precisely provides reliable estimates for the true influenza incidence, we obtained R-squared values for each of the models, individually by state and season. We then compare and contrast several aspects of the method and its associated measures, including a comparison of geographic levels, as well as temporal trends.
When log-transformed age-specific mortality rates from respiratory infections are regressed against age, we get the result shown in Figure 2. The method produces two summary measures of cause-specific mortality, the slope and the intercept, as described above.
Figure 2.
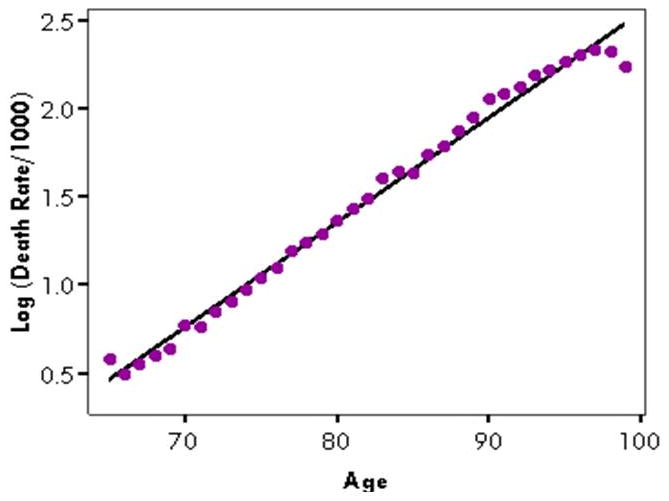
Illustration of SIMPLE: The log of cause-specific mortality rate from respiratory infections against age: United States, 2003-04
The goodness-of-fit generally depends upon the geographic a level being assessed. For different geographical levels, the R-squared value for the entire US ranged from 0.981 to 0.995 for respiratory infections, depending upon the year. For Census-defined regions, the R-squared values of the model ranged from 0.979 to 0.991. For states, there was much more variability. R-squared values for respiratory infections ranged from 0.702 in Wyoming to 0.977 in California.
Goodness-of-fit also varied by the length of the time span being assessed. For the national data, the R-squared value for all four years combined was 0.994, ranging from 0.984 to 0.995 for individual years, and from 0.896 to 0.976 when assessed by month. Interestingly, R-squared values tended to be highest in the months generally associated with the “flu season,” between October and March, while R-squared values were lower in the summer months. These seasonal patterns in cause-specific mortality slopes were not as apparent for other causes, although there was some seasonality observable for all-cause hospitalizations. It should be noted, however, that R-squared is a measure of linearity, and as such, the observed R-squared values may be high because of a curvilinear relationship between age and disease rates.
The residuals themselves often have distinct patterns that illustrate properties of the morbidity curves (Figure 3). From age 66 to approximately age 90, residuals tended to increase, suggesting that the smoothed or predicted values from the SIMPLE model are higher than the actual values in the younger 65+ population, but lower than the actual rates in the oldest of the older population. Above age 90, the residuals actually decrease, suggesting that the rate of increase in diseases with age decelerates above a certain age threshold. It is interesting to note that the residual value is highest at age 65, which is likely due to the fact that Medicare eligibility generally starts at age 65, suggesting that there may be an apparent increase in hospitalizations upon reaching the age of Medicare eligibility. Although the residual is high in this example, the actual age-specific rate at age 65 is similar to the rate at age 67 or 68, and in absolute terms, among the lowest rates found on the age spectrum. If the rate at age 65 is omitted from the model, residual patterns with respect to age remain as is, except that the magnitude of the residuals tends to decrease somewhat, and the resultant R-squared values from the SIMPLE models increase.
Figure 3.
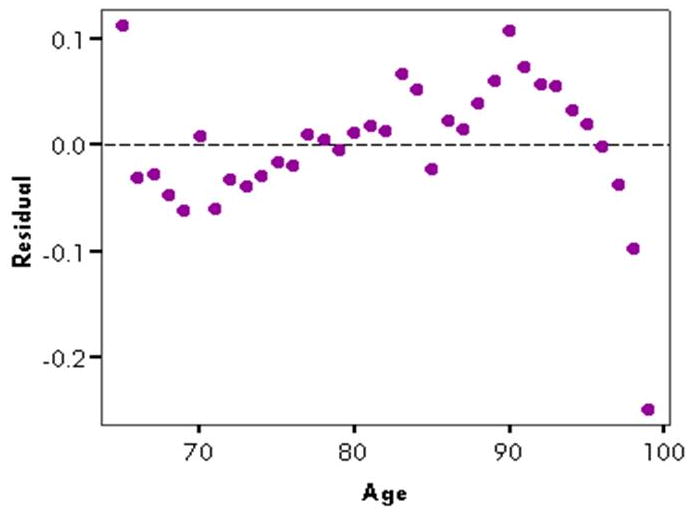
Residuals from above regression of log of respiratory infection-associated hospitalization rate against age, US, 2003-04
4. Model Specifications
4.1. Parameter Interpretations
The SIMPLE procedure is essentially a simple linear regression, meaning the model contains the outcome variable, log rate of disease by single year of age, and one exposure variable, age – 65. The model produces two parameter estimates, the intercept and the slope. The intercept is comparatively easy to interpret: it represents the natural logarithm of the smoothed or expected disease rate or incidence at age 65. The value is considered “expected” because it is a model parameter and not the actual value of disease rate at age 65. Furthermore, the intercept is a particularly informative parameter estimate when using Medicare data because it represents approximately the expected rate of disease if there were no artificial increase in disease rates at age 65 due to the onset of Medicare eligibility, as discussed above. The difference between the actual disease rate at age 65 and the exponentiated intercept could be considered the “excess” disease burden brought about by Medicare eligibility when using these data for population disease burden estimation.
The slope, or age acceleration coefficient, is comparatively more difficult to interpret than the intercept. On the log scale, the slope can be considered to be the expected increase in disease rates for each one-year increase in age. When exponentiated, the slope represents the multiplicative increase in disease rates for each one-year age interval. Consider a case where the slope is 0.025. This means that for each one year increase in age, the disease rate would change by a factor of exp(0.025), which is equal to 1.025, representing a 2.5% increase. For a ten-year age interval, this change would be [exp(0.025)]10 or 1.284, or a 28.4% increase. The predicted value of a disease rate at a given age a would therefore be exp[β0ij + (a − 65)β1ij].
4.2. Univariate Statistics for Model Parameters
The univariate statistics for the 12-month period from July 2003 to June 2004 for the slope and intercept from the SIMPLE model, as well as the age-adjusted rate of respiratory infections are shown in Table 1. Boxplots for the years 1995-96 through 2003-04 are shown in Figure 4. The intercept and slope are somewhat left-skewed, although the skewness was not statistically significant. The age-adjusted rates were not skewed in either direction, although in the earlier years, there was some right-skew observed. The slope parameter increased for the first several years, then decreased over the last four years, while the intercept parameter estimates generally increased slowly over the period of study. Age-adjusted disease rates in the population age 65 and above also increased slowly throughout the nine year study period.
Table 1. Univariate statistics for the parameter estimates and the age-adjusted disease incidence rate for states, July 2003-June 2004.
| Measurement | Mean | Std. Deviation | Min-Max | Skewness |
|---|---|---|---|---|
| Age Acceleration (slope) | 0.074 | 0.006 | 0.057-0.088 | -0.14 |
| Log of Rate at age 65 (intercept) | 2.77 | 0.30 | 2.06-3.40 | -0.33 |
| Age-adjusted rate per 1000 | 41.4 | 10.9 | 16.0-65.2 | 0.01 |
Figure 4.
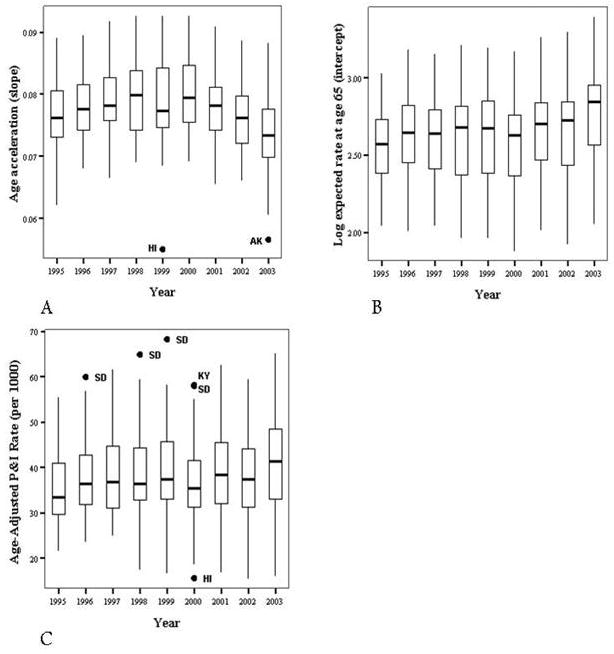
Annual distributions of slope (Panel A), intercept (Panel B), and age-adjusted rates (Panel C) by state and year
4.3. Bivariate Associations with Known Measures
The slopes and intercepts produced from the SIMPLE models are related to more commonly used measurements of disease burden in older adults, including crude, age-adjusted, and age-specific disease rates. Spearman correlation coefficients by state for the time period July 2003 through June 2004 are displayed in Table 2. The intercept parameter is highly and positively correlated with many of the common measures used to assess population disease burden in surveillance systems. It is closely associated with both the crude and age-adjusted measures of disease rates. The intercept is even more strongly associated with the age-specific rate in the 65-74 age group. The strength of the associations between the intercept and the age-specific rates decreases (p < 0.001 for trend) as age increases, which may not be surprising given that the intercept is an estimate of disease at age 65, which is included in the 65-74 age group. However, the slope parameter is weakly and negatively associated with many of the common measures of disease burden. There was a significant negative association between the disease rates in the 65-74 age group and the slope, but the magnitude was low (-0.335) compared to those for the intercept. There was a moderately strong but significant negative association between the slope and the intercept parameters themselves. Similar associations were found for other years and other diseases, including all hospitalizations.
Table 2.
Spearman correlation coefficients for SIMPLE model parameters (intercept and slope) and more commonly used measurements, for states, July 2003-June 2004
| Intercept | Slope (age acceleration) | |
|---|---|---|
| Crude rate in 65+ | 0.934 (< 0.001) | -0.155 (0.278) |
| Age-adjusted rate in 65+ | 0.935 (< 0.001) | -0.155 (0.278) |
| Rate in 65-74 | 0.986 (< 0.001) | -0.335 (0.016) |
| Rate in 75-84 | 0.952 (< 0.001) | -0.211 (0.137) |
| Rate in 85+ | 0.875 (< 0.001) | -0.017 (0.904) |
| Intercept | -0.416 (0.002) | |
| Slope (age acceleration) | -0.416 (0.002) |
5. Applications of the SIMPLE Approach I: Cause-Specific Hospitalizations
There are numerous applications of the SIMPLE approach in disease surveillance, particularly in the description of disease patterns in the older population. One such application is the comparison of cause-specific mortality rates using Medicare hospitalization data. Dividing all US hospitalizations into the three broad disease categories described in Section 3.1—injuries, cancer, and respiratory infections—and all-cause mortality, we can use the SIMPLE procedure to compare causes of death in the older population.
Taking a small subset of the Medicare data for four years, 2003-2006, the slopes for each year are shown in Figure 5. The disease group with the highest slopes throughout the four years was respiratory infections, followed by injuries. Cancers had the lowest age-acceleration of disease. However, for intercepts, the differences between cause-specific mortality are the inverse for those of the slopes. While mortality from cancer had the shallowest slopes, cancer mortality was highest for the intercept among the three causes of death. Injuries had the next highest intercept level, followed by respiratory disease.
Figure 5.
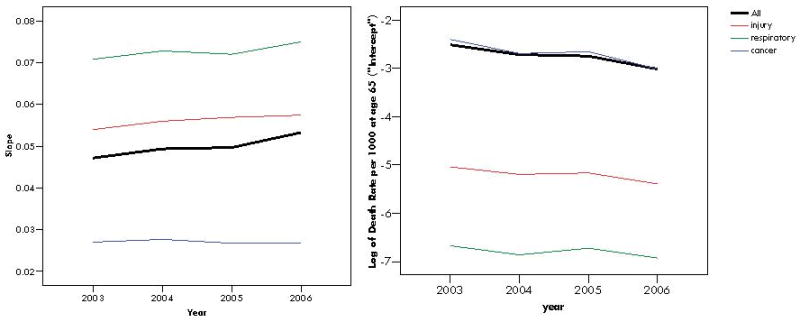
Rate-acceleration slopes (left) and intercepts (right), or log of expected cause-specific mortality rate at age 65, for all-cause mortality and three cause-specific forms of mortality: injuries, respiratory infections, and cancers by year, US, 2003-06
Slopes and intercepts obtained from the SIMPLE models provide quantitative and immediately informative summary measures of disease burden in the older population. The intercept can be considered to be a baseline level of cause-specific mortality in the older population. In the case of Medicare hospitalizations, the baseline level, at age 65, of cancer-associated deaths is nearly 90 times higher than the baseline level of deaths associated with respiratory infections in some years. However, the rate of increase of respiratory infection-associated deaths with age is nearly three times higher than the rate of increase for cancer-associated deaths. For estimating population burden of disease and cause-specific mortality, the risk of death due to cancer is higher than the risk of death due to respiratory infections in hospitalized patients. However, the risk of mortality associated with respiratory infections increases with age far more rapidly than the risk of mortality associated with cancer. In other words, cancer-associated mortality is less dependent upon age than respiratory infection-associated mortality, but the overall level of cancer-associated mortality is substantially higher.
6. Applications of the SIMPLE Approach II: Assessing Spatial and Temporal Trends
The SIMPLE approach can be used to address more nuanced morbidity and mortality patterns in disease surveillance. This section will describe two additional examples of how this methodology and its associated summary measures of disease burden to evaluate spatial and temporal trends.
6.1. Spatial Trends Example: State-Level Mortality
One example of the use of the SIMPLE procedure is to estimate cause-specific mortality in Medicare hospitalizations. In this example, the initial outcome variable was not the age-specific hospitalization rate, but the age-specific proportion of hospitalizations due to each disease who died. The final outcome measurements—the slope and the intercept measuring the age acceleration in age-specific mortality—vary substantially by both time and space. The geographic distributions of cancer-specific mortality rate slopes and intercepts are shown in Figure 6. These maps illustrate two important patterns in the data. First, as described above, states with high intercepts tend to have lower slopes, and vice versa. Second, there is considerable variation among states in the magnitude of the slope and the intercept. Rhode Island, the state with the highest slope (0.030) has nearly three times the slope of the contiguous state with the lowest slope, South Carolina (0.011). These results demonstrate the properties and trends in cause-specific mortality in the older population. In states such as California and many northeastern states, where the slope is high and the intercept is low, this means that cancer-specific mortality is generally low, but increases more rapidly with age than other states. In many of the southeastern states, the opposite is true. This means that while the overall level of cancer-specific mortality in those states is high, the increase in rates with age is not as pronounced as it is in California and some northeastern states. Another possibility is regression toward the mean, rather than a real, biological phenomenon. It is possible that random variation may lead to an over/under estimate of intercept, then the SIMPLE model's attempt to fit conditions at other ages would lead to a corresponding under/over estimate of slope.
Figure 6.
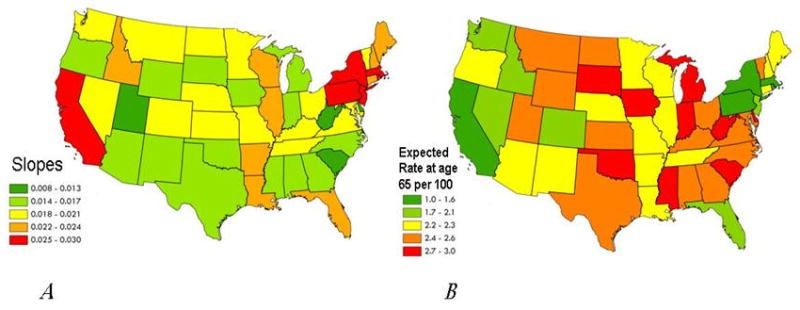
Geographic distributions of slopes (Panel A) and exponentiated intercepts (Panel B) for cancer-specific mortality rates, 2003-06
6.2. Temporal Trends Example: Seasonality of Cause-Specific Morbidity
Another example of the utility of the SIMPLE procedure is to describe large-scale seasonal patterns of disease in the older population using surveillance data. This example uses cause-specific hospitalizations as a measure of morbidity, in contrast to the mortality measurements used in Section 6.1. In this example, cause-specific slopes and intercepts are calculated for the US as a whole by month for the time period 2003-2006. The three diagnostic categories explored in previous sections are illustrated here—cancer, injuries, respiratory infections—along with all-cause hospitalizations per 1,000.
The time-series graphs of the slopes and intercepts are shown in Figure 7. The slopes are highest for all-cause hospitalizations and are lowest for cancer, followed by respiratory infections (P&I) and injuries. The all-cause hospitalization slopes showed extreme seasonality, with peaks generally during the winter months, and annual nadirs in mid- to late-summer. Respiratory infections also showed a seasonal peak corresponding with the peak in all-cause hospitalizations. Injuries also tend to peak in winter, but the amplitude is generally lower than that of respiratory infection-associated hospitalizations and all-cause hospitalizations. The shape of the seasonal waves of respiratory infection-associated hospitalizations tends to be more symmetric than the seasonal waves of all-cause hospitalizations. That is, the time between a peak and a nadir tends to be approximately equal to the time between that nadir and the next seasonal peak, which is not as evident in all-cause hospitalizations. For intercepts, the trends are the same with respect to timing of seasonality, but the directionality is nearly exactly opposite to that of the slopes. Intercepts are lowest for all-cause hospitalizations and respiratory infection-associated hospitalizations during the winter months, and highest in the summer months.
Figure 7.
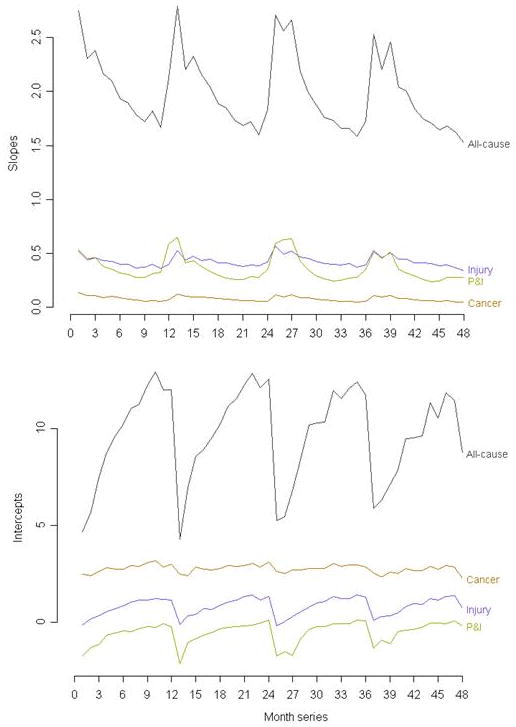
Time-series graphs of slopes (above) and intercepts (below) for three causes of hospitalizations, and all-cause hospitalizations
The results of the respiratory infection-associated hospitalizations are consistent with the results of other studies of pneumonia and influenza showing seasonality with distinct peaks in the winter months [6,7]. Despite the fact that the intercept is more strongly associated with age-adjusted and age-specific disease rates than is the slope, the slope tends to follow the pattern that resembles past studies of age-specific and age-adjusted respiratory infection rates in the older population.
These findings paint a more complete picture of disease in the older population, based on population-level administrative surveillance data on hospitalizations. These results suggest that in the three influenza seasons contained in this analysis, respiratory infections may be more severe in the oldest adults more so than in the younger population of those age 65+, as evidenced by the sharp increases in respiratory infection-associated and all-cause hospitalizations slopes in older adults.
7. Discussion
The Slope Intercept Method for Population Log-Linear Estimation is a descriptive tool that can be used to assess the age-associated patterns of morbidity and mortality in the older population using administrative or other types of surveillance data. The method has numerous applications in biosurveillance and biomedical research, and bridges concepts from many public health and medical disciplines, including epidemiology, biostatistics, and demography.
However, there are several limitations of the SIMPLE procedure. First, the method requires that age-specific counts or rates of disease are known. Often, this degree of detail is not available in many disease surveillance systems. Second, the goodness-of-fit is largely dependent upon the size of the geographic unit of analysis. Generally, the smaller the geographic unit is to be analyzed, the weaker the association is between the data points and the best-fitting line from the SIMPLE regression model. The method, while capturing a significant proportion of the variability in age-specific morbidity or mortality, does not account for the slight deviations from a perfectly exponential increase in age-specific rates. The SIMPLE measurements do provide two key elements of the disease or mortality burden in older adults, although they do not capture the more nuanced patterns evident in the data. The linear fit is intended to provide an easily attainable, albeit crude, approximation of an important property of disease distribution in older adults, and is, at beast, an approximation of the true age-related trends.
Despite these limitations, the SIMPLE models can be used in a variety of applications surrounding the estimation of age-specific disease patterns in the older population. This paper presented data from a period perspective; disease or mortality burden was assessed during a given time frame for all ages. If additional years of data were available, the SIMPLE models could be used to assess not only period-specific morbidity and mortality, but could also be used to follow cohorts of older adults over time to determine cohort-specific morbidity and mortality patterns.
Another adaptation of the SIMPLE model is to account for the fact that population size decreases rapidly with age in the older population by weighting the data by a function of population size. Doing so would provide more weight to those ages—namely the younger ages—who have larger population sizes. The models presented in this paper used unweighted simple linear regression, which weights the data points at age 99 the same as the data points at age 65, despite the population size at 99 being just over 1% of the population size of those age 65. Additionally, the slopes and intercepts generated by the SIMPLE models may be used as measurements in additional statistical analyses. For instance, monthly slopes or intercepts could be compared to detect statistical differences in disease burden across states or to test related hypotheses.
This paper illustrates the flexibility of this method to examine morbidity, mortality, and an adaptation of case-fatality on the population level using a comprehensive database of hospitalizations in the older population. Further development and refinement of the SIMPLE models is necessary to meet the needs of biosurveillance and public health research. The method may have particular appeal to applied public health researchers who seek a straightforward and meaningful assessment of disease burden in the population.
Acknowledgments
We gratefully acknowledge our funding source, NIH-NIAID U19 AI62627 and HHSN266200500032C. We also thank Ms. Julia Wenger of Tufts School of Medicine for their assistance with this research.
References
- 1.Fry AM, Shay DK, Holman RC, Curns AT, Anderson LJ. Trends in hospitalizations for pneumonia among persons aged 65 years or older in the United States, 1988-2002. Journal of the American Medical Association. 2005;294:2712–2719. doi: 10.1001/jama.294.21.2712. [DOI] [PubMed] [Google Scholar]
- 2.Robson B, Purdie G, Cram F, Simmonds S. Age standardisation - an indigenous standard? Emerging Themes in Epidemiology. 2007;4:3. doi: 10.1186/1742-7622-4-3. [DOI] [PMC free article] [PubMed] [Google Scholar]
- 3.Krieger N, Williams DR. Changing to the 2000 standard million: are declining racial/ethnic and socioeconomic inequalities in health real progress or statistical illusion? American Journal of Public Health. 2001;91:1209–13. doi: 10.2105/ajph.91.8.1209. [DOI] [PMC free article] [PubMed] [Google Scholar]
- 4.Robertson C, Boyle P. Age-period-cohort analysis of chronic disease rates. I: Modelling approach. Statistics in Medicine. 1998;17:1305–23. doi: 10.1002/(sici)1097-0258(19980630)17:12<1305::aid-sim853>3.0.co;2-w. [DOI] [PubMed] [Google Scholar]
- 5.Christensen KL, Holman RC, Steiner CA, Sejvar JJ, Stoll BJ, Schonberger LB. Infectious disease hospitalizations in the United States. Clinical Infectious Disease. 2009;49:1025–35. doi: 10.1086/605562. [DOI] [PubMed] [Google Scholar]
- 6.Viboud C, Bjørnstad ON, Smith DL, Simonsen L, Miller MA, Grenfell BT. Synchrony, waves, and spatial hierarchies in the spread of influenza. Science. 2006;312:447–51. doi: 10.1126/science.1125237. [DOI] [PubMed] [Google Scholar]
- 7.Serfling RE. Methods for current statistical analysis of excess pneumonia-influenza deaths. Public Health Reports. 1963;78:494–506. [PMC free article] [PubMed] [Google Scholar]


