

Abstract
Huntington's disease (HD), caused by a CAG repeat expansion in the huntingtin (HTT) gene, is characterized by abnormal protein aggregates and motor and cognitive dysfunction. Htt protein is ubiquitously expressed, but the striatal medium spiny neuron (MSN) is most susceptible to dysfunction and death. Abnormal gene expression represents a core pathogenic feature of HD, but the relative roles of cell-autonomous and non-cell-autonomous effects on transcription remain unclear. To determine the extent of cell-autonomous dysregulation in the striatum in vivo, we examined genome-wide RNA expression in symptomatic D9-N171-98Q (a.k.a. DE5) transgenic mice in which the forebrain expression of the first 171 amino acids of human Htt with a 98Q repeat expansion is limited to MSNs. Microarray data generated from these mice were compared with those generated on the identical array platform from a pan-neuronal HD mouse model, R6/2, carrying two different CAG repeat lengths, and a relatively high degree of overlap of changes in gene expression was revealed. We further focused on known canonical pathways associated with excitotoxicity, oxidative stress, mitochondrial dysfunction, dopamine signaling and trophic support. While genes related to excitotoxicity, dopamine signaling and trophic support were altered in both DE5 and R6/2 mice, which may be either cell autonomous or non-cell autonomous, genes related to mitochondrial dysfunction, oxidative stress and the peroxisome proliferator-activated receptor are primarily affected in DE5 transgenic mice, indicating cell-autonomous mechanisms. Overall, HD-induced dysregulation of the striatal transcriptome can be largely attributed to intrinsic effects of mutant Htt, in the absence of expression in cortical neurons.
INTRODUCTION
The widespread expression of the huntingtin (Htt) protein in Huntington's disease (HD) immediately raises the question of the etiology of the selective vulnerability that is observed in distinct populations of neurons in this disease. Although there is increased recognition of vulnerability of neurons outside the striatum, the medium size spiny neuron (MSN) remains the most affected neuronal subtype. The regional distribution of the described huntingtin-interacting proteins does not adequately explain this specificity (1–3), and therefore the question of ‘murder versus suicide' persists. Does the mutation in huntingtin act cell autonomously, leading to dysfunction and degeneration of MSNs, i.e. ‘suicide'? Or, does the mutation act non-cell autonomously, and more specifically, does mtHtt-induced dysfunction of cortical neurons lead to MSN dysfunction and degeneration, i.e. ‘murder'? There is evidence to support both mechanisms, and it is highly likely that the two combine to create MSN dysfunction, and ultimately, death. For therapeutic reasons, it remains critical to determine which gene alterations are cell autonomous, and which are non-cell autonomous.
Transcriptional abnormalities appear to represent a core pathological feature of HD (4,5) and genes showing enriched expression in the striatum, including PPP1R1B, PENK, NGEF and DRD2, appear to be especially affected by the mutant Htt protein (6). Data obtained, however, have stopped short of differentiating cell-autonomous versus cell non-autonomous effects on gene transcription in vivo. Nonetheless, evidence in favor of cell-autonomous effects include that lentiviral-mediated delivery of mutant Htt to rat striatum results in a progressive pathology characterized by the appearance of ubiquitinated Htt aggregates, loss of dopamine- and cAMP-regulated phosphoprotein of 32 kDa (DARPP-32) staining and cell death (7,8) and cultured striatal cells in which mutant Htt fragments are expressed show gene expression deficits similar to those observed in human HD subjects (9,10). Given that in vitro conditions may not accurately represent the in vivo environment, especially in terms of the normal development of striatal neurons and their afferent and efferent projections, we sought to determine the extent of cell-autonomous transcriptional dysregulation in vivo.
We previously generated an HD transgenic mouse ‘model’, D9-N171-98Q (a.k.a. DE5), in which the forebrain expression of the first 171 amino acids of human Htt with a 98Q repeat expansion is limited to MSNs of the striatum (11). These mice exhibit an HD-like phenotype, including failure to gain weight after 10 months of age, motor impairment, the presence of intranuclear inclusion bodies and disrupted expression of several striatal-enriched genes. Here we have examined genome-wide gene expression patterns in symptomatic DE5 transgenic mice to determine which transcripts are cell-autonomously dysregulated in the striatum. We compared these results with microarray data generated on the identical array platform from R6/2 transgenic mice carrying two different CAG repeat lengths (150 and 300), and with cultured MSNs expressing mutant Htt and full-length HD models, to further highlight pathways that may be dysregulated on a non-cell-autonomous basis. Our findings demonstrate that HD-induced dysregulation of the striatal transcriptome can be fundamentally attributed to intrinsic effects of mutant Htt.
RESULTS
D9-N171-98Q transgenic mice
We have developed transgenic mice, D9-N171-98Q (subsequently referred to as DE5), which, within the forebrain, selectively express a pathogenic Htt species in the MSNs of the striatum, specifically excluding the neocortex (11). We have shown that these mice develop abnormal characteristics of pan-cellular HD mouse models, including intranuclear inclusion bodies, failure to gain weight after 10 months of age and behavioral impairment, particularly on the rotarod apparatus. Here we investigated the striatal genome-wide expression profiles of these mice at 14 months of age using microarray analysis. Overall, 1371 genes were found to be altered in their expression in the striatum of DE5 mice compared with wt controls [740 down-regulated; 631 up-regulated; P-value < 0.05; abs (Log2 ratio) >0.10; Supplementary Material, Table S1].
Perhaps as expected, a highly significant decrease in the expression of genes showing striatal-enriched expression (12) was detected in DE5 transgenic mice (n= 26 genes; P= 2.1E-15) (Table 1). These genes include prodynorphin (Pdyn), protein phosphatase 1, regulatory (inhibitor) subunit 1B (Ppp1r1b: a.k.a. DARPP-32), A2a adenosine receptor (Adora2a), the dopamine D2 receptor (Drd2) and proenkephalin (Penk), all whose decreases in expression were validated by qPCR in our previous publication (11). This is consistent with findings from human subjects with HD (4,6) and other HD transgenic mouse and cell culture models (13–16), including other systems expressing a similar Htt fragment (N171-82Q) (9,15). These findings indicate large-scale molecular dysfunction in the striatum of DE5 mice. Of note, whereas changes in gene expression in pan-neuronal models included decreases in many striatal-enriched, interneuron-selective genes (Sst, Npy, Pvalb, Cck and Nos1), parallel changes were absent from DE5 striata (with Pvalb mRNA actually showing increased instead of decreased expression).
Table 1.
Striatal-enriched genes showing altered expression in DE5 transgenic mice
| Gene ID | Gene description | Accession# | Log2 ratio | P-value |
|---|---|---|---|---|
| Actn2 | Alpha-actinin 2 | NM_033268 | −0.229 | 0.00135 |
| Adora2a | Adenosine A2 receptor | NM_009630 | −0.199 | 0.04774 |
| Arpp21 | Cyclic AMP-regulated phosphoprotein, 21 | NM_033264 | −0.116 | 0.04151 |
| Baiap2 | BAI1-associated protein 2 | NM_130862 | −0.301 | 0.00796 |
| Bcl11b | B-cell leukemia/lymphoma 11B | NM_021399 | −0.259 | 0.04091 |
| Calb1 | Calbindin 1 | NM_009788 | −0.116 | 0.04354 |
| Dgke | Diacylglycerol kinase | NM_019505 | −0.268 | 0.00779 |
| Drd2 | Dopamine D2 receptor | NM_010077 | −0.384 | 0.0402 |
| Gng7 | Gamma 7 subunit | NM_010319 | −0.426 | 0.00596 |
| Hpca | Hippocalcin | NM_010471 | −0.279 | 0.005 |
| Klf16 | Kruppel-like factor 16 | NM_078477 | −0.493 | 0.00052 |
| Ngef | Neuronal guanine nucleotide exchange factor | NM_019867 | −0.179 | 0.00187 |
| Pde10a | Phosphodiesterase 10A | NM_011866 | −0.302 | 0.00562 |
| Pde1b | Phosphodiesterase 1b | NM_008800 | −0.334 | 0.00013 |
| Pdyn | Prodynorphin | NM_018863 | −0.408 | 0.00101 |
| Penk | Enkephalin | NM_001002927 | −0.31 | 0.00479 |
| Ppp1ca | Protein phosphatase 1, catalytic subunit, alpha | NM_031868 | −0.349 | 0.0033 |
| Ppp1r1b | DARPP-32 | NM_144828 | −0.288 | 0.00929 |
| Rarb | RAR beta receptor 1 | NM_011243 | −0.269 | 0.0411 |
| Rasgrp2 | RAS, guanyl releasing protein 2 | NM_011242 | −0.123 | 0.00902 |
| Rin1 | Rab/Ras Inhibitor | NM_145495 | −0.385 | 4.00E-05 |
| Rgs9 | Regulator of G-protein signaling 9 | NM_011268 | −0.489 | 0.00069 |
| Rxrg | Retinoid X receptor gamma | NM_009107 | −0.421 | 0.00254 |
| Scn4b | Sodium channel, type IV, beta | BK001031 | −0.642 | 0.00081 |
| Tesc | Tescalcin | NM_021344 | −0.544 | 0.00031 |
| Zfp521 | Zinc finger protein 521 | NM_145492 | 0.247 | 3.00E-05 |
Direct comparisons with pan-neuronal HD mouse models
We compared striatal genome-wide expression profiles of symptomatic DE5 mice with those from two different lines of R6/2 transgenic mice, carrying either ∼150 CAG repeats, ‘Q150 mice’ (6 weeks of age), or ∼300 CAG repeats, ‘Q300 mice’ (5 months of age). These data were generated on the same Illumina platform [Q300 from (17) and Q150, this study] and analyzed in an identical manner in order to allow for qualitative and quantitative comparisons with our DE5 mouse data set. To visualize the correlation of fold-change and to consider the specific direction of change (increased versus decreased), these features are shown in scatter plots (Fig. 1) and Venn diagrams (Fig. 2). We found a highly significant overlap of differentially expressed probe sets among the three mouse strains, with the greatest similarity occurring between DE5 and R6/2-Q300 mice, with an overlap of 415 probe set IDs (P< 4.29E-22) representing ∼30% of all differentially expressed probe sets in DE5 transgenic mice. Overall, high concordance is observed in the direction of the expression change when comparing DE5 transgenic mice with either R6/2 line; however, the magnitude of the expression changes for both up- and down-regulated genes is smaller in the DE5 transgenic mice compared with either R6/2 strain. The top-ranked expression differences present in all three mouse models are shown in Table 2, along with a color-coded designation of direction and magnitude of change. Perfect concordance was observed for all genes, except Bin1, which was decreased in expression in DE5 transgenic and R6/2-Q150 transgenic mice, but elevated in expression in R6/2-Q300 transgenic mice (Table 2).
Figure 1.

Scatterplots showing concordant and discordant changes of the overlap of differentially expressed genes between DE5 transgenic and the R6/2 lines. Log2 ratios for the gene expression changes for each comparison are shown, with each circle representing an individual gene. (A) Overlap between DE5 and R6/2-Q150 transgenic mice (n= 392 genes); (B) overlap between DE5 and R6/2-Q300 transgenic mice (n= 511 genes).
Figure 2.

Venn diagrams depicting overlap between DE5, R6/2-Q150 and R6/2-Q300 for both down-regulated and up-regulated genes.
Table 2.
Top expression changes significantly altered in all three HD mouse lines
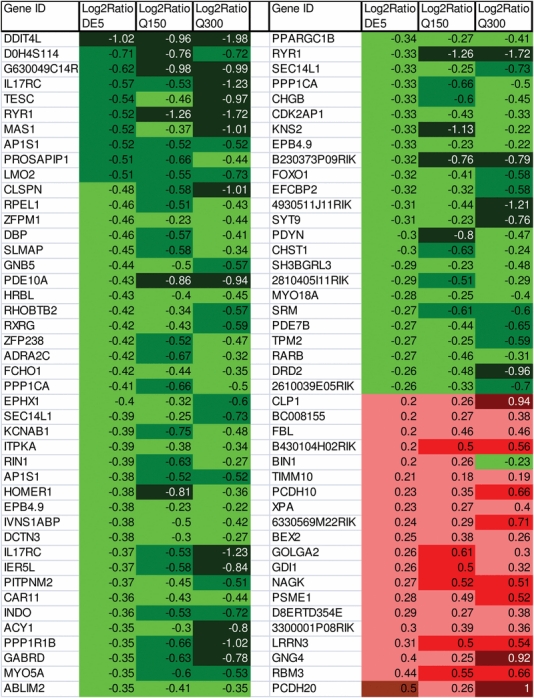 |
The top-ranked gene expression changes present in all three mouse models are shown according to UniGene ID symbol, along with a color-coded designation of direction and magnitude of change.
We also compared expression profiles from DE5 transgenic mice with those from older R6/2 mice [Q150 at 12 weeks of age, using previously published data (13)]. Direct comparisons should consider the caveat that this microarray data set was performed on an Affymetrix platform and necessarily analyzed by an alternative method. Nevertheless, ∼50% of the genes (n= 821) found to be differentially expressed in DE5 mice were also significantly altered in these later-stage R6/2 mice [Supplemental data sets 1 and 2 from (13)]. A list of genes altered in DE5 but not in either R6 model is supplied in Supplementary Material, Table S2.
Comparisons with in vitro striatal neurons overexpressing mutant human Htt
Previous studies have examined transcriptome-wide changes in rat primary striatal neurons expressing a similar N-terminal fragment of the human mutant Htt protein (the first 171 amino acids with an 82Q repeat expansion) (9). We compared gene expression changes manifested in DE5 transgenic mice with those exhibited in the Htt171-82Q-expressing striatal neurons after correcting for species and microarray platform differences and reanalyzing both microarray data sets by the same method (see Materials and Methods). We identified 126 gene expression changes that were highly concordant between in vivo and in vitro data (Supplementary Material, Table S3). This list included several striatal-enriched genes, such as Ppp1r1b, Baiap2, Adora2a and Ngef.
Correlations to human HD gene expression and full-length HD mouse models
In order to determine to what extent the DE5 mice recapitulate the gene expression profiles detected in human HD, we compared gene transcriptome profiles from the striatum of DE5 transgenic mice with previously published microarray data from human HD caudate samples (4). Human orthologs of the top 200 differentially expressed mouse genes in the striatum (including both increases and decreases) were mapped and their expression differences screened in the published human HD data set (4). A concordance coefficient was calculated taking into account concordant, as well as discordant, changes as described previously (4). The concordance coefficient for our data set was 0.388 for down-regulated genes and 0.201 for all genes, which is consistent with previous studies reporting statistically significant concordant coefficients for other HD mouse models of 0.190–0.490 (4,18). Hence, our findings indicate that DE5 transgenic mice demonstrate a strong recapitulation of gene expression changes observed in human patients with HD.
Microarray data from full-length HD models have also been generated on the Affymetrix platform, where it was shown that several full-length models at late stage share significant gene expression changes with the R6/2 transgenic lines (13). Accordingly, our DE5 mice also show overlapping gene expression changes with these HD models; the greatest overlap was observed with the 22-month CHL2Q150/Q150 mice where 248 (30%) down-regulated genes and 178 (24%) up-regulated genes were shared between both models (Fig. 3 and Supplementary Material, Table S4).
Figure 3.

Venn diagrams depicting overlap between DE5, Hdh (Q92/Q92) and CHL2 (Q150/Q150) for both down-regulated and up-regulated genes.
Molecular features of cell autonomy
To probe the contributions of cell-autonomous mechanisms to striatal pathology, we more closely examined those genes that were significantly disrupted in the striatum of DE5 transgenic mice and/or either of the R6/2 mouse lines. To this end, we performed Gene Ontology (GO) screening of the genes significantly altered in each mouse model, which revealed both common and distinct functional categories associated with DE5 and R6/2 transgenic mice. All three models showed significant association with signal transduction and calcium signaling. However, only DE5 transgenic mice were associated with protein transport, axonogenesis and RNA splicing (Fig. 4). Consistent with these findings, previous GO screening of genes significantly altered in the Htt171-82Q-expressing striatal neurons also revealed biological associations to neuronal signaling and divalent cation transport, as well as RNA splicing/RNA processing and neurite development (9). Gene expression changes in R6/2-Q150 mice were uniquely related to categories of cell death and apoptosis (Fig. 4), which might be connected to their rapid disease progression and shorter lifespan compared with either R6/2-Q300 mice or DE5 transgenic mice.
Figure 4.

GO categories significantly associated with genes dysregulated in DE5 and R6/2 transgenic mice. Specific categories are listed along the x-axis, with the number of genes per category along the y-axis.
We next used Ingenuity Systems Pathways Analysis to examine known canonical pathways that were significantly correlated with genes differentially expressed in each line, as well as those genes selectively altered in either DE5 or R6/2 lines. We focused specifically on those pathways that have been implicated in cell-autonomous and non-cell-autonomous pathophysiological mechanisms in HD. Some pathways were associated with dysfunction in all three models, although in several cases different genes within a given pathway were found to be altered in their expression (Table 3). For example, multiple genes in the calcium signaling pathway were altered in all three transgenic lines, although eight genes were uniquely altered in DE5 transgenic mice and five in R6/2 transgenic mice. In other pathways, dysregulation was more prominent in the pan-neuronal lines than in the striatal-specific line. Most striking was dysregulation of genes associated with dopamine and glutamate signaling, which was greater in both R6/2 lines relative to the DE5 line. Notably, genes related to these pathways are also significantly dysregulated in R6/2-150Q mice at later stages (13). On the other hand, changes associated with oxidative phosphorylation and mitochondrial dysfunction were relatively more prominent in DE5 transgenic mice, with several genes in this pathway being altered in expression selectively in this model. Genes in these pathways that were altered in the two R6/2 lines differed from each other in addition to being distinct when compared with DE5 transgenic mice. Finally, certain genes in the related peroxisome proliferator-activated receptor (PPAR) pathway were altered in all lines, but several were dysregulated only in DE5 transgenic mice, including Nr2f1, Nfkbia, Pdgfa, Mras, Rxra, Map3k7ip1, Ppargc1a and Ep300 (Table 3; Fig. 5).
Table 3.
Canonical pathways associated with shared and unique expression profiles of HD mice
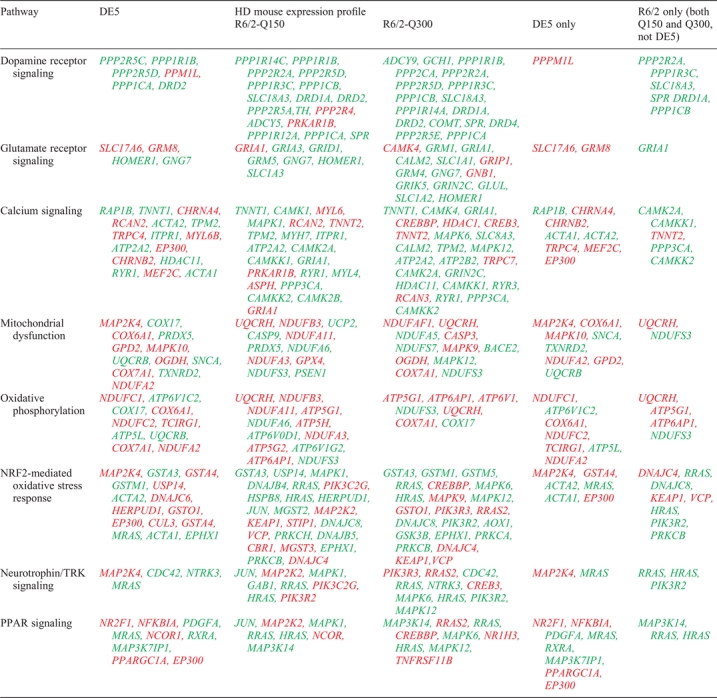 |
Canonical pathways analysis was run using Ingenuity Systems Pathway Analysis. Those pathways significantly associated with transcriptome profiles of the indicated condition are shown. Genes are indicated by their Official UniGene symbol. NS, not significant. Red indicates those genes upregulated in expression, while green indicates down-regulated genes.
Figure 5.

The PPAR pathway. Schematic depiction of the PPAR pathway with those genes highlighted that are selectively altered in their expression in DE5 transgenic mice. Red indicates an up-regulation of gene expression; green, a down-regulation. PPARα (Ppargc1a), peroxisome proliferator-activated receptor gamma coactivator 1-alpha; Coup-tf (Nr2f1), nuclear receptor subfamily 2, group F, member 1; Rxra (Rxra), retinoid X receptor alpha; Ncor1 (Ncor1), nuclear receptor co-repressor 1; Mras (Mras), muscle and microspikes RAS; Pdgfa (Pdgfa), platelet derived growth factor, alpha; TAB1 (Map3k7ip1), TGF-beta-activated kinase 1/MAP3K7 binding protein 1; Nfkbia (Nfkbia), nuclear factor of kappa light polypeptide gene enhancer in B-cells inhibitor, alpha. Pathway depiction reproduced with permission from Ingenuity Systems Analysis (© 2000–2011 Ingenuity Systems, Inc. All rights reserved).
Real-time PCR expression validation
We validated the expression differences for 11 genes related to these canonical pathways, including two striatal-enriched genes (Pde1b and Rgs9), in the striata of DE5 transgenic mice. These include the ATP synthase, H+ transporting, mitochondrial F0 complex, subunit g (Atp5l), cytochrome c oxidase, subunit VI a, polypeptide 1 (Cox6a1), cytochrome c oxidase, subunit VIIa 1 (Cox7a1), cytochrome c oxidase, subunit XVII assembly protein homolog (Cox17), NADH dehydrogenase (ubiquinone) 1 alpha subcomplex, 2 (Ndufa2), NADH dehydrogenase (ubiquinone) 1, subcomplex unknown, 1 (Ndufc1), NADH dehydrogenase (ubiquinone) 1, subcomplex unknown, 2 (Ndufc2), nuclear receptor subfamily 2, group F, member 1 (Nr2f1), muscle and microspikes RAS (Mras), mitogen-activated protein kinase kinase kinase 7 interacting protein 1 (Map3k7ip1) and PPAR, gamma, coactivator 1 alpha (Ppargc1a). Eight of these genes showed validated expression differences consistent with the microarray results: Rgs9, Pde1b, Atp5l, Ndufc1, Mras, Nr2f1, Map3k7ip1 and Ppargc1a (Fig. 6).
Figure 6.

Expression alterations of genes associated with various canonical pathways in DE5 transgenic mice. Real-time PCR analysis was performed for the indicated genes (indicated by their official UniGene ID) on RNA samples from striatum of DE5 transgenic mice. Data are depicted as fold-change of the mean expression level ± SEM (n= 4 mice per group). The relative abundance of each gene expression was normalized using Hprt. Asterisks denote significant differences from wt or control subjects as determined by unidirectional Student's t-tests: *P< 0.05; **P< 0.005; +P< 0.06.
DISCUSSION
To elucidate the extent of cell-autonomous transcriptional alterations in HD, we performed genome-wide expression profiling of striatal tissue from DE5 transgenic mice. Importantly, this is the first microarray study performed in an in vivo ‘striatal-specific’ genetic HD model. In this study, we demonstrate a relatively high degree of overlap of changes in gene expression in DE5 transgenic mice, a forebrain striatal-specific mouse model of HD expressing the Htt N171 fragment and two transgenic pan-cellular R6 models, human caudate and Htt N171 fragment-expressing cultured striatal neurons (9). Collectively, these data provide strong evidence that intrinsic effects of mutant Htt are sufficient to result in transcriptional alterations in several pathways relevant to HD pathology. Conversely, these data suggest that expression of mutant Htt in the cortex is not required for most of the transcriptional dysregulation present in mouse models of HD.
Transcriptional effects of the cortex on the striatum in HD may arise at least in part from decreased synthesis and transport of brain-derived neurotrophic factor (BDNF) (18), and it has been suggested that cortical-specific deletion of BDNF mimics the pattern of transcriptional dysregulation in HD (12). Importantly, DE5 transgenic mice express normal levels of cortical BDNF and striatal trkB mRNA (11). Moreover, early embryonic deletion of BDNF may not accurately represent the pattern of decreased BDNF noted in HD. Of note, however, many of the striatal-enriched genes are also regulated by BDNF (19), and a decrease in this trophic factor may contribute to a greater magnitude of the alterations in pan-neuronal HD models. It is also possible that the magnitude of these alterations would be greater in older DE5 mice than those utilized in this study, since DE5 mice have a normal lifespan.
Other mechanistic candidates leading to selective neuronal vulnerability in HD include mitochondrial dysfunction that induces energy deficits, increased oxidative stress and abnormalities of calcium signaling. Pathways associated with both cell- and non-cell-autonomous components include glutamate and dopamine neurotransmission (20). We therefore compared and contrasted changes in gene expression in these canonical pathways among the different mouse models. We also included the PPAR pathway, as it potentially unites transcriptional dysregulation with mitochondrial dysfunction (21). We anticipated that changes in gene expression associated with mitochondrial dysfunction and oxidative stress, and the responses to these stressors, would be largely cell autonomous, resulting in a high degree of overlap between the DE5 and R6/2 transgenic models. It was therefore surprising to discover that levels of a number of genes in these pathways were altered only in the DE5 transgenic line, including the qPCR-validated Atp5l, Ndufac1 and Mras, despite a longer polyglutamine repeat and greater symptomatology in the R6 transgenic models. This suggests that mitochondrial deficits and oxidative stress are prominent features of intrinsic striatal dysfunction. The fact that other genes associated with these functions are altered in their expression in R6/2 suggests that non-cell-autonomous effects might both exacerbate and compensate for this dysfunction. Of note, however, Mras, whose protein product may be required for neurotrophic signaling and dendritic remodeling but is also expressed in glia (22), is uniquely highly down-regulated in the DE5 model.
In the calcium signaling pathway, the expression profiles of the three mouse models are highly shared, implying a substantial degree of cell-autonomous changes related to this pathway. This is in contrast to the glutamate and dopamine receptor signaling pathways for which the greatest number of gene expression changes occurred in R6/2 transgenic mice and very few occurred in DE5 transgenic mice. As increased sensitivity to excitotoxity appears to result from combinations of increased cortical glutamate neurotransmission and mislocalization of MSN glutamate receptor subtypes in the extra-synaptic region (reviewed in 23), which may not be reflected by transcriptional dysregulation, these results do not obviously allow for a prediction regarding sensitivity to glutamate excitotoxicity in the DE5 mouse. Perhaps not surprisingly, although Drd2, Rgs9 and Ppp1r1b mRNAs are decreased in the striatum of DE5 transgenic mice, many more genes in the dopamine receptor signaling pathway are dysregulated in R6/2 compared with DE5 striatum, probably reflecting trans-synaptic regulation and/or compensatory responses to reduced dopaminergic input (24).
As noted above, we found a substantial overlap of gene expression differences between DE5 transgenic mice and Htt171-82Q-expressing primary striatal cultures. Furthermore, we found that DE5 transgenic mice showed a similar enrichment of GO categories to those reported previously from these in vitro studies. In particular, gene expression changes unique to DE5 transgenic mice and cultured striatal neurons, but not R6/2 mice, were associated with protein transport, axon development and RNA splicing (9). There are actually fewer changes in the DE5 model relative to the cultured neurons. We hypothesize that this is due to the somewhat immature nature of the neurons in vitro, and also to the fact that by definition, they are removed from their normal developmental and adult environment and changes are, therefore, both cell autonomous and independent of brain circuitry. Another previous microarray study reported transcription changes from rat clonal striata-derived cells expressing an N-terminal 548-amino acid Htt fragment under the control of a doxycycline-regulated promoter (10). These studies revealed altered expression of genes involved in cell signaling, transcription, lipid metabolism as well as RNA processing, consistent with our findings. Overall, of the ∼80 gene expression abnormalities reported, we found 6 genes, including 2 lipid-related genes, Acat2 and Fasn, that were also dysregulated in the DE5 transgenic mice.
Of the altered genes that are ubiquitously expressed, there were important differences in the direction of change in a subset of transcripts that may reflect compensatory changes. For example, Ppargc1a is a member of the PPAR-regulated pathway, and its down-regulation in MSNs is hypothesized to play a causative role in HD pathophysiology (25–28). In DE5 transgenic mice, however, Ppargc1a mRNA is up-regulated, whereas it is unchanged in the R6 transgenic models in this study. Interestingly, Nr2f1 expression is also up-regulated in DE5 mice and Map3k7ip1 is down-regulated, but both are unchanged in the R6 models, which could serve to balance the impairment of Ppargc1a-associated activity in DE5 mice and subsequent down-regulation of protective mitochondrial activity. Another example of an abnormality in the oxidative phosphorylation pathway in DE5 mice only is Ndufc1, which follows the same pattern as Ppargc1a (Fig. 6), The functional implications, therefore, may actually be similar to those models in which Ppargc1a is down-regulated and may indicate altered mitochondrial energy metabolism in DE5 transgenic mice.
Mutant Htt protein interacts with multiple transcription factors, most of which are not cell specific, e.g. the cAMP response element-binding protein (CREB)-binding protein, Specificity protein 1 (Sp1), TATA binding box protein, Bcl11b, repressor element-1 transcription factor/neuron restrictive silencer factor and widely expressed components of the basal polymerase II transcriptional machinery (29–31). Overall, the genome-wide transcriptome changes induced by mutant Htt in DE5 cannot yet be ascribed to a particular transcription factor regulatory network (32–35).
A final distinction worthy of consideration is the cellular localization of expression of genes of interest. The D9 promoter driving Htt expression in DE5 transgenic mice does not direct expression to striatal interneurons or to glia (36). Striatal GABAergic/parvalbumin interneurons receive direct, convergent cortical input (37) and are in fact highly sensitive in HD and in models of excitotoxicity (38). In mouse HD models, Pvalb gene expression is usually decreased; however, in the DE5 model, Pvalb expression is increased. As noted above, PGC1α mRNA is also increased, which may be driving the Pvalb gene (39). These data imply that in the DE5 mouse, transcriptome alterations in these interneurons are mediated by cell–cell interactions, whereas there may be more direct, cell-autonomous alterations when mutant Htt is expressed in a pan-cellular distribution. In regards to glia, it has recently been demonstrated that selective expression of mutant Htt in glia results in a distinct phenotype and further exacerbates symptoms in the N171-82Q transgenic mouse (40,41). Importantly, the Nrf2-mediated protective pathway is largely localized to astrocytes (42), so it will be important to determine in which cell types(s) alterations in expression of genes in this pathway are occurring in all HD mouse models.
In summary, our data are consistent with the notion that transcriptional dysregulation in HD MSNs in vivo is largely cell autonomous in specific canonical pathways, and largely non-cell autonomous in others. They are also consistent with our previous findings regarding the nature and severity of the motor deficit in the DE5 transgenic mouse, particularly when directly compared with the prp-N171-82Q model (11). Our underlying assumption is that the changes noted in the DE5 mouse striatum are cell autonomous, but can simultaneously be compensating for cell-intrinsic abnormalities. The converse is also true, i.e. compensatory pathways may also normalize some of the anticipated alterations. Conversely, in pan-neuronal models, e.g. R6/2, transcriptome alterations that may occur on a cell-autonomous basis may be ‘masked' by opposing, non-cell-autonomous effects of the mutation on the MSN, resulting in gene alterations that are unique to DE5 transgenic mice. These latter alterations may also be compensatory, and may be either beneficial or deleterious. Finally, it is possible that the response of individual changes may differ based on the Htt fragment length, although published data do not support a major role for the fragment length. Overall, this situation is perhaps most similar to what has been hypothesized for the etiology of amyotrophic lateral sclerosis (43), in which the pathophysiological processes are initiated in highly vulnerable neuronal subtypes, but progression proceeds more rapidly via non-cell-autonomous mechanisms. Therapeutic targeting of cell- or non-cell-autonomous sites will, therefore, depend on which pathway(s) is the desired target.
MATERIALS AND METHODS
DE5 transgenic mice
Creation and characterization of the D9-N171-98Q (a.k.a. DE5) mouse line has been previously reported (11). Male DE5 transgenic mice and non-transgenic controls (i.e. wt) (n= 3 to 4 per genotype) were used for the microarray analysis. Mice were sacrificed at 14 months of age, a time at which HD-like phenotypes are clearly manifested (11).
Microarray analysis: comparisons with the R6/2 line
Total RNA was extracted from the striatum of wt and DE5 transgenic mice using the Nucleospin RNA kit (BD Biosciences, San Jose, CA, USA). RNA quantity was assessed with Nanodrop (Nanodrop Technologies) and quality with the Agilent Bioanalyzer (Agilent Technologies). Total RNA (200 ng) was amplified, biotinylated and hybridized on Illumina Mouse-8 V2 Beadchips, querying the expression of ∼22 000 Refseq transcripts according to the manufacturer's protocol. Slides were scanned using Illumina BeadStation and signal extracted using Illumina BeadStudio software (Illumina, San Diego, CA, USA). Raw data were analyzed using Bioconductor packages (44). Quality assessment was performed looking at the inter-array Pearson correlation and clustering based on top variant genes was used to assess overall data coherence. Contrast analysis of differential expression was performed using the ‘limma’ package (45). After linear model fitting, a Bayesian estimate of differential expression was calculated. Data analysis was aimed at (i) identifying transcriptional changes in the DE5 transgenic compared with wt mice, and (ii) comparing striatal gene expression profiles of DE5 transgenic mice with those profiles previously generated from the striata of two different lines of R6/2 mice generated on the same platform (17 and Luthi-Carter, Kuhn, unpublished data). Several criteria were considered for identifying differentially expressed genes, including P-value cut-offs ranging from P< 0.001 to <0.05 and different log2 ratio cut-offs.
Microarray analysis: comparisons with in vitro cells
Gene expression profiles (n= 7) obtained from DE5 and wt mice were normalized using robust multi-array average and log2-transformed using the Bioconductor package ‘beadarray’ (46). We performed differential expression analysis between DE5 (n= 4) and wt (n= 3) mice using the Bioconductor package ‘limma’ (45) and adjusted P-values for multiple testing (47). To assess the resemblance of gene expression changes detected in DE5 mice and in a rat primary cell culture model (N171-82Q versus N171-18Q, data from ref. 9), we mapped all Illumina probes onto orthologous Affymetrix probe sets on the Rat RAE230A array format using the Bioconductor package ‘annotationTools’ (48). We then mapped Illumina's RefSeq transcript ID annotation (Mouse-8 V2) to corresponding mouse gene IDs using gene2accession obtained from Entrez gene (on 6 August 2010). Orthologous rat genes were obtained using HomoloGene (build 64) and mapped to Affymetrix probe sets present on the rat microrray using Affymetrix annotation (build 30). Starting from 22 744 Illumina probes annotated with a RefSeq ID, we obtained 21 716 corresponding gene IDs that could be mapped onto 18 352 rat orthologous gene IDs. A total of 14 572 of these had at least one probe set on the Affymetrix microarray. Note that using the RefSeq IDs provided in Illumina's annotation (instead of gene IDs) allowed us to perform a more complete mapping since 5580 probes that were annotated with a RefSeq transcript were not annotated with a gene ID. This Illumina probe to Affymetrix probe set mapping was then used to align differentially expressed genes in DE5 mice with orthologous Affymetrix probe sets on the Rat RAE230A array.
Pathway analyses
GO terms were identified using the Database for Annotation, Visualization and Integrated Discovery (DAVID) (http://david.abcc.ncifcrf.gov/) to understand the potential biological relevance of differentially expressed genes. Canonical pathway analysis was performed using Ingenuity Systems Pathway Analysis.
Microarray data concordance
We assessed the correlation between gene expression changes detected in DE5 transgenic mice compared with those observed in human post-mortem caudate by calculating the concordance coefficient, as described previously (13). The concordant regulation was defined as a pair of orthologous probe sets reporting same-direction differential expression between disease and control (i.e. both up-regulated or both down-regulated) where the human probe set showed a significant expression change (FDR P-value < 0.05) (14). Similarly, discordant regulation was defined as two probe sets reporting opposite sign regulations where the human probe set showed a significant expression change (FDR P-value < 0.05). The concordance coefficient, c, was defined as:
The #concordant is the number of concordant orthologous probe set pairs, the #discordant the number of discordant orthologous probe set pairs and N the number of mouse probe sets selected for the comparison. Of the top 200 significantly altered genes in the DE5 transgenic mice, 16 gene IDs had no human homolog or were not on the Illumina arrays, leaving 184 genes for the comparison against human.
Real-time PCR experiments
Real-time PCR experiments were performed using the ABI PRISMs 7900HT Sequence Detection System (Applied Biosystems, Foster City, CA, USA) as described previously (12). Amplification was performed on a cDNA amount equivalent to 25 ng of total RNA with 1 x SYBR® Green universal PCR Master mix (Applied Biosystems) containing deoxyribonucleotide triphosphates, MgCl2, AmpliTaq Gold DNA polymerase and forward and reverse primers. Specific primers for each mouse gene endogenous control were designed using Primer Express 1.5 software and their specificity for binding to the desired sequences was searched against the NCBI database (Supplementary Material, Table S5). Standard curves were generated for each gene of interest using serial dilutions of mouse cDNAs. Experimental samples and no-template controls were run in duplicate. The PCR cycling parameters were: 50°C for 2 min, 95°C for 10 min, and 40 cycles of 94°C for 15 s, 60°C for 1 min. The amount of cDNA in each sample was calculated using SDS2.1 software by the comparative threshold cycle (Ct) method and expressed as 2exp(Ct) using hypoxanthine guanine phosphoribosyl transferase (Hprt) as an internal control. Student's t-test (unidirectional) was used to determine significant differences in expression between non-transgenic and DE5 transgenic mice. Statistical analyses were performed using GraphPad software (GraphPad Prism, San Diego, CA, USA).
SUPPLEMENTARY MATERIAL
Supplementary Material is available at HMG online.
Conflict of Interest statement. None declared.
FUNDING
This work was supported by the National Institutes of Health (NS-059936 and NS-045942 to M.E.E., NS44169 to E.A.T.) and a Cure Huntington's Disease Initiative award to M.E.E.
REFERENCES
- 1.Harjes P., Wanker E.E. The hunt for huntingtin function; interaction partners tell many different stories. Trends Biochem. Sci. 2003;28:425–433. doi: 10.1016/S0968-0004(03)00168-3. doi:10.1016/S0968-0004(03)00168-3. [DOI] [PubMed] [Google Scholar]
- 2.Marcora E., Gowan K., Lee J.E. Stimulation of NeuroD activity by huntingtin and huntingtin-associated proteins HAP1 and MLK2. Proc. Natl Acad. Sci. USA. 2003;100:9578–9583. doi: 10.1073/pnas.1133382100. doi:10.1073/pnas.1133382100. [DOI] [PMC free article] [PubMed] [Google Scholar]
- 3.Yanai A., Huang K., Kang R., Singaraja R.R., Arstikaitis P., Gan L., Orban P.C., Mullard A., Cowan C.M., Raymond L.A., et al. Palmitoylation of huntingtin by HIP14 is essential for its trafficking and function. Nat. Neurosci. 2006;9:824–831. doi: 10.1038/nn1702. doi:10.1038/nn1702. [DOI] [PMC free article] [PubMed] [Google Scholar]
- 4.Hodges A., Strand A.D., Aragaki A.K., Kuhn A., Sengstag T., Hughes G., Elliston L.A., Hartog C., Goldstein D.R., Thu D., et al. Regional and cellular gene expression changes in human Huntington's disease brain. Hum. Mol. Genet. 2006;15:965–977. doi: 10.1093/hmg/ddl013. doi:10.1093/hmg/ddl013. [DOI] [PubMed] [Google Scholar]
- 5.Shao J., Diamond M.I. Polyglutamine diseases: emerging concepts in pathogenesis and therapy. Hum. Mol. Genet. 2007;16(Spec no. 2):R115–R123. doi: 10.1093/hmg/ddm213. doi:10.1093/hmg/ddm213. [DOI] [PubMed] [Google Scholar]
- 6.Thomas E.A. Striatal specificity of gene expression dysregulation in Huntington's disease. J. Neurosci. Res. 2006;84:1151–1164. doi: 10.1002/jnr.21046. doi:10.1002/jnr.21046. [DOI] [PubMed] [Google Scholar]
- 7.de Almeida L.P., Ross C.A., Zala D., Aebischer P., Deglon N. Lentiviral-mediated delivery of mutant huntingtin in the striatum of rats induces a selective neuropathology modulated by polyglutamine repeat size, huntingtin expression levels, and protein length. J. Neurosci. 2002;22:3473–3483. doi: 10.1523/JNEUROSCI.22-09-03473.2002. [DOI] [PMC free article] [PubMed] [Google Scholar]
- 8.Regulier E., Trottier Y., Perrin V., Aebischer P., Deglon N. Early and reversible neuropathology induced by tetracycline-regulated lentiviral overexpression of mutant huntingtin in rat striatum. Hum. Mol. Genet. 2003;12:2827–2836. doi: 10.1093/hmg/ddg305. doi:10.1093/hmg/ddg305. [DOI] [PubMed] [Google Scholar]
- 9.Runne H., Régulier E., Kuhn A., Zala D., Gokce O., Perrin V., Sick B., Aebischer P., Déglon N., Luthi-Carter R. Dysregulation of gene expression in primary neuron models of Huntington's disease shows that polyglutamine-related effects on the striatal transcriptome may not be dependent on brain circuitry. J. Neurosci. 2008;28:9723–9731. doi: 10.1523/JNEUROSCI.3044-08.2008. doi:10.1523/JNEUROSCI.3044-08.2008. [DOI] [PMC free article] [PubMed] [Google Scholar]
- 10.Sipione S., Rigamonti D., Valenza M., Zuccato C., Conti L., Pritchard J., Kooperberg C., Olson J.M., Cattaneo E. Early transcriptional profiles in huntingtin-inducible striatal cells by microarray analyses. Hum. Mol. Genet. 2002;11:1953–1965. doi: 10.1093/hmg/11.17.1953. doi:10.1093/hmg/11.17.1953. [DOI] [PubMed] [Google Scholar]
- 11.Brown T.B., Bogush A.I., Ehrlich M.E. Neocortical expression of mutant huntingtin is not required for alterations in striatal gene expression or motor dysfunction in a transgenic mouse. Hum. Mol. Genet. 2008;17:3095–3104. doi: 10.1093/hmg/ddn206. doi:10.1093/hmg/ddn206. [DOI] [PMC free article] [PubMed] [Google Scholar]
- 12.Strand A.D., Baquet Z.C., Aragaki A.K., Holmans P., Yang L., Cleren C., Beal M.F., Jones L., Kooperberg C., Olson J.M., et al. Expression profiling of Huntington's disease models suggests that brain-derived neurotrophic factor depletion plays a major role in striatal degeneration. J. Neurosci. 2007;27:11758–11768. doi: 10.1523/JNEUROSCI.2461-07.2007. doi:10.1523/JNEUROSCI.2461-07.2007. [DOI] [PMC free article] [PubMed] [Google Scholar]
- 13.Kuhn A., Goldstein D.R., Hodges A., Strand A.D., Sengstag T., Kooperberg C., Becanovic K., Pouladi M.A., Sathasivam K., Cha J.H., et al. Mutant huntingtin's effects on striatal gene expression in mice recapitulate changes observed in human Huntington's disease brain and do not differ with mutant huntingtin length or wild-type huntingtin dosage. Hum. Mol. Genet. 2007;6:1845–1861. doi: 10.1093/hmg/ddm133. doi:10.1093/hmg/ddm133. [DOI] [PubMed] [Google Scholar]
- 14.Desplats P.A., Kass K.E., Gilmartin T., Stanwood G.D., Woodward E.L., Head S.R., Sutcliffe J.G., Thomas E.A. Selective deficits in the expression of striatal-enriched mRNAs in Huntington's disease. J. Neurochem. 2006;96:743–757. doi: 10.1111/j.1471-4159.2005.03588.x. doi:10.1111/j.1471-4159.2005.03588.x. [DOI] [PubMed] [Google Scholar]
- 15.Luthi-Carter R., Strand A., Peters N.L., Solano S.M., Hollingsworth Z.R., Menon A.S., Frey A.S., Spektor B.S., Penney E.B., Schilling G., et al. Decreased expression of striatal signaling genes in a mouse model of Huntington's disease. Hum. Mol. Genet. 2000;9:1259–1271. doi: 10.1093/hmg/9.9.1259. doi:10.1093/hmg/9.9.1259. [DOI] [PubMed] [Google Scholar]
- 16.Mazarei G., Neal S.J., Becanovic K., Luthi-Carter R., Simpson E.M., Leavitt B.R. Expression analysis of novel striatal-enriched genes in Huntington disease. Hum. Mol. Genet. 2010;19:609–622. doi: 10.1093/hmg/ddp527. doi:10.1093/hmg/ddp527. [DOI] [PMC free article] [PubMed] [Google Scholar]
- 17.Thomas E.A., Coppola G., Desplats P.A., Tang B., Soragni E., Burnett R., Gao F., Fitzgerald K.M., Borok J.F., Herman D., et al. The HDAC inhibitor, 4b, ameliorates the disease phenotype and transcriptional abnormalities in Huntington's disease transgenic mice. Proc. Natl Acad. Sci. USA. 2008;105:15564–15569. doi: 10.1073/pnas.0804249105. doi:10.1073/pnas.0804249105. [DOI] [PMC free article] [PubMed] [Google Scholar]
- 18.Zuccato C., Cattaneo E. Brain-derived neurotrophic factor in neurodegenerative diseases. Nat. Rev. Neurol. 2009;5:311–322. doi: 10.1038/nrneurol.2009.54. doi:10.1038/nrneurol.2009.54. [DOI] [PubMed] [Google Scholar]
- 19.Ivkovic S., Ehrlich M.E. Expression of the striatal DARPP-32/ARPP-21 phenotype in GABAergic neurons requires neurotrophins in vivo and in vitro. J. Neurosci. 1999;19:5409–5419. doi: 10.1523/JNEUROSCI.19-13-05409.1999. [DOI] [PMC free article] [PubMed] [Google Scholar]
- 20.Gibson G.E., Starkov A., Blass J.P., Ratan R.R., Beal M.F. Cause and consequence: mitochondrial dysfunction initiates and propagates neuronal dysfunction, neuronal death and behavioral abnormalities in age-associated neurodegenerative diseases. Biochim. Biophys. Acta. 2010;1802:122–134. doi: 10.1016/j.bbadis.2009.08.010. [DOI] [PMC free article] [PubMed] [Google Scholar]
- 21.McGill J.K., Beal M.F. PGC-1alpha, a new therapeutic target in Huntington's disease? Cell. 2006;127:465–468. doi: 10.1016/j.cell.2006.10.023. doi:10.1016/j.cell.2006.10.023. [DOI] [PubMed] [Google Scholar]
- 22.Keduka E., Kaiho A., Hamada M., Watanabe-Takano H., Takano K., Ogasawara M., Satou Y., Satoh N., Endo T. M-Ras evolved independently of R-Ras and its neural function is conserved between mammalian and ascidian, which lacks classical Ras. Gene. 2009;429:49–58. doi: 10.1016/j.gene.2008.10.001. doi:10.1016/j.gene.2008.10.001. [DOI] [PubMed] [Google Scholar]
- 23.Levine M.S., Cepeda C., André V.M. Location, location, location: contrasting roles of synaptic and extrasynaptic NMDA receptors in Huntington's disease. Neuron. 2010;65:145–147. doi: 10.1016/j.neuron.2010.01.010. doi:10.1016/j.neuron.2010.01.010. [DOI] [PMC free article] [PubMed] [Google Scholar]
- 24.Johnson M.A., Rajan V., Miller C.E., Wrightman R.M. Dopamine release is severely compromised in the R6/2 mouse model of Huntington's disease. J. Neurochem. 2006;97:737–746. doi: 10.1111/j.1471-4159.2006.03762.x. doi:10.1111/j.1471-4159.2006.03762.x. [DOI] [PubMed] [Google Scholar]
- 25.Lee J.M., Ivanova E.V., Seong I.S., Cashorali T., Kohane I., Gusella J.F., MacDonald M.E. Unbiased gene expression analysis implicates the huntingtin polyglutamine tract in extra-mitochondrial energy metabolism. PLoS Genet. 2007;3:e135. doi: 10.1371/journal.pgen.0030135. doi:10.1371/journal.pgen.0030135. [DOI] [PMC free article] [PubMed] [Google Scholar]
- 26.Weydt P., Pineda V.V., Torrence A.E., Libby R.T., Satterfield T.F., Lazarowski E.R., Gilbert M.L., Morton G.J., Bammler T.K., Strand A.D., et al. Thermoregulatory and metabolic defects in Huntington's disease transgenic mice implicate PGC-1alpha in Huntington's disease neurodegeneration. Cell Metab. 2006;4:349–362. doi: 10.1016/j.cmet.2006.10.004. doi:10.1016/j.cmet.2006.10.004. [DOI] [PubMed] [Google Scholar]
- 27.Cui L., Jeong H., Borovecki F., Parkhurst C.N., Tanese N., Krainc D. Transcriptional repression of PGC-1alpha by mutant huntingtin leads to mitochondrial dysfunction and neurodegeneration. Cell. 2006;127:59–69. doi: 10.1016/j.cell.2006.09.015. doi:10.1016/j.cell.2006.09.015. [DOI] [PubMed] [Google Scholar]
- 28.Okamoto S., Pouladi M.A., Talantova M., Yao D., Xia P., Ehrnhoefer D.E., Zaidi R., Clemente A., Kaul M., Graham R.K., et al. Balance between synaptic versus extrasynaptic NMDA receptor activity influences inclusions and neurotoxicity of mutant huntingtin. Nat. Med. 2009;15:1407–1413. doi: 10.1038/nm.2056. doi:10.1038/nm.2056. [DOI] [PMC free article] [PubMed] [Google Scholar]
- 29.Benn C.L., Sun T., Sadri-Vakili G., McFarland K.N., DiRocco D.P., Yohrling G.J., Clark T.W., Bouzou B., Cha J.H. Huntingtin modulates transcription, occupies gene promoters in vivo, and binds directly to DNA in a polyglutamine-dependent manner. J Neurosci. 2008;28:10720–10733. doi: 10.1523/JNEUROSCI.2126-08.2008. doi:10.1523/JNEUROSCI.2126-08.2008. [DOI] [PMC free article] [PubMed] [Google Scholar]
- 30.Riley B.E., Orr H.T. Polyglutamine neurodegenerative diseases and regulation of transcription: assembling the puzzle. Genes Dev. 2006;20:2183–2192. doi: 10.1101/gad.1436506. doi:10.1101/gad.1436506. [DOI] [PubMed] [Google Scholar]
- 31.Buckley N.J., Johnson R., Zuccato C., Bithell A., Cattaneo E. The role of REST in transcriptional and epigenetic dysregulation in Huntington's disease. Neurobiol. Dis. 2010;39:28–39. doi: 10.1016/j.nbd.2010.02.003. doi:10.1016/j.nbd.2010.02.003. [DOI] [PubMed] [Google Scholar]
- 32.Belyaev N.D., Wood I.C., Bruce A.W., Street M., Trinh J.B., Buckley N.J. Distinct RE-1 silencing transcription factor-containing complexes interact with different target genes. J. Biol. Chem. 2004;279:556–561. doi: 10.1074/jbc.M310353200. doi:10.1074/jbc.M310353200. [DOI] [PubMed] [Google Scholar]
- 33.Bruce A.W., Donaldson I.J., Wood I.C., Yerbury S.A., Sadowski M.I., Chapman M., Göttgens B., Buckley N.J. Genome-wide analysis of repressor element 1 silencing transcription factor/neuron-restrictive silencing factor (REST/NRSF) target genes. Proc. Natl Acad. Sci. USA. 2004;101:10458–10463. doi: 10.1073/pnas.0401827101. doi:10.1073/pnas.0401827101. [DOI] [PMC free article] [PubMed] [Google Scholar]
- 34.Ballas N., Grunseich C., Lu D.D., Speh J.C., Mandel G. REST and its corepressor mediate plasticity of neuronal gene chromatin throughout neurogenesis. Cell. 2005;121:645–657. doi: 10.1016/j.cell.2005.03.013. doi:10.1016/j.cell.2005.03.013. [DOI] [PubMed] [Google Scholar]
- 35.Desplats P.A., Lambert R., Thomas E.A. Functional roles for the striatal-enriched transcription factor, Bcl11b, in the control of striatal gene expression and transcriptional dysregulation in Huntington's disease. Neurobiol. Dis. 2008;31:298–308. doi: 10.1016/j.nbd.2008.05.005. doi:10.1016/j.nbd.2008.05.005. [DOI] [PMC free article] [PubMed] [Google Scholar]
- 36.Bogush A.I., McCarthy L.E., Tian C., Olm V., Gieringer T., Ivkovic S., Ehrlich M.E. DARPP-32 genomic fragments drive Cre expression in postnatal striatum. Genesis. 2005;42:37–46. doi: 10.1002/gene.20118. doi:10.1002/gene.20118. [DOI] [PubMed] [Google Scholar]
- 37.Ramanathan S., Hanley J.J., Deniau J.M., Bolam J.P. Synaptic convergence of motor and somatosensory cortical afferents onto GABAergic interneurons in the rat striatum. J. Neurosci. 2002;22:8158–8169. doi: 10.1523/JNEUROSCI.22-18-08158.2002. [DOI] [PMC free article] [PubMed] [Google Scholar]
- 38.Cicchetti F., Prensa L., Wu Y., Parent A. Chemical anatomy of striatal interneurons in normal individuals and in patients with Huntington's disease. Brain Res. Brain Res. Rev. 2000;34:80–101. doi: 10.1016/s0165-0173(00)00039-4. doi:10.1016/S0165-0173(00)00039-4. [DOI] [PubMed] [Google Scholar]
- 39.Lucas E.K., Markwardt S.J., Gupta S., Meador-Woodruff J.H., Lin J.D., Overstreet-Wadiche L., Cowell R.M. Parvalbumin deficiency and GABAergic dysfunction in mice lacking PGC-1alpha. J. Neurosci. 2010;30:7227–7735. doi: 10.1523/JNEUROSCI.0698-10.2010. doi:10.1523/JNEUROSCI.0698-10.2010. [DOI] [PMC free article] [PubMed] [Google Scholar]
- 40.Bradford J., Shin J.Y., Roberts M., Wang C.E., Li X.J., Li S. Expression of mutant huntingtin in mouse brain astrocytes causes age-dependent neurological symptoms. Proc. Natl Acad. Sci. USA. 2009;106:22480–22485. doi: 10.1073/pnas.0911503106. doi:10.1073/pnas.0911503106. [DOI] [PMC free article] [PubMed] [Google Scholar]
- 41.Bradford J., Shin J.Y., Roberts M., Wang C.E., Sheng G., Li S., Li X.J. Mutant huntingtin in glial cells exacerbates neurological symptoms of Huntington disease mice. J. Biol. Chem. 2010;285:10653–10661. doi: 10.1074/jbc.M109.083287. doi:10.1074/jbc.M109.083287. [DOI] [PMC free article] [PubMed] [Google Scholar]
- 42.Vargas M.R., Johnson J.A. The Nrf2-ARE cytoprotective pathway in astrocytes. Expert Rev. Mol. Med. 2009;11:e17. doi: 10.1017/S1462399409001094. doi:10.1017/S1462399409001094. [DOI] [PMC free article] [PubMed] [Google Scholar]
- 43.Ilieva H., Polymenidou M., Cleveland D.W. Non-cell autonomous toxicity in neurodegenerative disorders: ALS and beyond. J. Cell Biol. 2009;187:761–772. doi: 10.1083/jcb.200908164. doi:10.1083/jcb.200908164. [DOI] [PMC free article] [PubMed] [Google Scholar]
- 44.Gentleman R.C., Carey V.J., Bates D.M., Bolstad B., Dettling M., Dudoit S., Ellis B., Gautier L., Ge Y., Gentry J., et al. Bioconductor: open software development for computational biology and bioinformatics. Genome Biol. 2004;5:R80. doi: 10.1186/gb-2004-5-10-r80. doi:10.1186/gb-2004-5-10-r80. [DOI] [PMC free article] [PubMed] [Google Scholar]
- 45.Smyth G.K. Limma: linear models for microarray data. In: Gentleman R., Carey V.J., Huber W., Irizarry R., Dudoit S., editors. Bioinformatics and Computational Biology Solutions using R and Bioconductor. New York: Springer; 2005. pp. 397–420. [Google Scholar]
- 46.Dunning M.J., Smith M.L., Ritchie M.E., Tavaré S. beadarray: R classes and methods for Illumina bead-based array. Bioinformatics. 2007;23:2183–2184. doi: 10.1093/bioinformatics/btm311. doi:10.1093/bioinformatics/btm311. [DOI] [PubMed] [Google Scholar]
- 47.Hochberg Y., Benjamini Y. More powerful procedures for multiple significance testing. Stat. Med. 1990;9:811–818. doi: 10.1002/sim.4780090710. doi:10.1002/sim.4780090710. [DOI] [PubMed] [Google Scholar]
- 48.Kuhn A., Luthi-Carter R., Delorenzi M. Cross-species and cross-platform gene expression studies with the Bioconductor-compliant R package ‘annotationTools. BMC Bioinformatics. 2008;17:26. doi: 10.1186/1471-2105-9-26. doi:10.1186/1471-2105-9-26. [DOI] [PMC free article] [PubMed] [Google Scholar]
Associated Data
This section collects any data citations, data availability statements, or supplementary materials included in this article.