Abstract
Early detection and treatment of lung cancer is one of the most effective means of reducing cancer mortality, and to this end, chest X-ray radiography has been widely used as a screening method. A related technique based on the development of computer analysis and a flat panel detector (FPD) has enabled the functional evaluation of respiratory kinetics in the chest and is expected to be introduced into clinical practice in the near future. In this study, we developed a computer analysis algorithm to detect lung nodules and to evaluate quantitative kinetics. Breathing chest radiographs obtained by modified FPD and breath synchronization utilizing diaphragmatic analysis of vector movement were converted into four static images by sequential temporal subtraction processing, morphological enhancement processing, kinetic visualization processing, and lung region detection processing. An artificial neural network analyzed these density patterns to detect the true nodules and draw their kinetic tracks. Both the algorithm performance and the evaluation of clinical effectiveness of seven normal patients and simulated nodules showed sufficient detecting capability and kinetic imaging function without significant differences. Our technique can quantitatively evaluate the kinetic range of nodules and is effective in detecting a nodule on a breathing chest radiograph. Moreover, the application of this technique is expected to extend computer-aided diagnosis systems and facilitate the development of an automatic planning system for radiation therapy.
Key words: Chest radiographs, computer analysis, computer-assisted instruction, computerized method, image analysis, lung
Introduction
Lung cancer morbidity and mortality are increasing in Japan, and this disease was the leading cause of cancer death among Japanese males in 2005.1 Early detection and treatment of lung cancer is an effective factor in the reduction in mortality and is likely to improve the prognostic survival rate. Regular health checkups are useful in achieving early detection, and chest X-ray radiography is widely applied as the standard inspection procedure because of its convenience, cost performance, and extensive range of diagnostic regions.
In 2003, a new radiographic protocol was developed using flat-panel detector (FPD) to observe chest respiratory kinetics and is expected to be available for clinical practice in the near future.2,3 This modality is based on radiography of a set of continuous respiratory kinetics from deep inspiration to deep expiration. As it uses computer analysis, this breathing chest radiography approach offers advantages that are not available with conventional X-ray imaging, including time-sequential information, diaphragm kinetics, ventilator function, and evaluation of pulmonary blood flow dynamics.4–7 The exposure dose is approximately 1.5 times that of regular chest X-rays; however, this is justified when considering the additional information that the radiograph provides.
Computer-aided diagnosis is currently being developed to improve the accuracy of lung cancer imaging, and the outcome is expected to contribute to diagnostic imaging.8,9 One such technique involves temporal subtraction, which improves the diagnostic accuracy as the time series change of nodules can be emphasized.10,11 The aims of the present study were to develop a nodule detection method for breathing chest radiography that could be evaluated for quantitative kinetics by computer analysis using a temporal subtraction technique and to evaluate its clinical effectiveness via a simulation experiment.
Materials and Methods
Data Acquisition
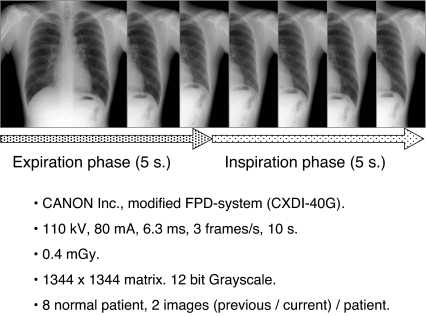
The respiratory dynamic chest radiographs used in this study were acquired using a modified FPD system (CXDI-40G, Canon, Tokyo, Japan), which was installed at Kanazawa University, Kanazawa, Japan, with the following conditions: 110 kV, 80 mA, 6.3 ms, and 3 frames per second. The source–image distance was 2.0 m, and the total number of frames for one dynamic radiographic examination was 30. The matrix size was 1,344 × 1,344 pixels, and the gray-level range of the images was 4,096. Two images from each of eight normal male patients (age range = 22–54 years) were obtained, with an interval of about 2 h, to acquire a total of 16 images (Fig. 1).
Fig 1.
Protocol of breathing chest radiography.
As the institutions concerned did not have ethics committees at the time of the image data collection (2002), the Declaration of Helsinki was observed, and approval by the Institutional Review Board of Kanazawa University and informed consent from the patients were obtained.
Image Analysis
Analysis was performed on a personal computer (Windows XP operating system, Microsoft, USA; Pentium 4—3.0 GHz CPU, Intel, USA) with software developed by the authors (Visual C++ 6.0 development environment, Microsoft).
Analytical Algorithm
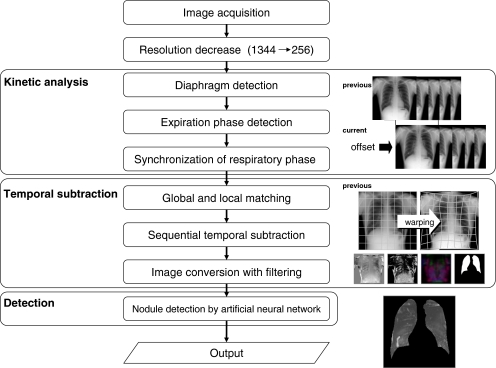
Figure 2 shows the analytical flow of the system. The detection process consisted of three analytical steps: the kinetic analysis step to analyze the breath phase, the temporal subtraction step to enhance potential nodules, and the nodule detection step associated with the deletion processing of false positives.
Fig 2.
Overall schema of analysis technique.
Automatic computer analysis of previous and current chest radiographs provided a static image on which the nodule location and track were drawn. The resolution and gray-level range of the chest radiograph were converted into 256 × 256 pixels and 8 bit, 256 grayscale, respectively, to shorten the computation time required for image analysis.
Kinetic Analysis
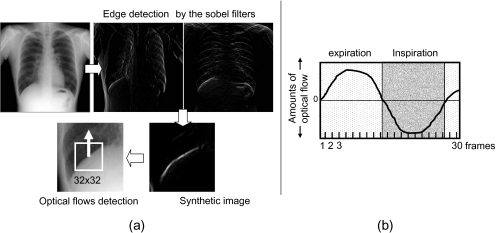
In this step, the previous and current images of the breath phase were synchronized to reduce the impact of temporal subtraction artifacts that occurred due to differences in breath phases. Synchronization processing of the breath phase was achieved by the detection and offset processing of deep inspiration frame images from each chest radiograph. The identification of these images was made by diaphragmatic analysis of the vector movement, which was detected by template matching. For setting the template region, the epiphrenal edge was detected by edge enhancement processing using differential filters, and the diaphragmatic midpoint was measured through a central search for its island. The edge of the diaphragm was detected from the synthetic images of the edge enhanced by the Sobel filters in the x and y direction, respectively. At this time, the diaphragm on the left side was excluded from the target of detection because the detection of the edge became unstable due to the overlap with the heart shadow. The false-positive edges were deleted by a rule-based method that used the area size as an index because synthetic images include edges other than the diaphragm. The region of the 32 × 32 matrix centered to the midpoint was applied as the template (Fig. 3a). The vector movement was detected by similarity evaluation compared with the subsequent frame image. The template was updated at each frame, and the vector movement was detected from all of the frame images except the last one.
Fig 3.
Optical flows in the diaphragm were detected to analyze movement (a), and the expiratory phase was determined using a rule-based method (b). The respiratory phase between the previous and current images was synchronized.
Usually, the diaphragm moves downward during expiration and upward during inspiration. Therefore, the analysis of vector movement was performed using a rule-based method for serial changes of the up-and-down movements. This identified the breath phase and the deep inspiration frame image, and synchronization of the breath phase for both the previous and current images was undertaken (Fig. 3b).
Temporal Subtraction
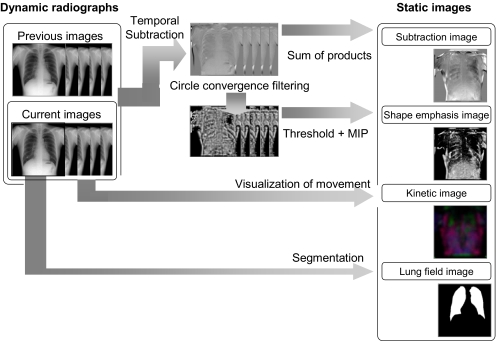
This step was performed to generate four static images from two chest radiographs using serial temporal subtraction processing and image processing with some filtering (Fig. 4).
Fig 4.
Sequential temporal subtraction processing and image processing with some filtering convert two breathing chest radiographs into four static images.
The following types of static image were generated: a temporal subtraction product sum image in which each temporal subtraction radiograph was obtained by the product sum; a concentration index maximum intensity projection (MIP) image, which involved concentration index filter processing12 and MIP processing of the temporal subtraction product sum image; a lung region image, in which the lung region was segmented; and a kinetic map image, which visualized the local kinetics of chest radiographs.
The temporal subtraction product sum image was obtained from the sum product of the temporal subtraction radiographs generated by the nonlinear image conversion associated with local and global matching (that is, the warping technique)10 and by sequential temporal subtraction processing. During the latter process, independent difference processes were continuously performed on images with the breath phase synchronized in chronological order.10 At this time, temporal subtraction processing was only performed for the expiration phase image. When there was a difference in the number of images between the previous and current radiographs, interpolation processing was performed for the subject with fewer images.
Concentration index-filtering processing was performed for the temporal subtraction radiograph obtained in the previous step. This enhanced the configuration of differences that appeared in the temporal subtraction radiograph. Threshold processing using the fixed threshold (the threshold value was 128 for the present study) and MIP processing enhanced the most distinctive pixel in the difference region and compressed several temporal subtraction radiographs into one static image.
The lung area was segmented by means of edge detection using the first derivative technique and the iterative contour-smoothing algorithm.5,13,14
The kinetic map visualized exercise that was carried out during the respiratory movement of each subregion compartmentalized in a reticular pattern. The computer algorithm used to generate this image was defined as a kinetic map algorithm,15 which allowed the compression of the breathing chest radiograph into a colored static image, and the conversion of the “direction” and “intensity” of the movement into “color” and “density,” respectively. In our system, conversion processing was only performed for the current radiograph, and then its kinetic map was acquired. The static image generated by this process was defined as the “feature image” for the purposes of our study.
Detection
In this step, the nodule shadow and its movement track were detected by analysis of the four static images obtained in the previous steps, using an artificial neural network.16–18 This had a three-layer structure with four units in the input layer, five units in the hidden layer, and one unit in the output layer. We plan to collect a significant amount of training data in the future and have chosen the artificial neural network (ANN) detection module so that we can respond to the system updates by revising the weighted coefficients obtained from learning in an easy and flexible manner.
The artificial neural network in this study used the pixel density value at the same coordinate within each image as an input signal and outputted the potentiality of the true nodule as a density value (Fig. 5). A higher density output occurred when the pixel that was subjected to analysis had a strong potential to be the true nodule. This analysis was performed for all of the pixels constituting the image. Thus, the ANN was the module outputting a single static grayscale image as an input signal for four static images.
Fig 5.
This ANN uses the pixel density value at the same coordinate of each image as an input signal and outputs the potentiality of the true nodule as a density value.
This study used a pair of chest radiographs from a normal patient as training data, in order to establish the artificial neural network system. A simulated nodule that synchronized the respiratory movement to the lower right lung region of the current radiograph was added. Configuration of the simulated nodule was circular, at 64 pixels in diameter, and 3% random noise was added as 70 pixels for the maximum density (Fig. 6). Density patterns of 2,400 types obtained from this chest radiograph were used as training data to build the artificial neural network.
Fig 6.
A simulated nodule that synchronized the respiratory movement to the lower right lung region of the current radiograph was added.
Evaluation of our Algorithm
The performance of this system was evaluated using seven normal patients with simulated nodules moving in synchronization with their breath at the lower right lung region. The detection rate of the simulated nodule and the kinetic imaging function were evaluated. The detection rate was evaluated by free-response receiver operating characteristic (FROC) analysis.19–22 The number of false positives per image and the true-positive rate were evaluated using the island number at the time point of binarization processing of ANN output images by various threshold values.
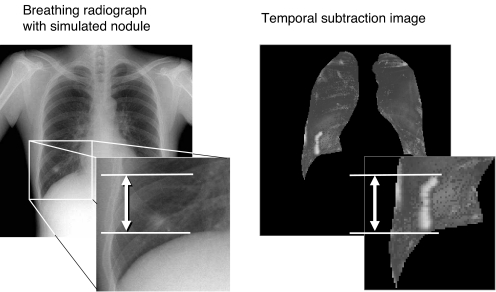
The range of an enhanced region that appeared on the temporal subtraction image was measured manually, to evaluate a quantitative kinetic function of the nodule (Fig. 7). The difference between the known kinetic amount and the results was calculated as the detected error. The significance of any difference was evaluated by paired t test.
Fig 7.
The kinetic imaging function was evaluated by manually measuring the range of the movement.
Results
Detection Rate of Simulated Nodule
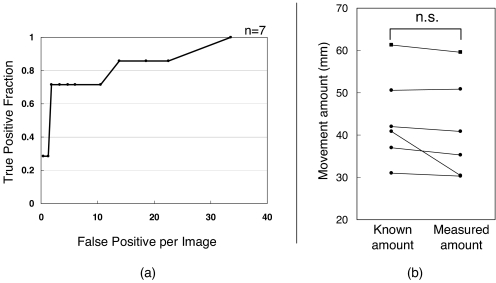
Figure 8a shows the FROC curve. The detection rate varied between 28.6% and 100%, and the mean number of false positives per image varied between 0 and 33.6. The transition of numbers of false positives per images was generally altered at higher levels. The performance considered the most effective was obtained with a detection rate of 71.4% and a mean number of false positives of 1.85.
Fig 8.
a Efficient nodule detection based on an initial result that has not been subject to false-positive deletion. b The average absolute value of the difference was 2.64 ± 3.82 mm, and there were no significant differences between the known and measured amounts (p = 0.174).
Kinetic Imaging Function of Nodules
Figure 8b shows the relationship in detection errors of the kinetic imaging function from six patients that were successfully detected from a total of seven. The average absolute value of the difference was 2.64 ± 3.82 mm, and there were no significant differences between the known and measured amounts (p = 0.174).
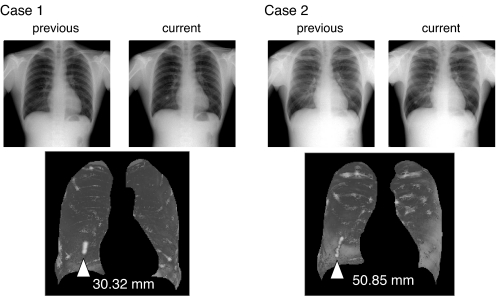
Figure 9 shows the kinetics of simulated nodules outputted by this system. Nodule tracks were drawn at high-density regions corresponding to the tracks of the simulated nodules.
Fig 9.
Nodule movement tracks were visualized as a white region.
Discussion
We observed two patterns of failure in breath phase synchronization: The first was in diaphragmatic detection, and the second was in the detection of vector movement. An effective solution for the first problem was to employ the detection algorithm developed by Powell et al. for precise diaphragmatic detection.23 To improve the detection accuracy for vector movement, it was necessary to use a different algorithm, such as the gradient method, instead of the template-matching method currently employed in our system. As an alternative to detecting respiratory kinetics by analyzing vector movement, the serial analytical method of the distance between the apex of the lung and the diaphragm has previously been used effectively by Tanaka et al.5
In temporal subtraction processing, the warping processing was carried out to correct serial morphological changes or posture changes between the current and previous images. This process reduced temporal subtraction artifacts but also prolonged the time required for analysis. The analysis time required for preprocessing and outputting the final images was approximately 60 s. The warping process that used the template-matching method accounted for 80% of this period. The image reduction process using the bicubic method was also a factor that delayed the analysis time. The analysis time might be further shortened by using high-performance hardware, adopting the gradient method in the warping process, and shifting to the linear method in the image reduction process. However, it will be necessary to reconstruct and evaluate the system because the current study did not cover the output images. Future improvements will therefore be necessary to shorten the analytical time and to reduce the number of artifacts simultaneously.
We considered the ANN nodule detection module of the present study to be highly effective, based on the results of the FROC analysis. Compared with other ANNs, this ANN can build a system with fewer learning samples. Commonly, the ANNs used for computer-assisted diagnosis in nodule detection utilize morphological or physical mathematical indices of potential nodules as input signals, such as concentration, dispersion, circularity, and spectra. These networks also analyze the pattern of such signals to output the ratio of truly positive nodule candidates for malignancy as an index, such as a percentage. Thus, large numbers of sample images are required for training data.
The present study used the pixel density index as a single input signal and could therefore acquire a density pattern in accordance with the resolution of the image as training data, even if there was only one available sample image. This characteristic is particularly effective for studies with fewer data points, such as our own, or for establishing a computer-aided diagnosis system for small numbers of clinical cases.
Analyzing the density pattern of pixels from four static images can therefore distinguish the density pattern of moving nodules, as the pattern of feature images drawn by moving nodules differs from that of tissues other than nodules. In the current study, the breathing chest radiograph was separately converted into morphological, positional, and kinetic information using the feature image. Nodules were then detected by comprehensively analyzing the information. Consequently, it might be possible for future studies to detect nodules more effectively by employing a feature image that differs from the one used in this study.
However, the current study did not use density information from adjacent pixels. The information from adjacent pixels relates directly to the target pixel. Excellent results might be easily obtained if the spatial relationship between pixels could be used as an input signal. The issue of including this information in analyses will be addressed in future studies.
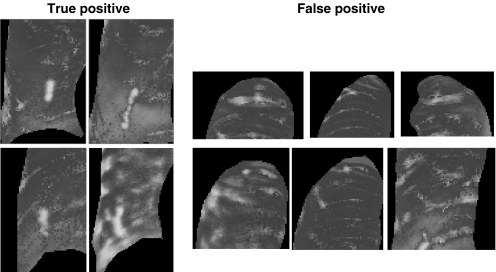
The number of false positives per image was large; however, this problem appeared to be easily rectified by simple deletion processing against morphological characteristics, such as circularity or size. This was because the nodule shadow tended to form a vertically long elliptical island, while the costal and clavicular shadows formed a horizontally long elliptical island (Fig. 10). Information about the spatial relationships between pixels might be useful for solving this problem. However, this algorithm has the advantages that the response to the filtering in the previous process can be evaluated independently from the spatial relationship and that the existing false-positive deletion process mentioned above is easily adapted in the subsequent analytical process.
Fig 10.
Shape characteristic of islands of true-positive and false-positive regions.
This study analyzed breathing chest images, which can be obtained at a few institutes and in rare instances. Additionally, only a small part of the Tanaka report was on the clinical utility of image analysis. This is therefore a relatively unexplored field, and applications are expected to be developed in the future. Regrettably, we could not detect any actual tumor mass in the limited time available. We predict that nodules can be detected and the kinetics can be depicted more easily using exemplary simulated nodules then using actual nodules. Thus, for real images with various morphologies and densities, the reproducibility might be reduced compared with the results of the current study.
The amount of training data extracted from a single case might be insufficient for a system corresponding to various cases. Hence, there is a requirement to improve the function by using samples including many variations and performing statistical classifications and analyses. This was a pilot study for detecting nodules and depicting kinetics targeting dynamic images. We intend to collect data continuously in the future and to update the system using a large amount of training data to improve its reproducibility and detection capability.
The configuration of the ANN and the weighted coefficient did not affect the reproducibility of the algorithm alone because the input signals to the ANN changed if the preprocessing methods and the filtering parameters were altered. Therefore, these parameters should be optimized simultaneously.
The treatment scheme for the radiation range in lung cancer radiotherapy is defined as the planning target volume (PTV) and is based on the internal target volume (ITV), which includes subject-moving errors influenced by breathing, heart beat, and peristalsis, errors at the time of patient setup, and errors caused by the treatment device.24 In the lower lung region, the PTV is usually given as ITV + 10–20 mm. The nodule shadows drawn by this system indicate the nodule moving range and are consequently considered equivalent to the ITV.
The maximum and minimum absolute values of the kinetic differences between the nodule track and the known kinetic amount according to this algorithm were 10.3 and 0.3 mm, respectively, and the mean was 2.64 ± 3.82 mm. In addition, there were no significant differences between the known amount and the measured amount. This suggests that the algorithm correctly evaluated the kinetics of the simulated nodule. Moreover, the ITV range was assumed to be precisely drawn, which would support the PTV decision. System expansion could develop “the automatic PTV setting system,” which sets the PTV by manual inputs of the margin size against the ITV.
In this system, breathing chest radiography was performed on patients in an upright posture, which contrasted with the supine position of patients receiving radiation treatment. Any influence of these postural differences and measures should be examined in future studies.
Conclusion
Our technique accurately evaluated the kinetic function of nodules and was effective in detecting a nodule on a breathing chest radiograph. Application of this technique is therefore expected to extend computer-aided diagnosis systems and to facilitate the development of an automatic planning system for radiation therapy.
Acknowledgments
We would like to acknowledge the students of Kodera Laboratory, Nagoya University, Japan, for their cooperation in the experiments and helpful discussions.
References
- 1.Annual Statistical Report of National Health Conditions. Tokyo: Health and Welfare Statistics Association; 2005. [Google Scholar]
- 2.Tanaka R, Sanada S, Suzuki M, Matsui T, Uoyama Y. New method of screening chest radiography with computer analysis of respiratory kinetics. Nippon Hoshasen Gijutsu Gakkai Zasshi. 2002;58:665–669. doi: 10.6009/jjrt.kj00001364425. [DOI] [PubMed] [Google Scholar]
- 3.Tanaka R, Sanada S, Kobayashi T, Suzuki M, Matsui T, Inoue H. Development of breathing chest radiography—study of exposure timing. Nippon Hoshasen Gijutsu Gakkai Zasshi. 2003;59:984–992. doi: 10.6009/jjrt.kj00000921844. [DOI] [PubMed] [Google Scholar]
- 4.Tanaka R, Sanada S, Suzuki M, Matsui T, Uoyama Y. New screening chest radiography with computer analysis of pulmonary marking movement and change in regional density. Nippon Hoshasen Gijutsu Gakkai Zasshi. 2002;58:1489–1496. doi: 10.6009/jjrt.kj00000921500. [DOI] [PubMed] [Google Scholar]
- 5.Tanaka R, Sanada S, Suzuki M, Kobayashi T, Matsui T, Inoue H, Yoshihisa N. Breathing chest radiography using a dynamic flat-panel detector (FPD) with computer analysis for a screening examination. Med Phys. 2004;31:2254–2262. doi: 10.1118/1.1769351. [DOI] [PubMed] [Google Scholar]
- 6.Tanaka R, Sanada S, Kobayashi T, Suzuki M, Matsui T, Matsui O. Computerized methods for determining respiratory phase on dynamic chest radiographs obtained by a dynamic flat-panel detector (FPD) system. J Digit Imaging. 2006;19:41–51. doi: 10.1007/s10278-004-1045-z. [DOI] [PMC free article] [PubMed] [Google Scholar]
- 7.Tanaka R, Sanada S, Okazaki N, Kobayashi T, Nakayama K, Matsui T, Hayashi N, Matsui O. Quantification and visualization of relative local ventilation on dynamic chest radiographs. Proc SPIE. 2006;6143:6143Y-1–6143Y-8. [Google Scholar]
- 8.Kobayashi T, Xu X-W, MacMahon H, Metz CE, Doi K. Effect of an computer-aided diagnosis scheme on radiologists performance in detection of lung nodules on radiographs. Radiology. 1996;199:843–848. doi: 10.1148/radiology.199.3.8638015. [DOI] [PubMed] [Google Scholar]
- 9.Aoyama M, Li Q, Katsuragawa S, MacMahon H, Doi K. Automated computerized scheme for distinction between benign and malignant solitary pulmonary nodules on chest images. Med Phys. 2002;29:701–708. doi: 10.1118/1.1469630. [DOI] [PubMed] [Google Scholar]
- 10.Ishida TS, Katsuragawa K, Nakamura K, MacMahon H, Doi K. Iterative image warping technique for temporal subtraction of sequential chest radiographs to detect interval change. Med Phys. 1999;26:1320–1329. doi: 10.1118/1.598627. [DOI] [PubMed] [Google Scholar]
- 11.Kakeda S, Nakamura K, Kameda K, Watanabe H, Nakata H, Katsuragawa S, Doi K. Improved detection of lung nodules by using a temporal subtraction technique. Radiology. 2002;224:145–151. doi: 10.1148/radiol.2241010719. [DOI] [PubMed] [Google Scholar]
- 12.Wei J, Hagihara Y, Kobatake H. Convergence index filter for detection of lung nodule candidates. IEICE Trans Inf Syst. 2000;D-II(1):118–125. [Google Scholar]
- 13.Xu XW, Doi K. Image feature analysis for computer-aided diagnosis: accurate determination of ribcage boundary in chest radiographs. Med Phys. 1995;22:617–626. doi: 10.1118/1.597549. [DOI] [PubMed] [Google Scholar]
- 14.Li L, Zheng Y, Kallergi M, Clark RA. Improved method for automatic identification of lung region on chest radiographs. Acad Radiol. 2001;8:629–638. doi: 10.1016/S1076-6332(03)80688-8. [DOI] [PubMed] [Google Scholar]
- 15.Tsuchiya Y, Kodera Y. Development of a kinetic analysis technique for PACS management and a screening examination in dynamic radiography. Nippon Hoshasen Gijutsu Gakkai Zasshi. 2005;61:1666–1674. doi: 10.6009/jjrt.kj00004022979. [DOI] [PubMed] [Google Scholar]
- 16.Rosenblatt F. The perceptron: a probabilistic model for information storage and organization in the brain. Phychol Rev. 1958;65:386–408. doi: 10.1037/h0042519. [DOI] [PubMed] [Google Scholar]
- 17.Minsky M, Papert S. Preceptron. Cambridge, MA: MIT; 1969. [Google Scholar]
- 18.Rumelhart DE, Hinton GE, Williams RJ. Learning internal representations by error propagation. In: Rumelhart DE, McClelland JL, editors. Parallel Distributed Processing: Explorations in the Microstructures of Cognition 1. Cambridge, MA: MIT; 1986. pp. 318–362. [Google Scholar]
- 19.Chakraborty DP, Breatnach ES, Yester MV. Digital and conventional chest imaging: a method ROC study of observer performance using simulated nodules. Radiology. 1986;158:35–39. doi: 10.1148/radiology.158.1.3940394. [DOI] [PubMed] [Google Scholar]
- 20.Chakraborty DP. Maximum likelihood analysis of free-response receiver operating characteristic (FROC) data. Med Phys. 1989;16:561–568. doi: 10.1118/1.596358. [DOI] [PubMed] [Google Scholar]
- 21.Shiraishi J, Kosakai K, Hatagata M, Higashida M, Watanabe S. Study of simple data sampling on free-response receiver operating (FROC) analysis. Nippon Hoshasen Gijutsu Gakkai Zasshi. 1991;47:620–626. [Google Scholar]
- 22.Fujita H, Shimura K, Shiraishi J, Nishihara S, Higashida Y, Yamashita K. Fundamentals of ROC analysis and its recent progress. Nippon Hoshasen Gijutsu Gakkai Zasshi. 1993;49:1685–1703. [Google Scholar]
- 23.Powell GF, Doi K, Katsuragawa S. Localization of inter-ribspaces for lung texture analysis and computer-aided diagnosis in digital chest images. Med Phys. 1988;15:581–587. doi: 10.1118/1.596209. [DOI] [PubMed] [Google Scholar]
- 24.ICRU Report No. 62. Prescribing, Recording and Reporting Photon Beam Therapy (Supplement to ICRU Report 50) Bethesda, MD: ICRU; 1999. [Google Scholar]


