Abstract
Reflecting its high resolution and contrast capabilities, microcomputed tomography (μCT) can provide an in vivo assessment of adiposity with excellent spatial specificity in the mouse. Herein, an automated algorithm that separates the total abdominal adiposity into visceral and subcutaneous compartments is detailed. This algorithm relies on Canny edge detection and mathematical morphological operations to automate the manual contouring process that is otherwise required to spatially delineate the different adipose deposits. The algorithm was tested and verified with μCT scans from 74 C57BL/6J mice that had a broad range of body weights and adiposity. Despite the heterogeneity within this sample of mice, the algorithm demonstrated a high degree of stability and robustness that did not necessitate changing of any of the initially set input variables. Comparisons of data between the automated and manual methods were in complete agreement (R2 = 0.99). Compared to manual contouring, the increase in precision and accuracy, while decreasing processing time by at least an order of magnitude, suggests that this algorithm can be used effectively to separately assess the development of total, visceral, and subcutaneous adiposity. As an application of this method, preliminary data from adult mice suggest that a relative increase in either subcutaneous, visceral, or total fat negatively influences skeletal quantity and that fat infiltration in the liver is greatly increased by a high-fat diet.
Key words: Microcomputed tomography, in vivo, adipose, fat, mouse, separation, edge detection, Canny, subcutaneous, visceral
Introduction
Microcomputed tomography (μCT) is an imaging modality that has been used extensively to describe the morphology and microarchitecture of hard tissues1–3. More recently, the application of μCT has been extended to image adipose tissue in mice in vivo4,5. Similar to micromagnetic resonance imaging, and in contrast to most current noninvasive imaging techniques such as dual-energy X-ray absorptiometry or nuclear magnetic resonance, μCT has the ability to provide spatial information on the three-dimensional distribution of adipose deposits throughout the animal. This information can be critical for the assessment of obesity, diabetes, or cardiovascular risk factors6,7 as different types of adipose tissue at different locations (subcutaneous versus visceral) play different physiological roles. For instance, visceral fat tissue is a significant risk factor for type 2 diabetes8 and coronary artery disease9 and more predictive of obesity-induced pathologies than either the total or subcutaneous adiposity alone10.
While the correct interpretation of adiposity data in metabolism-, obesity-, and diabetes-related research may rely on the detailed volumetric assessment of distinct adipose compartments, it is also clear that such evaluations have to be performed in a precise, accurate, and efficient manner. The accurate in vivo determination of visceral fat volume requires the scanning of the entire abdominal region11,12. The abdominal muscular wall separating the visceral from the subcutaneous compartment can be used as the demarcation line for visceral adipose tissue and subcutaneous adipose tissue because of the higher tissue density of muscle13. In any given two-dimensional μCT slice, this line can be traced by manually drawn contour lines.
Unfortunately, the manual drawing of contour lines is cumbersome, is labor-intensive, and may not yield the desired precision and accuracy14–17. Semiautomated algorithms to separate visceral from subcutaneous fat are much faster but may require the manual definition of a seed point18–20. A fully automated method to quantify visceral adipose tissue in magnetic resonance images (MRI) was recently suggested21. This method which is based on knowledge-based curve fitting and morphological operations is precise but relatively slow to complete an anatomical region comprising 15 slices with a display matrix of 512 × 512 (7 min). Here, we present a precise, robust, and automated algorithm that is primarily comprised of Gaussian filtering and Canny edge detection22 to isolate and quantify visceral and subcutaneous adiposity in μCT tomographies.
Methods
Microcomputed Tomography Scanning and Reconstruction All animal procedures were approved by the University’s Animal Care and Use Committee. The automated separation procedure was initially tested in 74 5-month-old C57BL/6J mice with large differences in body mass and whole-body adiposity23. Briefly, the entire body of each mouse from the base of the skull to the distal tibia was scanned transversally at an isotropic voxel size of 76 μm (VivaCT 40, Scanco Medical Inc., SUI, 45 kV, 133 μA, 300-ms integration time, 512 × 512-pixel matrix). Fixed anatomical landmarks were used to define the abdominal (lumbar) volume of interest (VOI) between the proximal end of the L1 vertebra and the distal end of the L5 vertebra (Fig. 1). Reconstructed images were filtered with a constrained 3D Gaussian filter to reduce noise and segmented by a global band pass threshold filter24. The range of voxel densities that defined the adipose tissue was determined by the histogram method25, yielding values between 4.9% and 8.7% of the maximum grayscale value2. The visceral (VAT) and subcutaneous adipose tissue (SAT) compartments in the abdominal region were separated from each other via an automated separation technique described below, and fat volumes were computed by direct counting of voxels.
Fig 1.
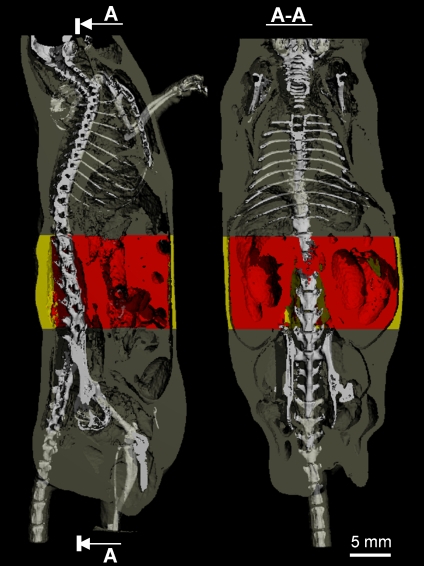
A sagittal (left panel) and coronal (right panel) view of a mouse body scanned by in vivo microcomputed tomography. The skeleton was superimposed upon the adipose tissue (gray) to allow for greater spatial clarity. The abdominal VOI, in which the separation between subcutaneous (yellow) and visceral (red) fat was performed, was defined by precise skeletal landmarks.
Description of the Automated Separation Technique The automated algorithm separating between visceral and subcutaneous fat involved four principal steps:
-
Step 1:
Generation of the mask for the animal body
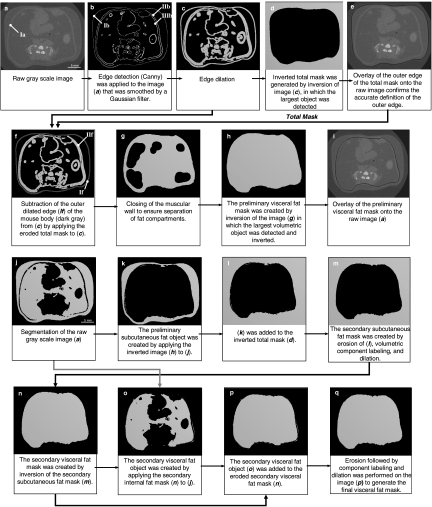
In any given raw grayscale image (Fig. 2, a), the surface of the mouse (corresponding to the skin, defined as outer edge, Fig. 2, b, Ib) and the edges of the abdominal muscular layers (inner edge between muscular wall and VAT, Fig. 2, b, IIIb, and outer edge between muscular wall and SAT, Fig. 2, b, IIb) were detected. To distinguish the edges from background texture and noise, the raw grayscale image was smoothed by applying a Gaussian convolution with a support value of five (this value should approximate the size of the background texture, which is dependent on the image resolution). The Canny algorithm with hysteresis controlled by two thresholds (Fig. 3) was then applied to detect the edges22. The hysteresis setting was chosen to minimize the number of spurious and undesirable edge fragments in the output image while identifying major edges with sufficient detail (Fig. 2, b). Upon identification of the edges in the image, they were dilated by two voxels (Fig. 2, c) to create a solid outer contour around the mouse body and to connect as many of the potentially interrupted edges of the abdominal muscular wall as possible. Inversion of the dilated object created the following two different components: the background object representing the space surrounding the mouse body (Fig. 2, d) and the foreground object comprising elements pertaining to the body of the mouse.
Fig 2.
Identification of the outer edge (a–e) and separation of visceral and subcutaneous fat (f–i). The contours Ia and IIf represent the abdominal muscular wall. Ib is the outer edge of the mouse body. IIb defines the interface of the muscular wall and VAT. IIIb defines the interface of the muscular wall and SAT. In images j–m and n–q, the subcutaneous and visceral fat mask were generated, respectively. Objects in black represent background.
Fig 3.
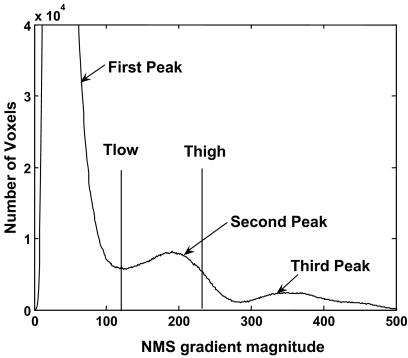
Trimodal histogram of the nonmaximal suppression (NMS) gradient magnitude that serves to select the hysteresis threshold Thigh and Tlow for adipose tissue. The large first peak at the lower end of the gradient spectrum represents texture of the image background while the third peak for the highest gradient is associated with edges of calcified tissue. The second peak in the intermediate gradient range describes the edges of adipose tissue. Thigh was identified at two thirds of the magnitude of the second peak and Tlow coincided with the minimum (valley) between the first and second peak.
To allow this automated algorithm to run without operator intervention, it was critical that the volume of the background object represented the largest volume in the image. This ensured that volumetric component labeling26 can detect the background object independent of the size and shape of the mouse. In the next step, the inversion of the background object was reversed. Because of the previous dilation, the outer edge of this inverted object extended two voxels beyond the surface of the mouse body. The appropriate erosion of the inverted body produced the total mask where the outer edge matched the body surface of the raw grayscale image (Fig. 2, e).
-
Step 2:
Generation of the mask for visceral adipose tissue
To create the preliminary visceral fat mask, the outer edge of the mouse (Fig. 2, e) was removed from the dilated object (Fig. 2, c), rendering the muscular wall as the outermost surface (Fig. 2, f, If). To this end, the size of the eroded total mask was diminished by an additional three voxels. The three voxels consisted of one edge voxel defined by the Canny method plus two voxels that had been added during the dilation. This diminished mask was applied to the dilated edge object (Fig. 2, c) to remove the outer edge completely. A morphological closing operation was then used to connect the muscular wall along its entire edge and to spatially separate the space surrounding the abdominal muscular wall from the visceral space (Fig. 2, g). All the fat volume encompassed by this muscular wall edge was defined as the visceral component.
The preliminary subcutaneous fat mask was produced in analogy to the operations described in the step 1 for the generation of the total mask. However, in contrast to the surface of the mouse, the muscle layer does not exist as a discrete surface. Rather, the muscle layer has an inner and outer edge which may be several voxels apart from each other. The closed object (Fig. 2, g) was inverted and the largest component in the image (the outer space surrounding the abdominal muscular wall) was subsequently dilated, which in effect defined a middle “edge” in the muscle layer. The dilation by seven voxels included one edge voxel defined by the Canny method, four dilation voxels (two in each directions), plus two voxels that represented half the thickness of the abdominal muscular wall. These operations produced the preliminary subcutaneous fat mask, the inversion of which led to the preliminary visceral fat mask (Fig. 2, h–i). The separation between visceral and subcutaneous fat compartments was checked automatically and the subcutaneous and visceral masks were corrected in the two following steps.
-
Step 3:
Correction of the subcutaneous fat mask
Any potential extension of subcutaneous adiposity into visceral adiposity was checked and corrected for. The preliminary subcutaneous fat object (Fig. 2, k) was created by applying the subcutaneous fat mask to the segmented fat image (Fig. 2, j). This object was added to the inverted total mask (Fig. 2, l). Any spikes, small speckles, or islands present in the image, representing subcutaneous fat that had protruded into the visceral fat compartment, were removed from the combined object by a surface erosion of three voxels. This procedure also disconnected individual spikes. Then, component labeling was applied to select the largest component within the image (subcutaneous fat). The selected component was eroded by three voxels (the number of voxels was defined empirically as half the thickness of a spike). The newly created mask became the refined secondary subcutaneous fat mask (Fig. 2, m). The refined secondary visceral fat mask, produced by inversion (Fig. 2, n) of the secondary subcutaneous fat mask, was used for the final correction step described below.
-
Step 4:
Correction of the visceral fat mask
Similar to the correction of the subcutaneous mask, an intrusion of visceral adiposity into the subcutaneous region was checked and corrected for. The refined secondary visceral fat object (Fig. 2, o) was created by applying the secondary visceral fat mask to the segmented fat image and added to the eroded secondary visceral fat mask (Fig. 2, p). The magnitude of the erosion was selected empirically to amount to seven voxels, corresponding to the sum of the average depth of the potential intrusion and the average abdominal muscular wall thickness. This amount of erosion was determined to be appropriate for the range of mice assessed in this study, but the number of required voxels may need to be adjusted based on the resolution of the scanned images. The portion of visceral fat that extended into the subcutaneous compartment was removed from the final object using procedures identical to those described in step 3. The outcome of these steps was the final visceral fat mask (Fig. 2, q), the inversion of which gave rise to the final subcutaneous fat mask.
Validation of the Algorithm The accuracy of the algorithm was determined by visual assessment and by comparisons between automatically determined adipose volumes and those calculated from manually drawn contour lines. For the visual assessments, the overlay of the final visceral fat mask onto the grayscale image was examined slice by slice (2D check). The algorithm was deemed to be accurate if the automatically generated outline of the visceral fat mask matched the abdominal muscular wall. In addition, the visual check of the combined 3D object comprising the segmented subcutaneous and visceral adipose segments was performed.
To test the accuracy, potential bias, and robustness of the automatic separation technique, the acquired visceral adiposity volumes were compared to data obtained by manually drawing contour lines around the visceral fat volume within each μCT slice. The manual definition of the visceral fat volume was performed by a single skilled operator to avoid interuser variability. Since the manual tracing of visceral fat is an extremely cumbersome procedure, a smaller subset of 12 mice was selected for this comparison. These 12 animals were chosen such that their total body volume approximated the range of the entire sample of 74 mice. To this end, the total body volume of the 74 mice was determined by μCT, put into ascending order, from which each sixth data point was selected for manual analysis. We validated the algorithm based on comparisons between the VAT volumes as the SAT volume is simply calculated by subtracting VAT from the total adipose volume. All evaluation parameters such as μCT thresholds and evaluation regions were identical between the manual and automated fat segmentation procedures. Thus, any difference in data produced by the two methods could be attributed to either manual or automated contouring.
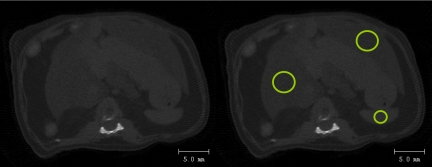
Application of the Algorithm The methodology was applied to evaluate scan data from a longitudinal study, in which 8-week-old male C57BL/6J mice (The Jackson Laboratories, Bar Harbor, ME, USA) were randomized into regular-diet and high-fat-diet groups (n = 8 each). Regular-diet animals were maintained on a normal chow (Lab Diets, RMH 3000, Richmond, IA, USA) and high-fat-diet animals were fed a 45-kcal% high-fat diet (Test Diets, Cat No:58V8, Richmond, IA, USA) to induce obesity. All animals had free access to food and water. In vivo μCT scans, similar to those described above, were performed at 5, 8, and 11 months of age after the animals had been on their respective diet for 3, 6, or 9 months. Total bone (BV) and fat volume (FV) within the ROI (whole body without head and feet) as well as VAT and SAT volume within the abdominal region were determined. Liver and spleen density values were measured in a slice comprising the intervertebral disc between the 13th thoracic and first lumbar vertebrae (Fig. 4). The liver-to-spleen (L/S) density ratio, an indicator of the degree of fat infiltration in the liver27–29, was calculated at 8 and 11 months of age, the time points at which the largest degree of hepatic steatosis would be expected.
Fig 4.
Left: a raw μCT image from the region between the 13th thoracic and first lumbar vertebra was used to calculate the degree of fat in the liver. No contrast agent was used. Right: density values were determined for all voxels within the highlighted circular regions (12 mm2 for liver and 3 mm2 for spleen). These regions were selected as to be approximately in the center of the spleen and the left and right lobes of the liver. The average liver density of each mouse was calculated as the average of the two lobes.
Statistics To test whether the automated algorithm produced data that were statistically indistinguishable from manually drawn contour lines, paired t tests were performed. The Bland–Altman method was used to qualitatively assess the agreement between the procedures, providing estimates of systematic and random errors. A two-tailed t test was used to check if the linear regression slope and intercept were significantly different from the line of equality (slope of one and intercept of zero). Differences in fat infiltration in the longitudinal study were determined by two-tailed t tests. The significance level was set at α = 0.05.
Results
The automatic algorithm was initially tested across 74 mice with a broad range of body weights (18.4–50.4 g) and percent body fat (10–50%) and showed a high degree of stability and robustness. The automated procedure did not require changing of the initially determined input parameters such as filters, threshold settings, or morphological operation values across all mice used in this study. Generally, these input parameters will vary with different scan protocols and will be influenced by the scan resolution, energy–intensity value, or integration time. In this study, the input parameters were estimated for a mouse that was close to the average weight of the entire sample and checked in those mice with the smallest and greatest body mass.
On a single HP workstation, for an average VOI comprising about 220 slices, the automated algorithm took less than 1 min to complete the separation between visceral and subcutaneous fat compartments and to calculate volumetric fat data. In great contrast to the automatic evaluation, the manual assessment of the same region by an experienced operator took about 1–1.5 h because of the cumbersome process of manually drawing contour lines.
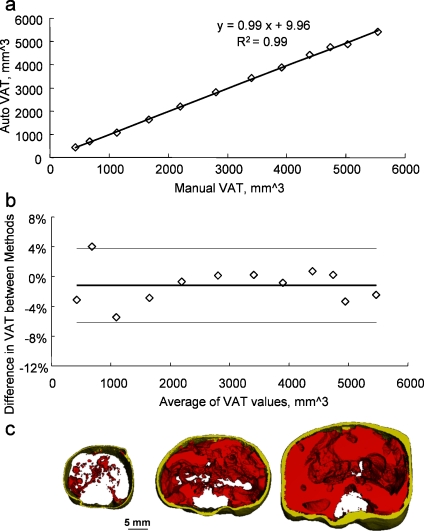
Qualitatively, the visual inspection of the segmented 2D μCT slices did not reveal any differences between images produced by either manual or automatic contouring (Fig. 5) despite the large differences in adiposity between mice within this sample (Fig. 6). Quantitatively, the calculated values for VAT were very highly correlated between the unsupervised automatic and the manual approach (R2 = 0.99, p < 0.001, Fig. 6). In addition, the slope of the trend line was 0.99, demonstrating near-perfect agreement between the two methods of separation. This agreement was determined statistically, with the null hypothesis stating that the slope of the trend line will be equal to 1 and that the intercept will be equal to 0. Both slope and intercept p values were greater than the significance level indicating that there were no significant differences between the two methods.
Fig 5.
A typical abdominal transverse mCT section from an adult mouse in which the contour line that separated visceral from subcutaneous compartments was (a) drawn manually or (b) produced by the automated algorithm. The two segmentation methods produced very similar segmented areas of visceral (red) or subcutaneous (yellow) fat (c, d).
Fig 6.
Direct comparison of visceral adipose tissue (VAT) values between the automated algorithm and the manual tracing method (n = 12). a Regression between the manual and automatic data produced an excellent coefficient of determination. b Bland–Altman plot comparing the relative difference in VAT values between the two methods. Solid line represents the mean of the relative differences between the algorithm and the manual data as calculated by (auto − manual) / (average of manual and auto). Dashed lines represent the 95% confidence intervals. c Representative segmented images of abdominal VOIs showing the large range in visceral and subcutaneous adipose volumes.
The Bland–Altman plot revealed that the mean relative difference between manual and automatic VAT assessment was very low (1.15%), that no systematic errors occurred, and that the calculated difference did not depend on the magnitude of the visceral fat volume (Fig. 6). Confirming the equivalence of the two methods suggested by the linear regression and the Bland–Altman plot, a paired t test showed that VAT data generated by manual contouring were statistically indistinguishable from the dataset produced by the automated separation algorithm (p = 0.96).
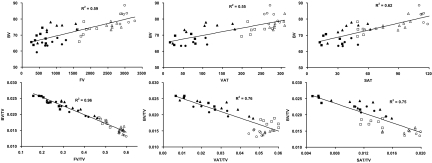
As an application of the above method and to identify potential associations between specific fat compartments and the skeleton, skeletal BV was correlated with total body fat (FV), visceral adipose tissue (VAT), and subcutaneous adipose tissue (SAT) in animals fed either a regular- or high-fat diet over the course of 9 months. The volume of all three fat compartments was moderately correlated (R2 = 0.55–0.62) with skeletal volume (Fig. 7), reflecting at least in part that adiposity increases with the size (volume) of the mouse. Perhaps more interestingly, these correlations became stronger (R2 = 0.75–0.96) and negative when normalizing data to the total volume of each animal (TV). Thus, as the proportion of fat (FV/TV, VAT/TV, or SAT/TV) within the mouse increased, the proportion of bone decreased (Fig. 7).
Fig 7.
Top row: correlations between absolute values of bone volume (BV) and either total body fat volume (FV), visceral adipose tissue (VAT), or subcutaneous adipose tissue (SAT) across mice that were raised either on a regular (solid markers) or high-fat diet (hollow markers). Squares, triangles, and circles correspond to data generated at 3, 6, and 9 months of age, respectively. Bottom row: correlations between the same variables when normalized to the volume of each animal (TV).
The ratio of liver density to spleen density, a measure of fat infiltration in the liver, was significantly lower in high-fat-diet mice than in regular-diet mice, both at 8 months (52.9%, p < 0.0001) and 11 months (69.5%, p < 0.0001) of age. The large differences in liver density values between regular-chow and high-fat-diet animals at all time points caused liver density data to cluster around two points (i.e., density differences within each diet group and between time points were much smaller than the difference between the two diet groups) and, therefore, correlations between volumes of specific adipose compartments and liver density could not be performed for the entire dataset.
Discussion
The accurate determination of both body fat accumulation and distribution is critical for assessing the impact of metabolic and diabetic risk factors in transgenic and/or wild-type mice. The principal aim of this study was to develop an automated separation method to spatially delineate fat compartments in in vivo μCT images. The proposed adipose separation algorithm is based on edge detection and mathematical morphological operations that identify the body surface, perform a preliminary separation between VAT and SAT, and, after automatic correction, achieve a precise and accurate separation between the adipose deposits. Testing of the automated procedure in a group of 74 animals with greatly varying body composition revealed that initially set input variables such as filters, thresholds, and morphological operation values were very robust against differences in body size and adiposity. Direct comparisons with data generated by manually drawn contour lines further emphasized the accuracy and reliability of the algorithm. The application of this method towards identifying associations between bone, fat, and liver density demonstrated its potential for the use in mouse models of obesity and diabetes.
The 74 mice used for the initial evaluation of the method were a subset of animals in which the ability of in vivo μCT scanning to serve as a substitute for ex vivo measurements of fat pads was tested recently23. Results showed that the weight of the visceral fat pad weight was highly correlated with the μCT-determined visceral fat volume (R2 = 0.95, p < 0.001). The correlation between the subcutaneous fat pad weight and the μCT-determined subcutaneous fat volume was equally high (R2 = 0.91, p < 0.001). As the separation of fat compartments was accomplished by the algorithm described here, the high coefficients of determination for the ex vivo–in vivo correlations corroborated the accuracy of the developed technique.
Most clinical studies in which abdominal adipose compartments are evaluated employ manual tracing methods. An automated method for the unsupervised assessment of visceral adiposity by MRI in human subjects was proposed recently21. Similar to our method, two different masks (adipose vs nonadipose) segmented the specific tissue compartments. Their method, however, involved knowledge-based curve fitting and morphological “open” and “close” operations that were performed on a slice-by-slice basis, requiring significantly more computational time. Also, the lack of built-in procedures that check on the accuracy of the final masks may cause very small adipose segments erroneously to be assigned to either visceral or subcutaneous compartments.
The input variables for the algorithm proposed here were set prior to the analysis of all mice and, despite the large range of animal weights and adiposity in this sample, did not require any adjustments even in the lightest or heaviest mice. Adjustments would be expected if scan parameters such as resolution or integration time were altered. It is also important to note that this method was specifically designed to compute volumes of visceral and subcutaneous adiposity in the abdominal region and that the application of this algorithm to regions outside the abdomen may involve substantial alterations.
Conclusion
The high resolution and good contrast of μCT allows the precise volumetric quantification of adipose tissue with high spatial discrimination4,23. The algorithm developed here standardizes and automates the analysis of the distribution of specific adipose compartments within the abdomen of small animals. The algorithm is precise, accurate, robust, and, compared to the cumbersome process of manually drawing contour lines, provides large savings in time and labor costs. Preliminary data generated by the automated separation algorithm in a longitudinal study of adipose development in the mouse indicate that a relative increase in either subcutaneous, visceral, or total fat negatively influences skeletal quantity and that fat infiltration in the liver is greatly increased by a high-fat diet.
Acknowledgements
Financial support by the National Institute of Arthritis and Musculoskeletal and Skin Diseases, National Science Foundation, and the Wallace Coulter Foundation is gratefully acknowledged.
Conflict of Interest None of the authors have any conflict of interest
References
- 1.Muller R, Hahn M, Vogel M, Delling G, Ruegsegger P. Morphometric analysis of noninvasively assessed bone biopsies: comparison of high-resolution computed tomography and histologic sections. Bone. 1996;18(3):215–220. doi: 10.1016/8756-3282(95)00489-0. [DOI] [PubMed] [Google Scholar]
- 2.Ruegsegger P, Koller B, Muller R. A microtomographic system for the nondestructive evaluation of bone architecture. Calcif Tissue Int. 1996;58(1):24–29. doi: 10.1007/BF02509542. [DOI] [PubMed] [Google Scholar]
- 3.Garman R, Rubin C, Judex S. Small oscillatory accelerations, independent of matrix deformations, increase osteoblast activity and enhance bone morphology. PLoS ONE. 2007;2:e653. doi: 10.1371/journal.pone.0000653. [DOI] [PMC free article] [PubMed] [Google Scholar]
- 4.Rubin CT, Capilla E, Luu YK, Busa B, Crawford H, Nolan DJ, Mittal V, Rosen CJ, Pessin JE, Judex S. Adipogenesis is inhibited by brief, daily exposure to high-frequency, extremely low-magnitude mechanical signals. Proc Natl Acad Sci U S A. 2007;104(45):17879–17884. doi: 10.1073/pnas.0708467104. [DOI] [PMC free article] [PubMed] [Google Scholar]
- 5.Bastie CC, Zong H, Xu J, Busa B, Judex S, Kurland IJ, Pessin JE. Integrative metabolic regulation of peripheral tissue fatty acid oxidation by the SRC kinase family member Fyn. Cell Metab. 2007;5(5):371–381. doi: 10.1016/j.cmet.2007.04.005. [DOI] [PubMed] [Google Scholar]
- 6.Chiba Y, Saitoh S, Takagi S, Ohnishi H, Katoh N, Ohata J, Nakagawa M, Shimamoto K. Relationship between visceral fat and cardiovascular disease risk factors: the Tanno and Sobetsu study. Hypertens Res. 2007;30(3):229–236. doi: 10.1291/hypres.30.229. [DOI] [PubMed] [Google Scholar]
- 7.Weisberg SP, McCann D, Desai M, Rosenbaum M, Leibel RL, Ferrante AW., Jr Obesity is associated with macrophage accumulation in adipose tissue. J Clin Invest. 2003;112(12):1796–1808. doi: 10.1172/JCI19246. [DOI] [PMC free article] [PubMed] [Google Scholar]
- 8.Haffner SM. Abdominal adiposity and cardiometabolic risk: do we have all the answers? Am J Med. 2007;120(9 Suppl 1):S10–S16. doi: 10.1016/j.amjmed.2007.06.006. [DOI] [PubMed] [Google Scholar]
- 9.Taguchi R, Takasu J, Itani Y, Yamamoto R, Yokoyama K, Watanabe S, Masuda Y. Pericardial fat accumulation in men as a risk factor for coronary artery disease. Atherosclerosis. 2001;157(1):203–209. doi: 10.1016/S0021-9150(00)00709-7. [DOI] [PubMed] [Google Scholar]
- 10.Fox CS, Massaro JM, Hoffmann U, Pou KM, Maurovich-Horvat P, Liu CY, Vasan RS, Murabito JM, Meigs JB, Cupples LA, D’Agostino RB, Sr, O’Donnell CJ. Abdominal visceral and subcutaneous adipose tissue compartments: association with metabolic risk factors in the Framingham Heart Study. Circulation. 2007;116(1):39–48. doi: 10.1161/CIRCULATIONAHA.106.675355. [DOI] [PubMed] [Google Scholar]
- 11.Despres JP, Moorjani S, Lupien PJ, Tremblay A, Nadeau A, Bouchard C. Regional distribution of body fat, plasma lipoproteins, and cardiovascular disease. Arteriosclerosis. 1990;10(4):497–511. doi: 10.1161/01.atv.10.4.497. [DOI] [PubMed] [Google Scholar]
- 12.Kissebah AH, Krakower GR. Regional adiposity and morbidity. Physiol Rev. 1994;74(4):761–811. doi: 10.1152/physrev.1994.74.4.761. [DOI] [PubMed] [Google Scholar]
- 13.Urbanchek MG, Picken EB, Kalliainen LK, Kuzon WM., Jr Specific force deficit in skeletal muscles of old rats is partially explained by the existence of denervated muscle fibers. J Gerontol A Biol Sci Med Sci. 2001;56(5):B191–B197. doi: 10.1093/gerona/56.5.b191. [DOI] [PubMed] [Google Scholar]
- 14.Seidell JC, Bakker CJ, der KK. Imaging techniques for measuring adipose-tissue distribution—a comparison between computed tomography and 1.5-T magnetic resonance. Am J Clin Nutr. 1990;51(6):953–957. doi: 10.1093/ajcn/51.6.953. [DOI] [PubMed] [Google Scholar]
- 15.Donnelly LF, O’Brien KJ, Dardzinski BJ, Poe SA, Bean JA, Holland SK, Daniels SR. Using a phantom to compare MR techniques for determining the ratio of intra abdominal to subcutaneous adipose tissue. AJR Am J Roentgenol. 2003;180(4):993–998. doi: 10.2214/ajr.180.4.1800993. [DOI] [PubMed] [Google Scholar]
- 16.Poll LW, Wittsack HJ, Koch JA, Willers R, Scherer A, Kapitza C, Heinemann L, Modder U. Quantification of total abdominal fat volumes using magnetic resonance imaging. Eur J Med Res. 2002;7(8):347–352. [PubMed] [Google Scholar]
- 17.Armao D, Guyon JP, Firat Z, Brown MA, Semelka RC. Accurate quantification of visceral adipose tissue (VAT) using water-saturation MRI and computer segmentation: preliminary results. J Magn Reson Imaging. 2006;23(5):736–741. doi: 10.1002/jmri.20551. [DOI] [PubMed] [Google Scholar]
- 18.Elbers JM, Haumann G, Asscheman H, Seidell JC, Gooren LJ. Reproducibility of fat area measurements in young, non-obese subjects by computerized analysis of magnetic resonance images. Int J Obes Relat Metab Disord. 1997;21(12):1121–1129. doi: 10.1038/sj.ijo.0800525. [DOI] [PubMed] [Google Scholar]
- 19.Bandekar AN, Naghavi M, Kakadiaris IA. Automated pericardial fat quantification in CT data. Conf Proc IEEE Eng Med Biol Soc. 2006;1:932–935. doi: 10.1109/IEMBS.2006.4397556. [DOI] [PubMed] [Google Scholar]
- 20.Bandekar A, Naghavi M, Kakadiaris I. Performance evaluation of abdominal fat burden quantification in CT. Conf Proc IEEE Eng Med Biol Soc. 2005;3:3280–3283. doi: 10.1109/IEMBS.2005.1617177. [DOI] [PubMed] [Google Scholar]
- 21.Liou TH, Chan WP, Pan LC, Lin PW, Chou P, Chen CH. Fully automated large-scale assessment of visceral and subcutaneous abdominal adipose tissue by magnetic resonance imaging. Int J Obes (Lond) 2006;30(5):844–852. doi: 10.1038/sj.ijo.0803216. [DOI] [PubMed] [Google Scholar]
- 22.Canny J. A computational approach to edge detection. IEEE Trans Pattern Anal Mach Intell. 1986;8(6):679–698. doi: 10.1109/TPAMI.1986.4767851. [DOI] [PubMed] [Google Scholar]
- 23.Luu YK, Lublinsky S, Ozcivici E, Capilla E, Pessin JE, Rubin CT, Judex S: In vivo quantification of subcutaneous and visceral adiposity by micro-computed tomography in a small animal model. Med Eng Phys (in press), 2008 May 15 [DOI] [PMC free article] [PubMed]
- 24.Jensen MD, Kanaley JA, Reed JE, Sheedy PF. Measurement of abdominal and visceral fat with computed tomography and dual-energy X-ray absorptiometry. Am J Clin Nutr. 1995;61(2):274–278. doi: 10.1093/ajcn/61.2.274. [DOI] [PubMed] [Google Scholar]
- 25.Peng Q, McColl RW, Ding Y, Wang J, Chia JM, Weatherall PT. Automated method for accurate abdominal fat quantification on water-saturated magnetic resonance images. J Magn Reson Imaging. 2007;26(3):738–746. doi: 10.1002/jmri.21040. [DOI] [PubMed] [Google Scholar]
- 26.Lublinsky S, Ozcivici E, Judex S. An automated algorithm to detect the trabecular–cortical bone interface in micro-computed tomographic images. Calcif Tissue Int. 2007;81(4):285–293. doi: 10.1007/s00223-007-9063-8. [DOI] [PubMed] [Google Scholar]
- 27.Ricci C, Longo R, Gioulis E, Bosco M, Pollesello P, Masutti F, Croce LS, Paoletti S, de BB, Tiribelli C, Dalla PL. Noninvasive in vivo quantitative assessment of fat content in human liver. J Hepatol. 1997;27(1):108–113. doi: 10.1016/S0168-8278(97)80288-7. [DOI] [PubMed] [Google Scholar]
- 28.Longo R, Ricci C, Masutti F, Vidimari R, Croce LS, Bercich L, Tiribelli C, Dalla PL. Fatty infiltration of the liver. Quantification by 1 H localized magnetic resonance spectroscopy and comparison with computed tomography. Invest Radiol. 1993;28(4):297–302. doi: 10.1097/00004424-199304000-00006. [DOI] [PubMed] [Google Scholar]
- 29.Kodama Y, Ng CS, Wu TT, Ayers GD, Curley SA, Abdalla EK, Vauthey JN, Charnsangavej C. Comparison of CT methods for determining the fat content of the liver. AJR Am J Roentgenol. 2007;188(5):1307–1312. doi: 10.2214/AJR.06.0992. [DOI] [PubMed] [Google Scholar]


