Abstract
A series of artifact images, obtained over 5 years of performance testing, of both computed radiography (CR) and integrated digital radiographic X-ray imaging detectors are presented. The images presented are all either flat field or test object images and show artifacts previously either undescribed in the existing literature or meriting further comment. The artifacts described are caused by incorrect flat field corrections, a failing amplifier, damaged detector lines affecting their neighbors, lost information between neighboring detector tiles, image retention, delamination of a detector, poor setup of mechanical movements in CR, suckers damaging a CR plate, inappropriate use of grid suppression software, inappropriate use of a low pass spatial frequency filter, and unsharp masking filters. The causes and significance of the artifacts are explained and categorized as software or hardware related. Actions taken to correct the artifacts are described and explained. This work will help physicists, radiographers, and radiologists identify various image quality problems and shows that quality assurance is useful in identifying artifacts.
Key words: Computed radiography, digital radiology, image artifact, radiography, quality assurance, diagnostic image quality
Background
There is a range of different digital x-ray detector technologies available, and each is susceptible to a number of artifacts. As the performance of digital detectors has the potential to affect both patient care and dose, it is necessary to assess them with regular quality assurance (QA) tests.1 Many of the artifacts observed in computed radiography (CR) images have previously been documented.2–7 These include dusty plates, scratches, cracks, scanline dropout, moiré patterns, ghosting, double loading of cassettes, and backscatter. As integrated digital radiographic (DR) technologies are much less established than CR, there is much less in the peer reviewed literature available documenting artifacts observed. There is some previous description of variations in the sensitivity across a DR detector8–12 as well as extensive investigations of image lag.13–15 QA programs of digital x-ray equipment recommend looking for artifacts; it is important to know the full range of artifacts found during QA. The aim of this paper is to show some artifacts observed in QA test images, discuss how they may affect clinical images, and describe the corrective actions taken.
Methods
Over a period of 5 years, QA tests were undertaken on radiographic and mammographic detectors. The following systems were tested, Philips Digital Diagnost (Philips Medical Systems, Hamburg, Germany), Hologic Selenia (Hologic Inc., Bedford, MA, USA), Siemens Axiom Aristos (Siemens, Erlangen, Germany), Kodak DirectView 800 (Eastman Kodak, Rochester, New York) reader with GP image plate, Agfa ADC Compact plus (Agfa, Mortsel, Belgium) with MD40 image plate (Agfa, Mortsel, Belgium), Fuji FCR XG1 (Fuji Medical Systems, Tokyo, Japan) with ST-VI image plate (Fuji Medical Systems, Tokyo, Japan).
Measurements of air kerma on general radiographic systems were made using calibrated MDH 2025 (Radcal, Monrovia, CA, USA) electrometer with a 60-cm3 pancake ionization chamber, traceable to an international standard, and positioned free in air. Detector entrance air kerma (DAK) was calculated by inverse square law correcting these values to the appropriate distance of the detector entrance plane. Mammography DAK measurements were done using a 15 cm3 Keithley ion chamber and electrometer (Keithley Instruments, Cleveland, OH, USA), traceable to an international standard, positioned 4 cm from the chest wall edge of the detector.
Except where otherwise highlighted, all images were acquired using a minimal image processing mode with a fixed relationship between pixel value and DAK and little or no image enhancement (e.g., noise reduction or edge enhancement). Where manufacturers provided a suitable image processing mode, this was used. For some systems, an appropriate processing mode was not provided as part of a standard setup, but was made available in consultation with service engineers or application specialists.
The general radiographic tests performed are described by the Institute of Physics and Engineering in Medicine report 91.1 These images were acquired at focus to detector distance of 1.4 to 2 m and with the anti-scatter grid removed. The ‘detector dose indicator’ of each system was tested at 70 kVp with 1 mm of copper filtration at the tube head and setting a tube current-time product (mAs) to deliver approximately 10 μGy (DAK) uniformly over the detector area. Images were analyzed for uniformity numerically and visually across a wide range of windows and levels. Images of the TO20 (Leeds Test Objects, Leeds, UK) threshold contrast detail detectability phantom were acquired using the 70 kVp with an added 1 mm copper filtration and a DAK of approximately 4 μGy. Areas of localized blurring were searched for using the MS4 test object (Leeds Test Objects), which contains a wire mesh of spatial frequency 6.4 cycles cm−1. Limiting spatial resolution was assessed using the Hüttner type 18 (Hüttner Rontgenteste, Germany) bar phantom with a maximum spatial frequency of 5.0 cycles mm−1. The M1 test object (Leeds Test Objects), which contains a 2 × 2 cm wire grid, was used to search for the presence of any geometrical distortions. Images of the MS4, Hüttner type 18, and M1 were acquired without any additional filtration copper filtration added to the tube and with a relatively large DAK (>20 μGy) to minimize quantum noise. For CR systems, image retention was tested by making an exposure at 20 mAs, 80 kVp, and no added filtration with a 5 × 5 cm lead square of 2 mm thickness in the center of the field. The plate was then read before making a second exposure at 0.5 mAs and with the same spectrum with the lead removed. Remnants of the image of the lead were searched for in the second image by looking at very narrow window and level settings.
Mammography images were acquired in the fixed geometry of the systems tested with the anti-scatter grid in place, largely following the European Reference Organisation for Quality Assured Breast Screening and Diagnostic Services guidelines.16 A series of flat field images was acquired with a 4.5-cm polymethyl methacrylate (PMMA) block at the breast platform, across a range of DAK covering 10% to five times a normal clinical DAK. Uniformity of these images was assessed visually as well as looking at the variation of the noise with dose. A numerical assessment of the uniformity was made with the flat field image acquired at a typical clinical DAK (as determined using the systems automatic exposure control system). Threshold contrast detail detectability was assessed using the contrast detail mammography (CDMAM; University of Nijmegen, Netherlands) sandwiched between two 2-cm blocks of PMMA on the breast platform. Images of the CDMAM were acquired at a DAK determined by the systems automatic exposure control (AEC).
Artifacts observed during the QA tests were collected and investigated to find their causes, and the actions taken were noted. A selection of the artifacts was chosen for this paper either because they have not been seen in the literature or further comment was warranted.
Results and Discussion—Review of Artifacts
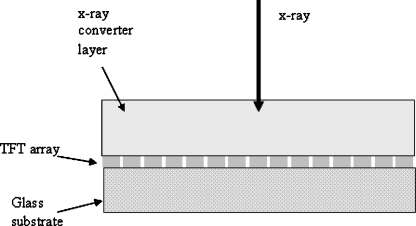
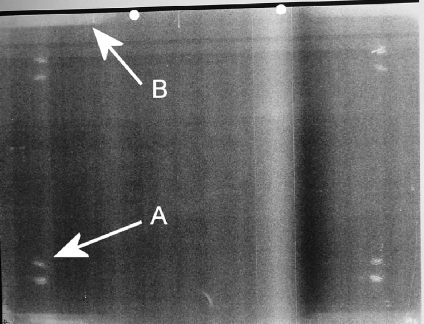
DR detectors are inherently nonuniform because of variation in the electronic gain and offset and variation in conversion layer thickness. The nonuniformity in gain and offset and compensation for defective detector elements (dels) is corrected by software.10,12 Generally, the user does not have access to true raw data images, i.e., images before the application of nonuniformity and defective detector element correction. Figure 1 shows an image acquired from a detector with a cesium iodide (CsI) conversion layer coupled to an amorphous silicon (a-Si)/thin film transistor (TFT; see Fig. 2) with the flat fielding correction misregistered by a 180° rotation, because of software error. This allows the non-uniformity of the detector response to be seen.
Fig 1.
Flat field image acquired at 70 kVp, with a 1 mm Cu filtration and a DAK of 10 μGy, Philips Digital Diagnost detector with flat fielding inadvertently applied misregistered to the image by a 180° rotation. Arrow A indicates the position of a coupling artifact, and B indicates the position of a malfunctioning line. The image processing used was a locally customized setting for the purpose of QA.
Fig 2.
A diagram showing the structure of a flat panel detector.
Figure 1 shows the differences in sensitivity between the quadrants of the four TFT readout arrays and their associated 12 amplifiers. Offset and gain corrections should mask these differing sensitivities in an image exposed to a clinically realistic DAK (e.g., 4 μGy). Even in a correctly set up system, the different amplifier sensitivities can become apparent at high DAK (e.g., 40 μGy) when the sensitivity variations are no longer small compared to the quantum noise. This increasing importance of structural noise with DAK can be evidenced by observing the drop in detective quantum efficiency (DQE) with increasing DAK.17,18 This is because the structural noise is multiplicative, i.e., increases DAK linearly, while the quantum noise increases only with DAK0.5. Figure 1 has a narrow window width set (nominal values, window width = 1,000, window level = 20,000) to maximize the visibility of the variation in the amplifiers. With a very wide window width set (e.g., window width = 10,000, window level = 20,000), the different amplifier regions are still faintly visible. It is not known whether these different regions would be visible in clinical images, as this fault was discovered at commissioning and rectified before clinical images were obtained.
Figure 1 also shows several small approximately circular artifacts caused by poor coupling between the conversion layer and a-Si/TFT array. These artifacts are obvious regardless of the window and level settings chosen. If any clinical images had been obtained with this artifact, it is the opinion of the authors that it would have added confusing false overlying structure with the potential to affect diagnosis. In the diagonally opposite quadrant is an equal and opposite artifact to each of the coupling artifacts caused by the misregistration of the flat field corrections. All the artifacts visible in Figure 1 were removed when the software was corrected by the service engineer, to apply an appropriately registered flat field correction.
Any item inappropriately left in the beam during acquisition of a flat field correction image will appear as its inverse in all subsequent images. In Figure 3, from a mammography detector, the calibration required a PMMA block to be in the beam. When the images were acquired, the block was left inside its protective bag, and the folds of the material and a zipper were visible in clinical images (Fig. 12). However, the cause was not obvious until a flat field image was taken. This problem was easily corrected by running through the systems flat field calibration correctly.
Fig 3.
Flat field image (28 kVp Mo/Mo, DAK of 100 μGy) from a Hologic Selenia mammographic detector, using processing mode ‘flat field’. The irregular artifact is caused by the presence of a protective bag in the field during the calibration of the detector.
Fig 12.
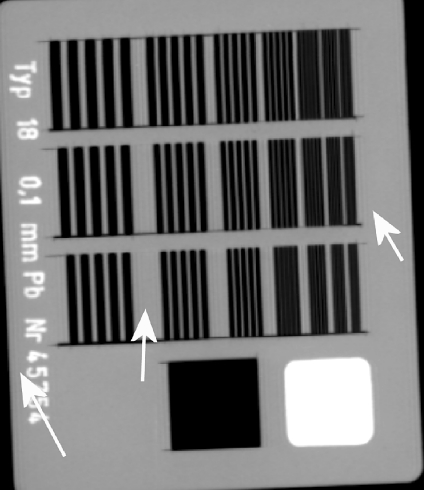
CR image of a Huttner type 18 lead bar pattern test object (Huttner Rontgenteste, Germany) acquired at 50 kVp and DAK of 140 μGy using a Kodak GP CR plate with a Kodak DirectView 800 reader. The image was acquired in ‘pattern’ image processing mode. A ringing artifact is visible at sharp boundaries. Arrows indicate regions where ringing can be seen.
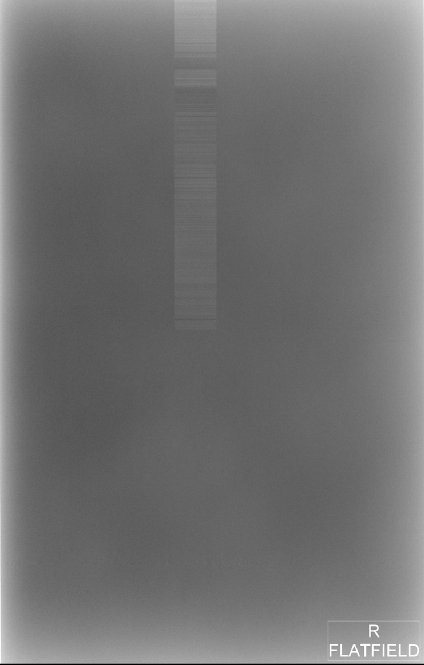
Figure 4 is a flat field image from a mammographic direct x-ray conversion detector comprising and amorphous selenium conversion layer and TFT array (see Fig. 2). The noisy rectangular region is believed to be caused by a malfunctioning amplifier and could not be resolved through flat fielding. This artifact occurred during physics testing of the equipment, and so, no clinical images were obtained containing this artifact. It was however believed that the artifact would have adversely affected clinical images, and consequently, the detector was replaced.
Fig 4.
Flat field image from a mammographic Hologic Selenia detector (28 kVp Mo/Mo, DAK 100 μGy), using processing mode ‘flat field’. Note the rectangular artifact in the upper region of the image.
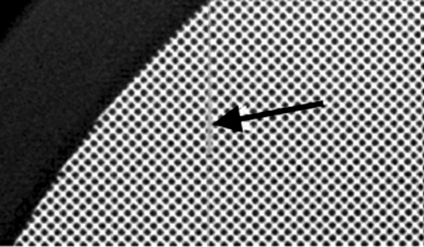
Although malfunctioning pixels and lines do not typically appear in the final image, the loss of information can be apparent in images of test objects with fine repeating patterns such as lead bar phantoms or meshes. Individual dead lines do not generally result in replacement of detectors for practical reasons; indeed, new detectors commonly have defective lines (Fig. 1). Figure 5 shows an image of a mesh test object taken from a detector with several neighboring defective lines. The system attempted to mask the defective lines by using data from neighboring functioning lines; consequently, no defect was apparent on flat field images. However, in the image of the mesh, the system cannot obtain appropriate information from the nearest functional lines, resulting in the blurred band corresponding to the defective pixels. No clinical images were obtained to assess the impact of this blurred region. It was considered that the loss of information from this strip of the detector (~0.6 mm) would significantly affect clinical images. This artifact was observed on several detectors at the same installation; all of which were replaced. The manufacturer explained the fault as being caused by charge bleeding from one malfunctioning line into its neighbors, resulting in several adjacent defective lines.
Fig 5.
Image of a mesh test object, the Leeds MS4 showing a vertical blurred line four pixels in width on a Philips Digital Diagnost detector (marked by the arrow). The image was acquired using 50 kVp and a DAK of 40 μGy. The image processing used was a locally customized setting for the purpose of QA.
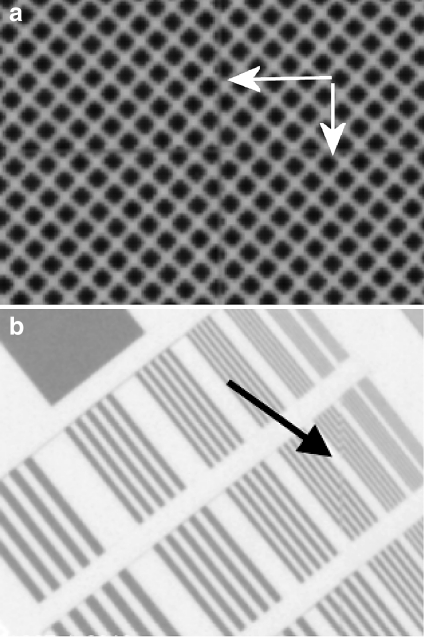
On tiled detectors, it is usually possible to detect stitching lines as discontinuities in images of test objects with fine repeating structures (Fig. 6a). Stitching artifacts will almost always be present on tiled detectors but are typically not greater than one-pixel width. This type of artifact is a characteristic of the detector and is unavoidable. From Figure 6b, it was estimated that the detector concerned was losing data along the stitching line equivalent to approximately one pixel. The stitching lines in Figure 6a and b are only visible because of the fine repeating structures of the test object and were not visible clinically. Clearly, there is some loss of information caused by the unimaged gap; however, if the gap is no more than one pixel, then the clinical effect should be no more than that of an individual dead line in the detector, which is accepted by manufacturers of flat panel systems.
Fig 6.
a Image of a mesh test object, the Leeds MS4 showing horizontal and vertical line discontinuities (marked by arrows) across the center of a Siemens Axiom Aristos detector. The image was processed with the settings harmonization gain = 0.0, spatial filter gain = 0.0, LUT = 1, amplification = 2.0. The discontinuity is indicative of a small unimaged region along the stitching line between tiles of the detector. The image was acquired using 50 kVp and a DAK of 20 μGy. b Image of a Huttner type 18 lead bar pattern test object positioned at the center of a Siemens Axiom Aristos detector composed of four quadrants. The image was processed with the settings harmonization gain = 0.0, spatial filter gain = 0.0, LUT = 1, amplification = 2.0. A discontinuity is visible along the stitching line between quadrants (marked by the arrow).
Ghosting artifacts have previously been reported for CR2,3 and DR.13,14 Figure 7 shows an image of a kVp meter retained by a CsI a-Si/TFT detector observed by the authors. The tube and generator tests delivered a DAK to the detector of the order of 10–100 mGy. This was several orders of magnitude higher than a normal clinical exposure and caused a residual image to remain. While flat fielding removed the residual image temporarily, an inverse image appeared as the affect on the detector faded. Care should be taken to protect detectors from such exposures.
Fig 7.
A section of a flat field image obtained on a Siemens Axiom Aristos detector after tube and generator tests had been performed. A retained image of the kVp divider is clearly visible.
Figure 8 shows an image from an a-Se mammography detector with a region that has become damaged, believed to be a result of the detector being stored at ambient room conditions outside the range specified by the manufacturer. The manufacturer explained that the fault was caused by the ‘delamination’ of the selenium photocondutor layer from the TFT electronics. The fault was picked up from daily QA and was retrospectively found to be visible on clinical images. This effect was not reversible, and so, the detector was replaced.
Fig 8.
Flat field image (28 kVp Mo/Mo, DAK 100 μGy) from a Hologic Selenia mammographic detector, with a ‘delaminated’ region in the lower left. The image was obtained in processing mode, ‘flat field’.
Hardware-Related Artifact CR
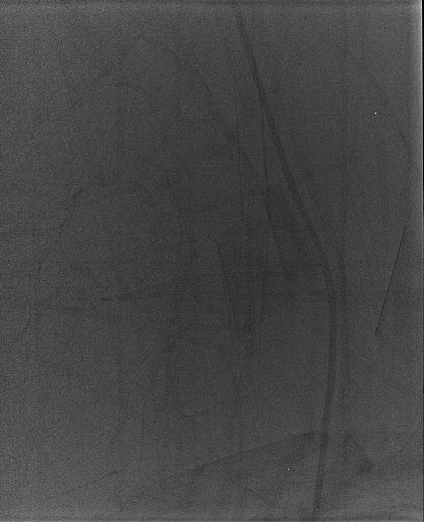
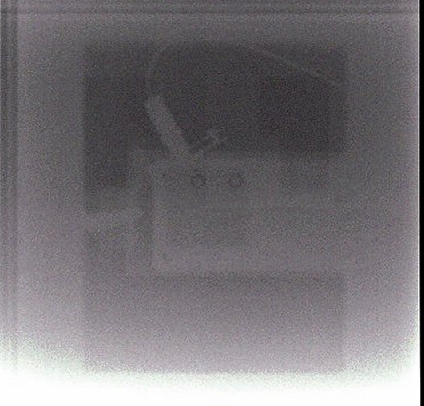
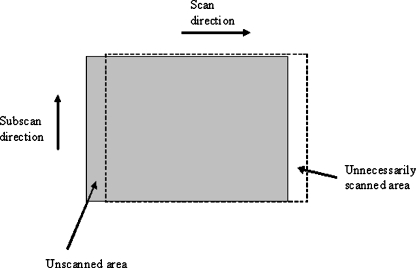
Several of the faults with CR systems were a result of problems with the mechanism that transports the plates through the reader (e.g., cracks or scratches on the image plates).2–7 Another example of failure of the plate transport mechanism is shown in Figure 9, where the system was miscalibrated such that the digitization began 2 cm before the plate had reached the correct point in the cycle and consequently stopped scanning before it had scanned the whole plate (see Fig. 10). The fault was initially hidden by the automatic application of black border to unexposed parts of the image and was mistaken for a fault with the alignment of the light beam diaphragm of the x-ray tube. This fault was found at commissioning and later corrected by a service engineer. If part of a clinical image had been on the lost edge, then the exam may have had been repeated because of missed anatomy, with the probability of the same result. A system can be designed to have an overscan; for example, in mammography, it is essential that the chest wall edge is read; therefore, the scan is extended in that direction.
Fig 9.
Flat field image acquired at 70 kVp, with a 1 mm Cu filtration and a DAK of 10 µGy. The image was acquired using a Kodak DirectView 800 CR reader with an incorrectly set up plate transport mechanism using an 18 × 24-cm Kodak GP image plate. The image was acquired in ‘pattern’ image processing mode.
Fig 10.
Diagram showing how an incorrect setup of the plate transport mechanism can result in an incomplete readout of the image plate.
Figure 11 shows the damage caused by suction cups, removing the plate from the cassette during readout. This image has a narrow window width to accentuate the visibility of the artifact; however, it was still visible on much wider window settings. It is unclear whether the artifact is caused by the suction cups flexing the plate during normal operation or by the suckers directly damaging the front of the plate after it has been inserted the wrong way around. The artifact was visible on clinical images, although it was more difficult to see because of the more complex background. Several plates with this damage had to be removed from use at more than one center.
Fig 11.
A flat field image (70 kVp with 1 mm Cu, DAK of 10 μGy) from an Agfa MD40 CR plate read using an Agfa ADC Compact plus reader. The image was acquired with image processing set as flat field/system diagnosis and 200 speed. Arrow A points to a region with scratches caused by suckers contacting the plate. Arrow B points to an artifact at the edge caused by penetration of moisture into the phosphor.
Figure 11 also shows damage to the edges of a CR plate that resulted in regions of lower sensitivity at the plate edges. A discoloration artifact has previously been reported by Willis et al.7 On inspection of the plates, a yellowing was clearly visible at the edges. This is caused by oxidation of the iodine to iodate, presumably caused by moisture penetrating through the plates’ protective seal. Several plates exhibiting this artifact were removed from clinical use.
Software-Related Artifacts
QC test images of CR and DR detectors are performed with as little image processing as possible. When processing is present in an image, this can lead to artifacts. Figure 12 is an image of a Huttner lead bar test object. The ringing around sharp edges was caused by an inappropriate automatic application of grid suppression software to the image. The software examines the Fourier transform of a selected part of the center of the image; if there is a peak at a particular spatial frequency, then the grid suppression software is applied, which essentially removes this spatial frequency. In this case, the grid suppression mistook the Huttner for a grid. The artifact was removed by deselecting the grid suppression in the software. The authors did not see the grid suppression software inappropriately applied to clinical images. The authors imaged clinical phantoms (chest, hand, and foot) next to a grid; this fooled the system to apply grid suppression to the whole image. The clinical images appeared identical whether the grid suppression had been applied or not. As the artifact was only visible in QA, no action was deemed necessary.
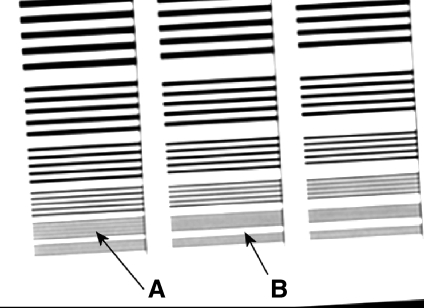
Figure 13 is an image of a Huttner lead bar test object obtained with an inappropriate low pass filter applied. The last visible group of lines is highlighted. The resolution is significantly lower than the Nyquist frequency because of the low pass filter. This is evidenced by the fact that the details beyond the last visible detail are entirely blurred out, whereas in an unprocessed image, some aliased structure would remain.19 Anti-aliasing filters are common on CR systems and reduce aliased noise in the image in the scan direction; Fuji commonly have the cut-off frequency below the Nyquist frequency20 applied to the analogue signal from the photomultiplier tube. In this case, when the image was sent from the reader to the picture archiving and communication systems, a further filter low pass filter was applied in the scan and sub-scan direction with a cutoff frequency of 2.2 cycles mm−1, compared to a Nyquist frequency of 5.0 cycles mm−1. Retrospectively, the poor resolution properties of the reader were visible on clinical images and were resolved when the low pass filter was removed.
Fig 13.
Image of a Huttner type 18 lead bar pattern test object from an 18 × 24-cm Fuji ST-VI CR plate read with a Fuji FCR XG1 reader, applying an inappropriate low pass filter. The image was acquired in ‘linearity’ image processing mode with a sensitivity number of 200. Arrow A points to the last resolved set of bars, and Arrow B points to the subsequent set of bars that is completely blurred out. The last and finest group of details corresponds to the Nyquist frequency of this system.
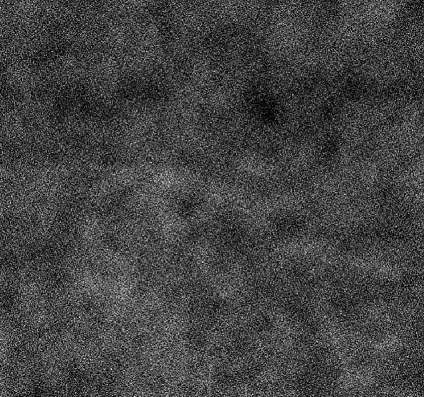
Figure 14 shows a flat field image from a CsI a-Si/TFT DR detector. The image has a blotchy effect because of the presence of unsharp masking filters. Figure 14 has a narrow window width set (nominal values, window width = 700, window level = 20,000) to maximize the visibility of the artifact. The effect of these filters on DQE measurements has previously been described by Samei and Flynn.18 Unsharp masking filters enhance edges, and in Figure 14, they have enhanced the quantum mottle. This processing was designed to improve the image quality of clinical images, and so, it is not surprising that this artifact was not evident in clinical images (where mottle tends to be less noticeable in the presence of anatomical noise) and, therefore, is not of concern.
Fig 14.
Flat field image (70 kVp with 1 mm Cu, DAK of 10 μGy) from a Philips Digital Diagnost flat panel detector. The image appears blotchy because of the presence of image processing. The image processing used was a locally customized setting for the purpose of QA.
Conclusions
The most useful tests for identifying artifacts proved to be the visual inspection of flat field images and inspecting images of both the lead bar phantom and MS4 test object. Images of the threshold contrast detail detectability phantoms, the M1 test object, and the test of image retention for CR did not identify any artifacts not already seen on the other images.
When an artifact is discovered, it is important to understand whether it is a detector fault, normal operation of the system, or even caused by the testing process itself. Before deciding on a course of action, which may be repair, replacement, or accepting the artifact, it is important to consider the degree to which it will impact on clinical images. This decision criteria may depend on the examinations undertaken and the patient demographics.
This paper has demonstrated some artifacts not previously described in peer reviewed literature and demonstrated that QA is practical for identifying artifacts that are clinically relevant.
Acknowledgments
The authors would like to acknowledge Dr. Nick Marshall of St. Bartholomew’s Hospital and Susan Doshi of Bristol Royal Infirmary for their assistance in providing images and explaining the sources of some of the artifacts shown in this paper. We would like to acknowledge the assistance of Donald Emerton, Hannah Urbancyzk, and all the staff of the King’s Centre for the Assessment of Radiological Equipment (KCARE) and King’s Radiation Protection service for their assistance with this work.
Contributor Information
Ian D. Honey, Phone: +64-3-3640024, FAX: +64-3-3640851, Email: ianhoney@hotmail.com
Alistair Mackenzie, Phone: +64-3-3640024, FAX: +64-3-3640851.
References
- 1.Hiles P, Mackenzie A, Scally A, Wall B: IPEM report 91: Recommended standards for the routine performance testing of diagnostic x-ray imaging systems, 2005
- 2.Cesar LJ, Schueler BA, Zink FE, Daly TR, Taubel JP, Jorgenson LL. Artifacts found in computed radiography. Br J Radiol. 2001;74:195–202. doi: 10.1259/bjr.74.878.740195. [DOI] [PubMed] [Google Scholar]
- 3.Oestmann JW, Prokop M, Schaefer CM, Galanski M. Hardware and software artifacts in storage phosphor radiography. Radiographics. 1991;11:795–805. doi: 10.1148/radiographics.11.5.1947316. [DOI] [PubMed] [Google Scholar]
- 4.Solomon SL, Jost RG, Glazer HS, Sagel SS, Anderson DJ, Molina PL. Artifacts in computed radiography. Am J Roentgenol. 1991;157:181–185. doi: 10.2214/ajr.157.1.2048517. [DOI] [PubMed] [Google Scholar]
- 5.Volpe JP, Storto ML, Andriole KP, Gamsu G. Artifacts in chest radiographs with a third generation computed radiography system. Am J Roentgenol. 1996;166:653–657. doi: 10.2214/ajr.166.3.8623644. [DOI] [PubMed] [Google Scholar]
- 6.Hammerstrom K, Aldrich J, Alves L, Ho A. Recognition and prevention of computed radiography image artifacts. J Digit Imaging. 2006;19:226–239. doi: 10.1007/s10278-006-0590-z. [DOI] [PMC free article] [PubMed] [Google Scholar]
- 7.Willis CE, Thompson SK, Shepard SJ. Artifacts and misadventures in digital radiography. Appl Radiol. 2004;33(1):11–20. [Google Scholar]
- 8.Yorkston J. Flat-panel DR detectors for radiography and fluoroscopy. In: Goldman LW, Yester MV, editors. Specifications, Performance Evaluations, and Quality Assurance of Radiographic and Fluoroscopic Systems in the Digital Era. Madison, WI: Medical Physics Publishing; 2004. pp. 177–228. [Google Scholar]
- 9.Goldman LW. Inspecting radiographic and fluoroscopic equipment: providing value. In: Goldman LW, Yester MV, editors. Specifications, Performance Evaluations, and Quality Assurance of Radiographic and Fluoroscopic Systems in the Digital Era. American Association of Physicists in Medicine. Medical Physics Monograph No. 30. Madison, Wisconsin: Medical Physics Publishing; 2004. pp. 299–333. [Google Scholar]
- 10.Seibert JA, Boone JM, Lindfors KK. Flat-field correction technique for digital detectors. Proc SPIE. 1998;3336:348–354. doi: 10.1117/12.317034. [DOI] [Google Scholar]
- 11.In: Samei E, Flynn MJ Eds. Advances in Digital Radiography: Categorical Course in Diagnostic Radiology Physics. Oak Brook: RSNA 2003
- 12.Padgett R, Kotre CJ. Assessment of the effects of pixel loss on image quality in direct digital radiography. Phys Med Biol. 2004;49:977–986. doi: 10.1088/0031-9155/49/6/008. [DOI] [PubMed] [Google Scholar]
- 13.Siewerdsen JH, Jaffray DA. A ghost story: Spatio-temporal response characteristics of an indirect-detection flat-panel imager. Med Phys. 1999;26:1624–1641. doi: 10.1118/1.598657. [DOI] [PubMed] [Google Scholar]
- 14.Kabir MZ, Yunus M, Kasap SO. Dependence of x-ray sensitivity of direct conversion x-ray detectors on x-ray exposure and exposure history. Proc SPIE. 2004;5368:170–176. doi: 10.1117/12.535546. [DOI] [Google Scholar]
- 15.Zhao W, DeCrescenzo G, Rowlands JA. Investigation of lag and ghosting in amorphous selenium flat-panel x-ray detectors. Proc SPIE. 2002;4682:9–20. doi: 10.1117/12.465557. [DOI] [Google Scholar]
- 16.EUREF: European Guidelines for Quality Assurance in Breast Cancer Screening and Diagnosis, 4th edition, European Commission, 2006, ISBN: 92-79-01258-4
- 17.Mackenzie A, Honey ID. Characterization of noise sources for two generations of computed radiography systems using powder and crystalline photostimulable phosphors. Med Phys. 2007;34(8):3345–3357. doi: 10.1118/1.2750973. [DOI] [PubMed] [Google Scholar]
- 18.Samei E, Flynn MJ. An experimental comparison of detector performance for direct and indirect digital radiography systems. Med Phys. 2003;30(4):608–622. doi: 10.1118/1.1561285. [DOI] [PubMed] [Google Scholar]
- 19.Albert M, Beideck DJ, Bakic PR, Maidment ADA. Aliasing effects in digital images of line pair phantoms. Med Phys. 2002;29(8):1716–1718. doi: 10.1118/1.1493212. [DOI] [PubMed] [Google Scholar]
- 20.Kengyelics SM, Launders JH, Cowen AR. Physical imaging performance of a compact computed radiography acquisition device. Med Phys. 1998;25:354–360. doi: 10.1118/1.598212. [DOI] [PubMed] [Google Scholar]


