Abstract
A method is proposed for 3D segmentation and quantification of the masseter muscle from magnetic resonance (MR) images, which is often performed in pre-surgical planning and diagnosis. Because of a lack of suitable automatic techniques, a common practice is for clinicians to manually trace out all relevant regions from the image slices which is extremely time-consuming. The proposed method allows significant time savings. In the proposed method, a patient-specific masseter model is built from a test dataset after determining the dominant slices that represent the salient features of the 3D muscle shape from training datasets. Segmentation is carried out only on these slices in the test dataset, with shape-based interpolation then applied to build the patient-specific model, which serves as a coarse segmentation of the masseter. This is first refined by matching the intensity distribution within the masseter volume against the distribution estimated from the segmentations in the dominant slices, and further refined through boundary analysis where the homogeneity of the intensities of the boundary pixels is analyzed and outliers removed. It was observed that the left and right masseter muscles’ volumes in young adults (28.54 and 27.72cm3) are higher than those of older (ethnic group removed) adults (23.16 and 22.13cm3). Evaluation indicates good agreement between the segmentations and manual tracings, with average overlap indexes for the left and right masseters at 86.6% and 87.5% respectively.
Key words: Segmentation, masseter, masticatory muscle, patient-specific, matching distribution
Introduction
The large masseter muscle is one of the muscles of mastication which plays a major role in mastication. It is the strongest jaw muscle and acts to raise the jaw and clench the teeth. The masseter’s broad origin and insertion allow it to apply chewing force over a broad area. When the masseter muscle is functioning, its fibers shorten and help to shift the mandible laterally to chew. When the masseter muscle contracts, it elevates the mandible, closing the mouth. Due to its importance in the human masticatory system, the masseter muscle is of interest to maxillofacial surgeons. Clinicians will like to visualize the muscle in 3D and carry out important quantification such as volume. Before these can be carried out, the muscle has to be segmented first.
Another motivation for segmentation of the muscle is that it can be used to build a statistical muscle model when many datasets are available. It has been observed that a variety of facial models have been developed to aid surgeons in surgery planning1,2. Examples include a physics-based model for static soft tissue prediction and muscle simulation described in3. Different tissue groups are assumed to possess similar properties, and linear elastic modeling is used to simplify their highly complicated biomechanical behavior. The primary inadequacy of existing pre-surgery facial models is that they do not take into account the actual location, shape, and size of the muscles. The availability of a muscle model which provides the above information and which can be integrated with current available facial models would be extremely useful for the planning of maxillofacial surgery.
Image segmentation is a key component of medical image analysis and statistical model building. A variety of image processing techniques have been developed for medical image segmentation. A simple yet often effective means for obtaining segmentation of images in which different structures have contrasting intensities is thresholding. Examples of connectivity-based thresholding, which finds a boundary between two regions using the path connection algorithm and changing the threshold adaptively, can be found in4,5. A major limitation of thresholding is that it does not take into account the spatial characteristics of an image and thus is sensitive to the noise, artifacts, and intensity inhomogeneities that can occur in magnetic resonance (MR) images. In another recent approach, supervised range-constrained thresholding, it was found that by confining the analysis to the histogram of a region of interest (ROI), a good threshold can be found even when the image quality is poor6. Besides thresholding, the traditional active contour model, which matches a deformable model to an image, has been constantly improved and used extensively in MR image segmentation7,8. It is an energy minimizing spline whose energy depends on its shape and location within the image.
Despite the numerous image processing techniques which have been developed for the segmentation of various anatomic structures, none has been proposed for the 3D segmentation of the masseter, to our best knowledge. Previously, we did propose methods for segmenting the human masticatory muscles from 2D MR slices9,10. However, these methods are 2D in nature, and repeatedly applying the 2D method to all the slices in the dataset may not achieve good segmentation results because, in a 3D MR dataset, there are slices where no clear boundary exists between the muscles and the surrounding tissue.
Because of the lack of a computerized technique, it is a common practice for the masseter to be manually segmented from all the MR slices before analyzing them in 3D11,12. This is a highly time-consuming process given that the image set of the head typically contains more than 150 axial slices with 1mm thickness, and the masseter muscle usually occupies about 80 slices. The lack of a computerized method for the segmentation of the masseter is most probably due to the fact that it lacks strong edges in MR images and that it has fairly similar intensity values with its surrounding soft tissue. This situation is more severe in some MR slices, especially in the regions where the masseter first and last appears in a MR dataset comprising of axial slices. In such slices, the use of thresholding or active contour techniques will not provide good solutions.
There is an increasing use of model-based techniques for segmentation in MR images, such as the work described in13, which incorporates prior knowledge for segmenting the corpus callosum from MR images with little human intervention. Another example is found in14, where segmentation is carried out via matching of distributions belonging to photometric variables that incorporate learned shape and appearance models for the objects of interest. We seek some motivation from these model-based techniques to segment the masseters from MR datasets.
The proposed method is a two-stage process. In the first stage, we build a patient-specific model by first determining the locations of the dominant slices, which capture the salient features of the 3D masseter shape, from training sets where the relevant masseter regions have been segmented by an expert radiologist. The dominant slices are determined using a set of shape- and area-based criteria15. The MR slices where the masseter first and last appears in the MR dataset are included under this criteria. Given a test dataset, the masseter regions in these dominant slices are manually segmented. Alternatively, our earlier proposed segmentation methods9,10 can be made use of. Having manually segmented the masseter regions from the dominant slices, shape-based interpolation16 is used to create the patient-specific masseter muscle model. This serves as an initial coarse segmentation which we further refine in the second stage by first matching the distributions of the intensity values belonging to the pixels within the masseter model to their expected distributions which we estimate from the distributions of the pixels within the manually segmented masseter regions in the dominant slices. The boundary of the resulting structure is then expanded and boundary analysis performed on it. In this process, we remove boundary pixels whose intensity values fall outside the SD range which we obtained from the boundaries of the manually segmented masseter regions in the dominant slices.
For the quantitative analysis, our hypothesis was that the left and right masseter muscle volume of (ethnic group removed) adults without any known facial abnormalities would be balanced and that the older adults would have smaller masseter muscle volume compared to young adults. The “Materials and Methods” section describes the data used and the proposed method. The “Results and Discussion” section presents the results and discussion, while the “Conclusions” section concludes the paper.
Materials and Methods
Data Acquisition
Fifteen datasets were acquired using a 1.5-T Siemens MR scanner (Symphony maestro class with quantum gradients) and a T1 FLASH imaging sequence (1mm thickness, 512 × 512 matrix, 240mm FOV, TR = 9.93, TE = 4.86). This imaging protocol was approved by an institutional review board. The subjects are male adult volunteers whose informed consent was obtained and whose identities are anonymized.
Overview of Proposed Method
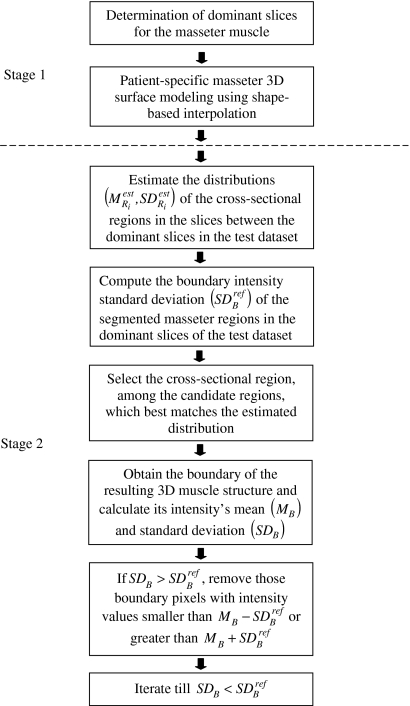
The proposed method (Fig. 1) is a two-stage process designed to provide accurate segmentations of the masseters in a MR test dataset. In stage 1, the left and right masseters in the training sets were first manually segmented by an expert radiologist and the locations of the dominant slices determined from them. Given a test dataset, manual segmentation of the muscle on the dominant slices is carried out, followed by shape-based interpolation to construct the 3D muscle model which serves as a coarse segmentation. In stage 2, two refinements are performed on the coarse segmentation to arrive at the final segmentation. We first match the distributions of the pixels’ intensity values in the masseter regions of the MR slices in the masseter model to their expected distributions. The boundary of the output result is then expanded, and we perform boundary analysis on it. In this iterative process, we remove boundary pixels whose intensity values fall outside the threshold.
Fig 1.
Overview of proposed method.
Determination of Dominant Slices for the Masseter Muscle
A method for determining the dominant slices, which together best captures the shape and size of the masseter muscle, from training datasets was proposed in our earlier work15. In the training sets, the left and right masseters were first manually segmented by an expert radiologist, and we identify the candidates for dominant slice from these training datasets using a set of criteria which we briefly highlight here:
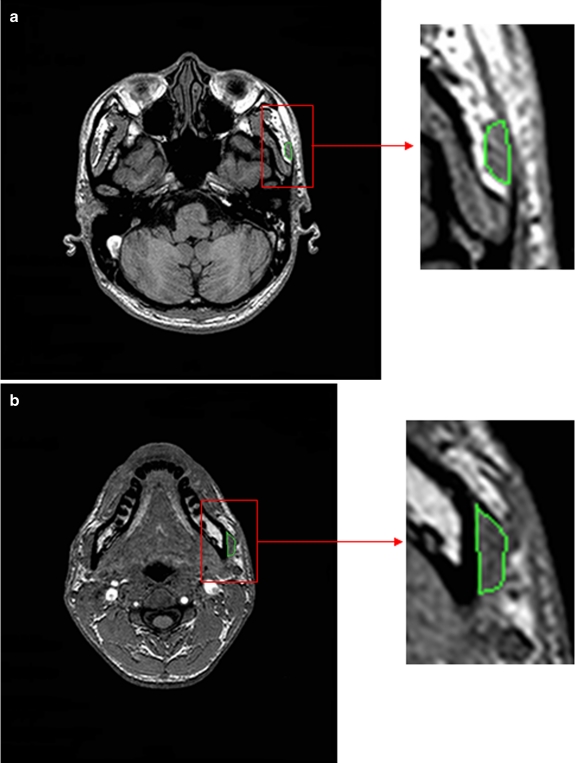
Slices where the muscle first and last appears (Fig. 2). We define these two slices to be Ii and If respectively. At these two slices, automatic computerized techniques may not be suitable, as even expert radiologists would have to depend on their vast experience to differentiate between muscle and its surrounding soft tissue. As such, the selection of Ii and If is currently being performed manually.
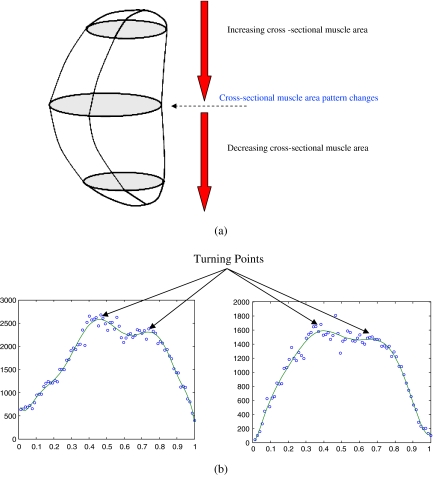
Slices where the muscle area pattern undergoes a change, i.e., the turning points in the plot of cross-sectional muscle area vs In where Ii < In < If (Fig. 3). This allows us to capture the main features of the cross-sectional area belonging to the masseter.
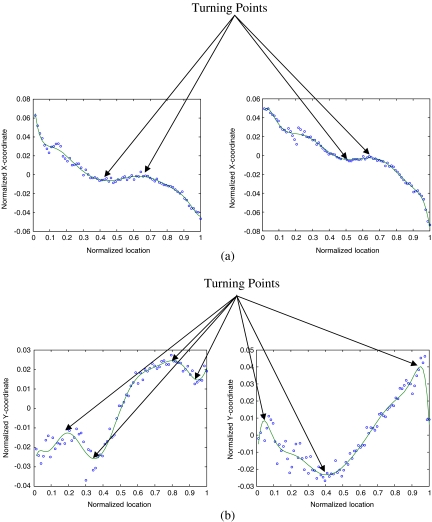
Slices in which the structure of the muscle undergoes a significant change in orientation, i.e., the turning points in the plot of the muscle centroid
 on each slice vs In (Fig. 4). This allows us to detect the locations where the structure of the masseter undergoes an abrupt change in orientation.
Fig 2.
MR slices where masseter a first and b last appears.
Fig 3.
a Change in cross-sectional muscle area pattern. b Turning points in the plot of cross-sectional muscle area vs In.
Fig 4.
aX-coordinate of muscle region centroid vs In. bY-coordinate of muscle region centroid vs In.
Fuzzy-c-means (FCM) clustering17 is carried out on all the locations of the candidate slices, with the clusters’ centroids selected as the dominant slices. There is a trade-off between the number of dominant slices used and the accuracy obtained. Using more dominant slices also meant an increase in time taken. In the identification of the dominant slices which was carried out in our earlier work15, we did vary the number of dominant slices from four to seven slices. We decided on the use of six dominant slices, as a decreasing increment in accuracy was observed when the number of dominant slices was increased from six to seven. In our work here, we use the six normalized locations of the dominant slices identified earlier.
Patient-Specific Masseter Modelling Using Shape-Based Interpolation
Having determined the dominant slices through the training data, 2D segmentation of the masseter is carried out on the dominant slices in the given test dataset. A hybrid approach to shape-based interpolation16, which has been validated quantitatively and effectively used for 3D modeling of the Schaltenbrand-Wahren atlas18, is then used to create patient-specific masseter model from the segmented regions.
Matching Distributions in MR Slices
The patient-specific masseter model serves as a coarse segmentation of the masseter. We perform an initial refinement by matching the distributions of the intensity values belonging to the pixels in the masseter regions belonging to the slices within the masseter model to their expected distributions which we estimated from the distributions of the pixels within the manually segmented masseter regions in the dominant slices. The rationale behind this is that there is relatively uniform distribution of the intensity values within the muscle structure.
In implementation, we first compute the mean  and standard deviation
  intensity of the region bounded by the masseter model in slice Si. Through the distributions of the pixels’ intensity values lying within the manually segmented masseter regions in the dominant slices, we estimate the intensity distributions
  for the masseter regions in the slices Si lying between the dominant slices, Sj with intensity distribution
  and Sk with intensity distribution
  using linear interpolation.
The masseter regions in the dominant slices of the coarse segmentation built from a test dataset have been manually segmented; hence, we assume that they are reasonably accurate and do not perform any refinement on them. As for the slices lying in between the dominant slices, there might be some inaccuracies with the masseter regions, and this can be improved. An initial refinement process is carried out for the masseter region in each slice:
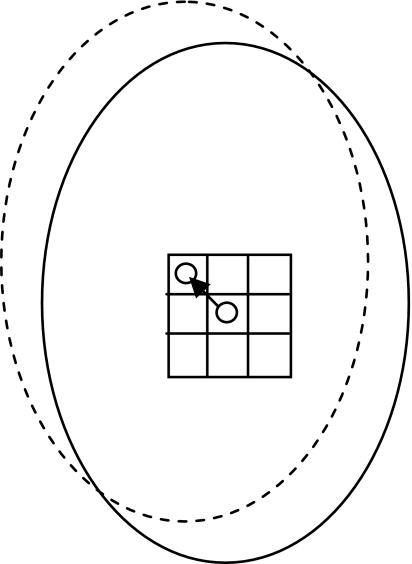
Generate eight new cross-sectional regions by shifting the centroid of the original cross-sectional region to its eight-connected neighbors (Fig. 5).
Calculate the intensity mean
 and SD
  of the nine cross-sectional masseter regions (inclusive of the original region).
Compute the absolute difference between each region mean and estimated mean
 , and between each region SD and estimated SD
  .
.Normalize each of the values computed for
 by dividing them with the maximum value of
  .
.Normalize each of the values computed for
 by dividing them with the maximum value of
  .
.- Out of the nine possible regions, select the masseter region which has the minimum combined difference between its distribution and the estimated distribution, i.e., minimize the following criterion:

1
Fig 5.
Shifting of the centroid and its corresponding masseter region.
Boundary Analysis
Having selected the masseter regions whose distributions best matches the estimated distributions, 3D boundary analysis is carried out on the resulting masseter structure. Before this analysis is carried out, we first expand the boundary by 2 pixels. The rationale behind this is that the model might have omitted some of the pixels which should be included. Expanding the boundary will include some of the pixels which were previously left out. However, expanding the boundary also meant the inclusion of some pixels which should not be included. We attempt to solve this problem by removing boundary pixels whose intensity values fall outside the SD range of the masseter boundaries in the dominant slices and are classified as outliers. The rationale behind this is that the boundary pixels belonging to a single anatomy should have intensity values that do not have a wide SD. In our work here, the pixels with relatively higher intensity values and relatively lower intensity values probably belong to surrounding bright tissue and bone tissue respectively.
We calculate the intensity SD  of the boundaries belonging to the manually segmented masseter regions in the dominant slices of the test dataset. This is set as a threshold, and the refinement process is carried out as follows:
Obtain the boundary of the 3D muscle.
Calculate the mean (MB) and SD (SDB) of the boundary’s intensity.
If
 , remove those boundary pixels with intensity values smaller than
  or greater than
  .
.Obtain the resulting muscle and repeat the above three steps.
Stop iterations when
 .
.
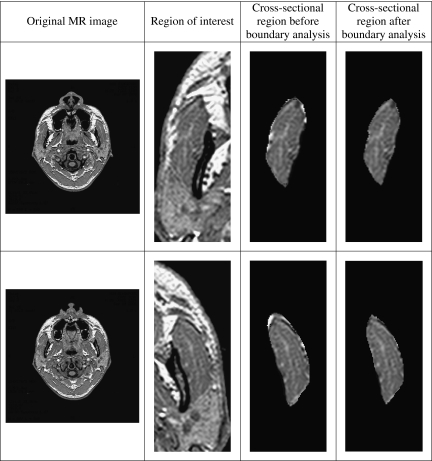
We provide examples of the cross-sectional regions before and after applying our proposed boundary analysis in Figure 6 to illustrate the effectiveness of the method. It can be observed that the brighter boundary pixels were removed in the process of the proposed boundary analysis.
Fig 6.
Samples of cross-sectional regions before and after boundary analysis.
Evaluation
The manual contour tracings for the masseters are provided by an expert radiologist (PSG) who has more than 15years of clinical experience and has been actively involved in research on image segmentation. These manual contour tracings serve as ground truth in the evaluation of the computerized segmentations obtained using our proposed method. To evaluate the consistency between the computerized segmentations and the ground truth, we use the overlap index κ19,
 |
2 |
where M and C denote the regions obtained by manual and computerized segmentation techniques, respectively, M ∩ C the intersection between M and C, and P(·) the number of pixels in a region. The smallest value of κ is 0% (no overlap), and the largest value is 100% (exact overlap).
Results and Discussion
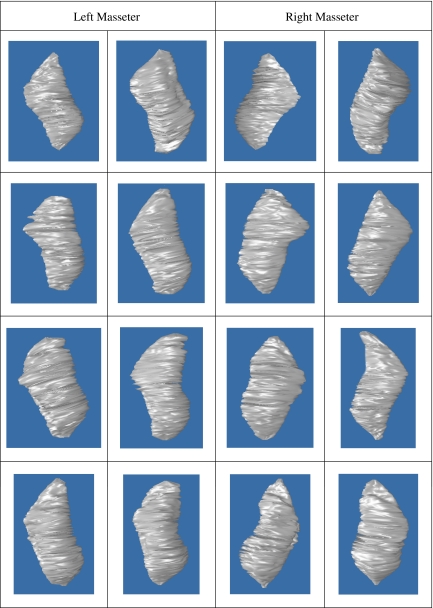
We make use of the leave-one-out method20 to evaluate our proposed method, and we have a total of 15 MR datasets from male adult volunteers. Using such evaluation strategy, all the datasets were involved in training and testing. A total of 30 masseter muscles (left and right) were segmented, and examples are provided in Figure 7. The average κ index achieved for the left and right masseters are 86.6% and 87.5%, respectively. The numerical validation and quantification results for the left and right masseters segmentations are summarized in Table 1.
Fig 7.
3D segmentations of left and right masseters.
Table 1.
Summarized Results for Left and Right Masseters
| Parameter | Left Masseter | Right Masseter | ||
|---|---|---|---|---|
| Mean | SD | Mean | SD | |
| Overlap index obtained using patient-specific models and matching distributions (%) | 86.6 | 1.18 | 87.5 | 1.42 |
| Overlap index obtained using patient-specific models (%) | 83.5 | 1.07 | 84.2 | 1.26 |
| Volume measurements (cm3) | 26.23 | 3.95 | 25.53 | 4.26 |
Accuracy of Patient-Specific Model and Number of Dominant Slices Used
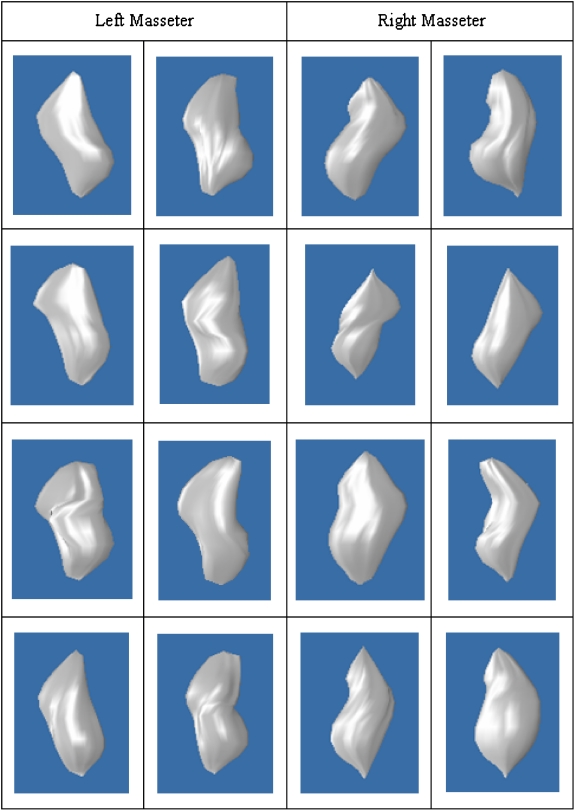
The patient-specific model plays an important role in our proposed method, as it serves as an initial coarse segmentation. In addition to computing the accuracies of the segmentation results obtained using our proposed method, we also computed the accuracies of the patient-specific models. The average κ index achieved for the left and right patient-specific masseters models are 83.5% and 84.2%, respectively. The validation results are tabulated in Table 1, and examples of the patient-specific models are provided in Figure 8.
Fig 8.
3D patient-specific models of left and right masseters.
From our experiments, it was observed that on average, our segmentations have improvements in accuracies of 3.1% and 3.3% over that of the patient-specific models (Table 1). The biggest and smallest improvements for the left masseter, which we observed from our experiments, are 4.0% and 1.7%, respectively, while for the right masseter, they are 4.7% and 2.1%, respectively. It should be emphasized here that though we cannot always assure of a significant improvement, there is always positive improvement in the accuracy over that of the patient-specific models. Comparing the results in Figures 7 and 8, it can however be observed that the segmentation results (Fig. 7) have coarser surfaces compared to the patient-specific models (Fig. 8). This is due to the removal of outlier pixels on the boundary in the boundary refinement step. In addition, as the final output was built from the cross-sectional contours on the axial planes (with small thickness of 1 mm), the surface strictly passes through these contours; thus, it seems that the output originated from a sequence of 2D operations when in actual fact, we carried out 3D analysis.
The number of dominant slices used in our work here is six, and manual segmentations are carried out on only these six slices, which is only a small fraction of the 80 MR slices which the masseter typically occupies, and hence, the amount of work clinicians need to do is minimized. To further illustrate the efficiency of our proposed method, we measured the amount of time taken for an expert to segment a masseter using our proposed method and using manual contour tracing on all image slices. Using the former, it took about 3 min including the time taken to identify Ii and If, while using the latter, the time taken was about 20 min. It should be highlighted that time required to identify Ii and If is dependent on the quality of the images. Poor image quality may result in more time needed to correctly identify Ii and If.
Sensitivity to Selection of Starting Slice Ii and Ending Slice If
When building the patient-specific model, the selection of MR slices Ii and If, where the masseter first and last appears, respectively, is performed manually, and hence, there will be inter- and intra-observers errors. An accurate selection of these two slices is challenging, as the masseter in the MR images at these regions lack strong edges and has similar intensity values with surrounding soft tissue.
A sensitivity test was carried out to study the effects that the selection of Ii and If has on the accuracies of our patient-specific models. In this test, we varied the original selection of Ii and If by ±2 slices. It was observed through this test that such selection variation resulted in accuracy variation of less than 2%. The main reason behind this is that in our work here, the MR datasets used consist of 1 mm slices, and the masseter muscle typically occupies about 80 slices, and hence, a variation of two slices will only cause a deviation of only 2.5%.
On Selection of Centroid Candidates
It was mentioned in the “Matching Distributions in MR Slices” section that we shift the centroid of the masseter region in each MR slice from its original position to its eight-connected neighbors and check for the agreement between the distributions of the corresponding regions and the estimated distribution which was derived from the masseter regions in the dominant slices. The region which has the best matched distribution is selected.
We restrict the candidates for the centroid to the eight-connected neighbors to preserve the shape of the patient-specific masseter model. In addition, we performed some experiments where the list of candidates for centroid was expanded to include the 16 pixels surrounding the eight-connected neighbors. It was observed that the final selected position of the centroid is usually among the original centroid and its eight-connected neighbors.
On Expanding the Boundary of the Model After Initial Refinement
It was mentioned in the “Boundary Analysis” section that we expanded the boundary of the coarse segmentation by 2 pixels before carrying out boundary analysis on it. By doing so, we hope to include those masseter pixels which have been omitted by the coarse segmentation. The main reason why we are restricting the expansion to 2 pixels is that, in a number of the MR slices, especially those in the region where the masseter first and last appears, the muscle and tissue have very similar intensity values, and we hope to minimize the inclusion of such pixels.
It should also be noted that in the boundary analysis under our proposed method, not only the pixels in the expanded boundary are being considered. At every iteration, the intensity SD of the boundary is being calculated, and pixels classified as outliers are removed. The iterations stop only when the intensity SD is smaller than the threshold which was derived from the boundaries of the manually segmented masseter regions in the dominant slices.
Quantification of Segmentation Results and Clinical Findings
The volumes of each of the 3D masseter segmentations were computed from a series of 2D MR images by summing up the number of voxels enclosed within the boundary of the segmentation on the 2D image slices and multiplying it with the voxel size. The mean volumes of the left and right masseters are 26.23 and 25.53 cm3, respectively (Table 1). As the MR datasets were acquired from male adult subjects who have no reported facial problems, the left and right masseters’ volumes of each subject are relatively similar. This is in line with the hypothesis of our quantitative study. However, as the subjects have a wide age range, we find that the SDs are relatively large at 3.95 and 4.26 cm3 for the left and right masseters, respectively.
We further classify our results according to the age group of our subjects. For those who are less than 30 years old, the mean left and right masseter volumes are 28.54 cm3 and 27.72 cm3, respectively, while for those more than 40 years old, the mean left and right masseter volumes are 23.16 cm3 (shrinkage of 18.85%) and 22.13 cm3 (shrinkage of 20.17%), respectively. This is in line with the hypothesis of our quantitative study that older adults would have lower masseter muscle volume. In addition, these findings are in line with what was previously reported in a study11 which mentioned that the masseter muscle volume in young adults (31.77 ± 8.99 cm3) is higher than that of older adults (21.22 ± 6.16 cm3). Despite this, it should be emphasized here that our studies are not conclusive as we only make use of 15 datasets.
Future Work
The segmentation work presented here is an extension from our earlier proposed work15 on the building of patient-specific masseter models via the determination of dominant slices. Though human interaction is required in the building of the patient-specific models which serve as coarse segmentations, it is being kept to a minimal, and manual contour tracings is limited to only 6 out of 80 MR slices which the masseter muscle occupies. The two processes, matching distributions in MR slices and boundary analysis, which are performed on the coarse segmentations to arrive at the final segmentations, are automatic. The segmentation results obtained are encouraging. In the future, we plan to apply our proposed method for segmentation of other masticatory muscles such as the lateral and medial pterygoids, as well as the segmentation of other anatomies.
Conclusions
We have proposed a method to perform 3D segmentation of the masseter, which is the strongest jaw muscle, from MR images. This, to our best knowledge, is currently unavailable. The task is a challenging one because of the fact that the muscle lacks strong edges in MR images and that it has fairly similar intensity values with its surrounding soft tissue. This situation is more severe in some MR slices than others. Our method, which makes use of patient-specific masseter models and matching of distributions of pixels’ intensity values, both within the masseter volume and on its boundaries, produces segmentation results with average κ index for the left and right masseters at 86.6% and 87.5%, respectively.
Human intervention is being minimized in our work here. Unlike conventional practices where clinicians segment the muscle from every MR slice which it occupies, our proposed method requires that the clinician only performs manual contour tracing only on six dominant slices, which we determined using shape- and area-based criteria, out of 80 MR slices which the masseter typically occupies. Through the manually segmented muscle regions in the dominant slices, we estimate the distribution of the pixels’ intensity values belonging to the masseter regions in the MR slices lying between the dominant slices. The distribution of the boundary pixels’ intensity values of the masseter regions in the dominant slices is also computed, and this serves as a threshold when boundary analysis is carried out and boundary pixels with relatively higher or lower intensity values are classified as outliers and removed.
Quantification was performed after segmenting the masseters using our proposed method, and the masseter muscles’ volumes were computed. It can be observed that the left and right masseter muscles’ volumes in young adults (28.54 and 27.72 cm3) are higher than those of older adults (23.16 and 22.13 cm3).
Acknowledgements
The first author will like to thank Agency for Science, Technology and Research (A*STAR), Singapore for funding his PhD studies. The authors thank Mr Christopher Au, Principal Radiographer at National University Hospital, Singapore for his assistance in data acquisition which is funded by NUS R-222-000-023-112 from the Faculty of Dentistry, National University of Singapore.
References
- 1.Noguchi N, Goto M. Computer simulation system for orthognathic surgery. J Orthod Craniofacial Res. 2003;6(1):176–178. doi: 10.1034/j.1600-0544.2003.254.x. [DOI] [PubMed] [Google Scholar]
- 2.Wong TY, Fang JJ, Chung CH, Huang JS, Lee JW. Comparison of 2 methods of making surgical models for correction of facial asymmetry. Int J Oral Maxillofac Surg. 2005;63(2):200–208. doi: 10.1016/j.joms.2003.12.046. [DOI] [PubMed] [Google Scholar]
- 3.Gladilin E, Zachow S, Deuflhard P, Hege HC. Anatomy and physics-based facial animation for craniofacial surgery simulations. Med Biol Eng Comput. 2004;42(2):167–170. doi: 10.1007/BF02344627. [DOI] [PubMed] [Google Scholar]
- 4.Lee C, Huh S, Ketter TA, Unser M. Unsupervised connectivity-based thresholding segmentation of midsagittal brain MR images. Comput Biol Med. 1998;28(3):309–338. doi: 10.1016/S0010-4825(98)00013-4. [DOI] [PubMed] [Google Scholar]
- 5.Kim DY, Park JW. Connectivity-based local adaptive thresholding for carotid artery segmentation using MRA images. Image Vis Comput. 2005;23(14):1277–1287. doi: 10.1016/j.imavis.2005.09.005. [DOI] [Google Scholar]
- 6.Hu Q, Hou Z, Nowinski WL. Supervised range-constrained thresholding. IEEE Trans Image Process. 2006;15(1):228–240. doi: 10.1109/TIP.2005.860348. [DOI] [PubMed] [Google Scholar]
- 7.Ray N, Acton ST, Altes T, Lange EE, Brookeman JR. Merging parametric active contours within homogeneous image regions for MRI-based lung segmentation. IEEE Trans Med Imag. 2003;22(2):189–199. doi: 10.1109/TMI.2002.808354. [DOI] [PubMed] [Google Scholar]
- 8.Pluempitiwiriyawej C, Moura JMF, Wu YJ, Ho C. STACS: New active contour scheme for cardiac MR image segmentation. IEEE Trans Med Imag. 2005;24(5):593–603. doi: 10.1109/TMI.2005.843740. [DOI] [PubMed] [Google Scholar]
- 9.Ng HP, Ong SH, Hu Q, Foong KWC, Goh PS, Nowinski WL. Muscles of mastication model-based MR image segmentation. Int J Comput Assis Radiol Surg. 2006;1(3):137–148. doi: 10.1007/s11548-006-0046-4. [DOI] [Google Scholar]
- 10.Ng HP, Ong SH, Foong KWC, Goh PS, Nowinski WL. Masseter segmentation using an improved watershed algorithm with unsupervised classification. Comput Biol Med. 2008;38(2):171–184. doi: 10.1016/j.compbiomed.2007.09.003. [DOI] [PubMed] [Google Scholar]
- 11.Goto TK, Tokumori K, Nakamura Y, Yahagi M, Yuasa K, Okamura K, Kanda S. Volume changes in human masticatory muscles between jaw closing and opening. J Dent Res. 2002;81(6):428–432. doi: 10.1177/154405910208100614. [DOI] [PubMed] [Google Scholar]
- 12.Goto TK, Nishida S, Yahagi M, Langenbach GEJ, Nakamura Y, Tokumori K, Sakai S, Yabuuchi H, Yoshiura K. Size and orientation of masticatory muscles in patients with mandibular laterognathism. J Dent Res. 2006;85(6):552–556. doi: 10.1177/154405910608500614. [DOI] [PubMed] [Google Scholar]
- 13.Lundervold A, Duta N, Taxt T, Jain AK. Model-guided segmentation of corpus callosum in MR images. IEEE Conference on Computer Vision and Pattern Recognition. 1999;1:231–237. [Google Scholar]
- 14.Freedman D, Radke RJ, Zhang T, Jeong Y, Lovelock DM, Chen GT. Model-based segmentation of medical imagery by matching distributions. IEEE Trans Med Imag. 2005;24(3):281–292. doi: 10.1109/TMI.2004.841228. [DOI] [PubMed] [Google Scholar]
- 15.Ng HP, Foong KWC, Ong SH, Liu J, Goh PS, Nowinski WL. Shape determinative slice localization for patient-specific masseter modeling using shape-based interpolation. Int J Comput Assis Radiol Surg. 2007;2(suppl. 1):398–400. [Google Scholar]
- 16.Liu J, Nowinski WL. A hybrid approach to shape-based interpolation of stereotactic atlases of the human brain. Neuroinformatics. 2006;4(2):177–198. doi: 10.1385/NI:4:2:177. [DOI] [PubMed] [Google Scholar]
- 17.Bezdek JC. Pattern recognition with fuzzy objective function algorithm. New York: Plenum; 1981. [Google Scholar]
- 18.Nowinski WL, Liu J, Thirunavuukarasuu A. Quantification of three-dimensional inconsistency of the subthalamic nucleus in the Schaltenbrand-Wahren brain atlas. Stereotact Funct Neurosurg. 2006;84(1):46–55. doi: 10.1159/000093722. [DOI] [PubMed] [Google Scholar]
- 19.Leemput VK, Maes F, Vandermeulen D, Suetens P. Automated model-based tissue classification of MR images of the brain. IEEE Trans Med Imag. 1999;18(10):897–908. doi: 10.1109/42.811270. [DOI] [PubMed] [Google Scholar]
- 20.Fukunaga K, Hummels DM. Leave-one-out procedures for nonparametric error estimates. IEEE Trans Pattern Anal Mach Intell. 1989;11(4):421–423. doi: 10.1109/34.19039. [DOI] [Google Scholar]


