Abstract
The measurement of temperature variation along the surface of the body, provided by digital infrared thermal imaging (DITI), is becoming a valuable auxiliary tool for the early detection of many diseases in medicine. However, DITI is essentially a 2-D technique and its image does not provide useful anatomical information associated with it. However, multimodal image registration and fusion may overcome this difficulty and provide additional information for diagnosis purposes. In this paper, a new method of registering and merging 2-D DITI and 3-D MRI is presented. Registration of the images acquired from the two modalities is necessary as they are acquired with different image systems. Firstly, the body volume of interest is scanned by a MRI system and a set of 2-D DITI of it, at orthogonal angles, is acquired. Next, it is necessary to register these two different sets of images. This is done by creating 2-D MRI projections from the reconstructed 3-D MRI volume and registering it with the DITI. Once registered, the DITI is then projected over the 3-D MRI. The program developed to assess the proposed method to combine MRI and DITI resulted in a new tool for fusing two different image modalities, and it can help medical doctors.
Key words: Infrared thermography, magnetic resonance, image fusion, image registration
INTRODUCTION
Digital infrared thermal imaging (DITI), or simply thermography, uses infrared image sensors to produce quantitative maps of temperature changes along any surface. These maps are displayed as pseudocolor images where the color scale is associated with temperature variations along the surface.
Thermography has many applications in industry, for instance, the inspection of electricity transmission and distribution lines to determine overheat, is a classical application of it. The medical use of thermography is not new, but only recently, with the improved sensitivity (around 0.02°C) of the new generation of infrared sensors, it starts to appear as a safe, efficient, and reliable method for the study of some human pathologies.1–3
The main advantages of thermography as an auxiliary tool in medical diagnosis include its relatively low cost and, more importantly, the fact that it is an essentially noninvasive and completely harmless technique (thermography makes use of the infrared thermal radiation emitted by the body). Nonetheless, this technique has some limitations and thus it is still not used systematically for clinical diagnosis worldwide.
DITI is currently used to assess diseases such as breast and thyroid tumors, cerebral and peripheral vascular disease, rheumatic disease, musculoskeletal disorders and inflammations.1–4 In the particular case of peripheral vascular disease (PVD)—a disease that compromises blood supply to inferior limbs—DITI is used to evaluate the extent of the damage to the limb.5 PVD is characterized by constriction or occlusion of the main arteries that supply blood to the limbs. If not diagnosed in time, PVD can lead to partial or total amputation of the limbs, mainly in the lower body. In these cases, the preservation of the knee joint in patients submitted to amputation because of critical ischemia is associated to a better rehabilitation, mobility, and quality of life post surgery. Unfortunately, because of the absence of a safe, precise, and low-cost method to evaluate the level of local microcirculation compromise, many surgeons still prefer to amputate above the knee joint as a safety procedure. An inadequate amputation of the affected area leads to a difficult healing and a high incidence of reamputation. McCollum et al. have demonstrated that it is possible to determine more accurately the level of amputation in ischemic limbs with the use of thermography.6
In the US, 50% of the inferior limb amputations occur in diabetics with chronic ischemia. The ampu-tation incidence increases with age. People with diabetes are 10 to 15 times more likely to have an amputation of the inferior limbs than nondiabetic individuals.7
Ohsawa et al. have used thermography to determine the amputation level of 35 lower limbs in 27 diabetic patients with critical ischemia.5 Of those, 15 were reamputated to superior levels. Studies determined that the presence of hypothermia in the remaining part of the limb was one of the predominant factors for reamputation. They concluded that skin thermography is an effective technique in the evaluation of amputation level and it can help to prevent reamputation in many cases.
A recent study shows that this technique can be used to determine more accurately the adequate amputation level in ischemic limbs when combined with other data.
In spite of showing details of circulatory physiology, DITI lacks information regarding the local anatomy. This additional information can be obtained, for instance, by combining thermal data with magnetic resonance imaging (MRI) or computer tomography (CT). This combination enhances the clinical analysis of the patient by merging together anatomical and physiological information into one-image dataset. Although DITI does not determine the exact location of a vascular change, it is able to measure the relative temperature variation over the body surface that results from it. DITI indirectly estimates the extent of the changes in blood supply. The data obtained by merging both imaging techniques (DITI and MRI) allows the determination of the extent of anatomic and physiological compromise, thus leading to a better and more adequate surgical intervention.
Recently, techniques for image registration and fusion have become an important tool in image analysis and visualization with special application to multimodal medical imaging.8–10 This article presents a new registration method that allows the fusion and 3-D visualization of combined multimodal medical images with particular interest in combining DITI and MRI.
A computer tool that allows the correlation between the external 2-D thermal maps and the 3-D MRI was developed. Furthermore, the method developed can include data from CT, angio-CT (CTA), and magnetic resonance angiography (MRA).
MATERIALS AND METHODS
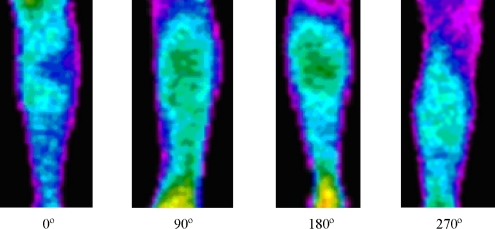
Infrared thermal images were acquired using a Thermovision 470 IR camera. Four thermographic images were acquired from the right lower leg of an asymptomatic volunteer. The camera view-angles were 90° clockwise shift, that is, anterior (0°), lateral (90°), posterior (180°), and medial (270°). The room temperature was set and stabilized at 25°C and all the staff that took part in the process of thermographic image acquisition stayed within the room for approximately 15 min before image acquisition started. This procedure was taken to reduce to a minimum any temperature oscillations within the room during the image acquisition. The acquisition time of each thermographic image was around 60 s.
On the next day (less than 18 h from the thermal images acquisition), a MRI experiment was performed and the right leg of the volunteer was MRI scanned. The MRI dataset was acquired using a Siemens 1.5T clinical scanner and stored in a DICOM standard file. A T1 pulse sequence was selected to acquire a volume covering the region of interest. The size of the acquisition volume was 256 × 256 pixels and 100 slices with 8 bits-per-pixel, 1.0 mm in-plane resolution and 2.0 mm slice thickness.
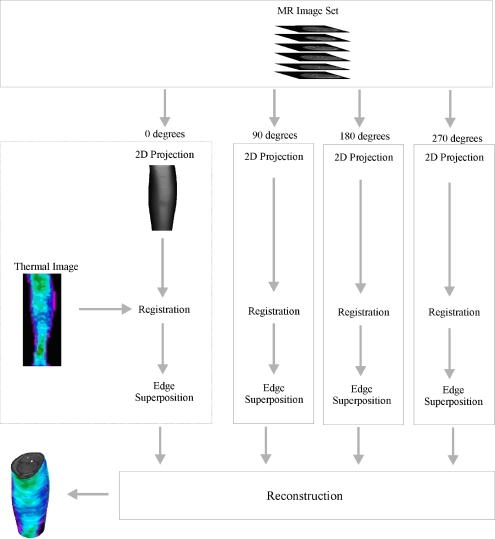
For the registration and fusion processes to be successful and a 3-D model to be created in a satisfactory manner, the following five steps, for each of the four orthogonal views, are followed (Fig. 1):
Determine the object external contour for each MRI slice using any thresholding technique;
For each one of the orthogonal thermography view, a correspondent 2-D projection of the reconstructed 3-D MRI volume was created using a similar technique of the classical Range Image;11,12
Register the resulting 2-D MRI projection with the corresponding thermal images (same view angle);
Backproject the registered thermal images onto the surface of the 3-D MRI volume for the appropriate view-angle, by superimposing each line on the thermal image onto the contour of the object for the corresponding MRI slice;
Perform visualization of the resulting 3-D object to show surface temperature distribution together with the internal structures.
Fig 1.
The proposed method to merge the IR thermography data image and the MRI dataset.
The first step to perform the MRI and thermographic image fusion is to register them. This is necessary to merge the different image information. The content of both image modalities has to be spatially occupying the same, or as close as possible, image position and orientation. This is really a nontrivial process as one image displays the body surface temperature changes and the other the anatomical structure within the body.
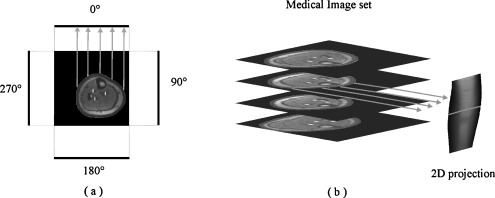
Therefore, to overcome this major problem, we created a 2-D MRI projection from the 3-D MRI volume. Figure 2 illustrates this process. This is done by taking one MRI slice and selecting a line of pixels within the MRI field-of-view (FOV) but outside of the object being imaged. In the sketch shown in Fig. 2(a), for the sake of simplicity, we drew the pixels line outside of the FOV.
Fig 2.
(a) The process of creating the 2-D MRI image projection. (b) 2-D projection obtained from the MRI slices.
Next, for each pixel in this line, we count the number of pixels from it to the object’s outer contour. This number of pixels is then set to the corresponding pixel in the line [see the arrows in Fig. 2(a)]. This is repeated for each pixel in the line and for each MRI slice, taking care to select always the same pixel line position in each slice. At the end of this process, the data of each pixel line is put together in a new 2-D image matrix. This image matrix is called depth image, an analogy to the somehow similar procedure well known as Range Image.11 It is interesting to note that the 2-D MRI projection preserves quite well the external anatomical shape of the real object imaged by the MRI system. To visualize the 2-D MRI projection, it is necessary to normalize the pixels’ values to the range of an 8-bit gray-scale image. We found that histogram equalization gives a better image contrast and enhances some features, especially edges, making the identification of reference points for registration easier and more accurate. We also suggest that before counting the pixels between the line and the object, the tomographic MRI slices passes through any contour algorithm detection, which can be found elsewhere.13 This procedure is repeated for the four orthogonal projections.
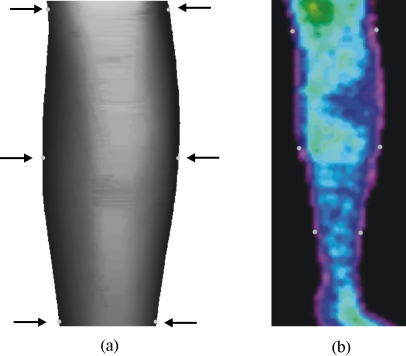
The registration process of the thermographic image over the 2-D MRI projection is illustrated in Fig. 3. Six reference points are manually selected in the thermographic image. Carefully the corre-sponding points in the 2-D MRI projection are then manually marked using the computer mouse. The affine transform technique is then used to perform the necessary adjustment in the tomographic image to merge the selected image reference points.8–10
Fig 3.
(a) 2-D MRI projection and (b) the corresponding thermal thermographic image with the six markers used to perform the image registration.
Once the image registration has been accomplished, both images will have the same size, that is, the number of lines in the thermography is equal to the number of slices of the MRI volume. Thus, the next step to be performed is the projection of the thermographic image information onto the MRI volume, on a slice per slice bases. This process is done so that each line on the thermal image is projected onto the respective object contour on the MRI slice.
The 3-D visualization is done using the graphic library OpenGL. The voxels on the outer surface of the 3-D image show the thermal data while preserving all the MRI morphological information. After the 3-D reconstruction, the user can visualize and interact with the application making geometric transformations such as rotation, translation and scaling, selecting cutting planes, and changing the transparency of the surface.
RESULTS
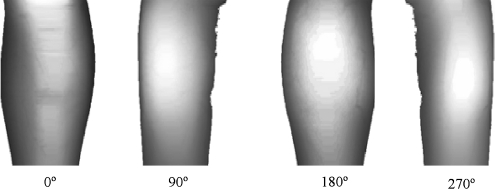
The software has been validated using seven sets of medical images from different modalities (MRI and CT). Among them, the set of MR images of a leg described previously is used to illustrate the process. All four 2-D projections created from the MR dataset are illustrated on Fig. 4. These images are already normalized and equalized. The corresponding thermal images can be seen on Fig. 5.
Fig 4.
2-D MRI projections created from the 3-D MRI volume. The projections were created at 0° (front view), 90°, 180°, and 270°, respectively.
Fig 5.
Thermal images of the leg at different view angles.
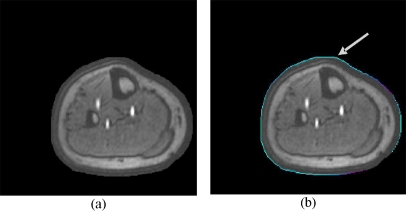
The result from the projection of all four thermal images onto a MR slice is illustrated on Fig. 6 for one MR slice. The process is repeated for the entire MR volume.
Fig 6.
(a) Original MR slice and (b) MR slice with the projected thermal contour (arrow).
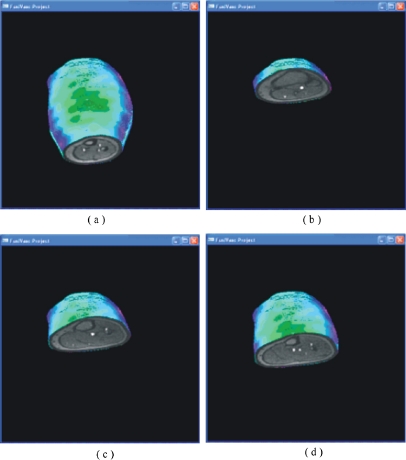
After the 3-D reconstruction, the user can rotate the object in any direction and also slice it (Fig. 7).
Fig 7.
Volume visualization at four different cutting levels. The MR information is clearly seen together with the surface temperature.
DISCUSSION
A new image tool that combines IR thermography and MRI is proposed. The merging of different images information is done by creating a 2-D MRI projection from the 3-D MRI vol-ume and using it as reference position for registering the two different images modalities. The 2-Ds thermographic and MRI projection images are registered using the affine transform technique. Once registered, the transformed thermographic image is backprojected over the 3-D MRI volume.
Preliminary studies showed that only four orthogonal projections are necessary for the data fusion and that a greater number of projections generate redundant information with no significant improvement in the quality of the final results. This also speeds up the entire process, from image acquisition to processing and reconstruction.
The thermographic image acquisition is a critical process as it is necessary to have a well-defined reference for each image plane, so the 2-D MRI projection plane is created at the same view. In our experiments, we choose the front plane as reference and the other three planes were taken at 90°, 180°, and 270° from this reference. In principle, any set of four orthogonal angles can be chosen.
Manual registration of the 2-D images is intrinsically a very difficult task as the reference points are not clearly defined on either set of 2-D images and further investigation is necessary to develop a fully automatic multimodal registration process. However, as the information displayed on thermal images are not spatially confined to small regions, but distributed over reasonably large areas with slow changes in intensity, any small inaccuracy on the registration process has little or no significant impact on the quality of the final results.
An initial prototype of the computer tool was created and tested using MatLab® version 6.5. Once the key processes had been fully operational, an interface was developed using OpenGL and the processes implemented in it.
The validation of the process was done using MRA, MRI, and CT images. However, this study goes as far as the development of the method and the creation of the computer tool. Clinical studies need to be carried out to establish a correlation between surface thermal information and internal clinical findings.
Some of the further improvements on the interface would include tools for the segmentation and visualization of different structures, quantitative analysis of the 3-D volume, and the use of other modalities such as CT.
CONCLUSIONS
In the present project, the aim was to build a computer tool for the fusion of multimodal images with particular interest on thermal and MR images. The result is a tool to aid professionals in the medical area.
The software developed is reasonably easy to use and the results obtained in tests with image groups showed that the combination of thermography and MRI provides important information in the evaluation of some pathologies.
Acknowledgements
The authors wish to thank the Brazilian National Research Council (CNPQ-project 552170/2002-0) for sponsoring this research project; Dr. Heraldo de Mello Filho, Dr. Heraldo de Mello Neto (X-Leme Medical Clinics), and Dr. Marcos L. Brioschi for their valuable help.
References
- 1.Jones BF. A reappraisal of the use of infrared thermal image analysis in medicine. IEEE Trans Med Imag. 1998;17(6):1019–1027. doi: 10.1109/42.746635. [DOI] [PubMed] [Google Scholar]
- 2.Jones BF, Plassmann P. Digital infrared thermal imaging of human skin. IEEE Eng Med Biol Mag. 2002;21(6):41–48. doi: 10.1109/MEMB.2002.1175137. [DOI] [PubMed] [Google Scholar]
- 3.Brioschi ML, Macedo JF, Macedo RAC. Skin thermometry: new concepts. J Vasc Br. 2003;2(2):151–160. [Google Scholar]
- 4.Aksenov P, et al: 3D thermography for the quantification of heat generation resulting from inflammation. Proceedings of the 8th 3D modelling symposium, Paris, France, 2003
- 5.Ohsawa S, Inamori Y, Fukuda K, Hirotuji M. Lower limb amputation for diabetic foot. Arch Orthop Trauma Surg. 2001;121(4):186–190. doi: 10.1007/s004020000207. [DOI] [PubMed] [Google Scholar]
- 6.McCollum PT, Spence VA, Walker WF. Amputation for peripheral vascular disease: the case for level selection. Br J Surg. 1988;75(12):1193–1195. doi: 10.1002/bjs.1800751215. [DOI] [PubMed] [Google Scholar]
- 7.Carrington AL, Abbott CA, Griffiths J, Jackson N, Johnson SR, Kulkarni J, Ross ERE, Boulton AJM. A foot care program for diabetic unilateral lower-limb amputees. Diabetes Care. 2001;24:216–221. doi: 10.2337/diacare.24.2.216. [DOI] [PubMed] [Google Scholar]
- 8.Maintz JBA, Viergever MA. A survey of medical image registration. Med Image Anal. 1998;2(1):1–36. doi: 10.1016/S1361-8415(01)80026-8. [DOI] [PubMed] [Google Scholar]
- 9.Zitová B, Flusser J. Image registration methods: a survey. Image Vis Comput. 2003;21:977–1000. doi: 10.1016/S0262-8856(03)00137-9. [DOI] [Google Scholar]
- 10.Hill DLG, Batchelor PG, Holden M, Hawkes DJ. Medical image registration. Phys Med Biol. 2001;46:R1–R45. doi: 10.1088/0031-9155/46/3/201. [DOI] [PubMed] [Google Scholar]
- 11.Jain R, Kasturi R, Schunck BG. Machine vision. New York: McGraw-Hill; 1995. [Google Scholar]
- 12.Gariba MA, Sanches IJ, Pardal FC, Bichinho GL: A method for registration and visualization of 3D MR images and 2D thermographic images for clinical application. CARS 2005 Proceedings, Berlin, 2005
- 13.Gonzalez RC, Woods RE: Digital image processing, 2nd edn. Prentice Hall, New Jersey, 2002


