Abstract
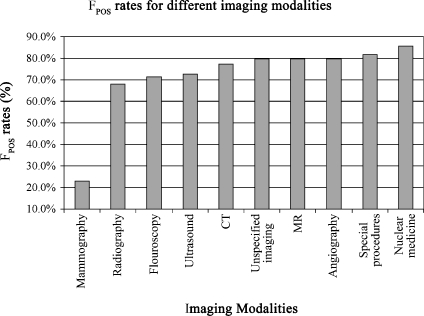
The purpose of our study was to demonstrate the use of Natural Language Processing (Leximer), along with Online Analytic Processing, (NLP-OLAP), for extraction of finding trends in a large radiology practice. Prior studies have validated the Natural Language Processing (NLP) program, Leximer for classifying unstructured radiology reports based on the presence of positive radiology findings (FPOS) and negative radiology findings (FNEG). The FPOS included new relevant radiology findings and any change in status from prior imaging. Electronic radiology reports from 1995–2002 and data from analysis of these reports with NLP-Leximer were saved in a data warehouse and exported to a multidimensional structure called the Radcube. Various relational queries on the data in the Radcube were performed using OLAP technique. Thus, NLP-OLAP was applied to determine trends of FPOS in different radiology exams for different patient and examination attributes. Pivot tables were exported from NLP-OLAP interface to Microsoft Excel for statistical analysis. Radcube allowed rapid and comprehensive analysis of FPOS and FNEG trends in a large radiology report database. Trends of FPOS were extracted for different patient attributes such as age groups, gender, clinical indications, diseases with ICD codes, patient types (inpatient, ambulatory), imaging characteristics such as imaging modalities, referring physicians, radiology subspecialties, and body regions. Data analysis showed substantial differences between FPOS rates for different imaging modalities ranging from 23.1% (mammography, 49,163/212,906) to 85.8% (nuclear medicine, 93,852/109,374; p < 0.0001). In conclusion, NLP-OLAP can help in analysis of yield of different radiology exams from a large radiology report database.
Key words: Natural language processing, Online Analytical Processing (OLAP), data mining
Introduction
Information theory is a discipline in mathematics, which describes information and communication, and the problems associated with extraction of essential information from a message. The extraction of meaning from general text is described as communication over a noisy channel, in which unimportant terms represent noise, and relevant terminology represents the signal. Thus, the central paradigm of information theory is extracting essential information (signals) from a message by removing the noise with entropy reduction techniques. The mathematical expression for information in this theory resembles the expression for entropy in thermodynamics, which implies that the greater the information in a message, the lower its randomness or entropy1.
With the increasing availability and prevalence of digital information, these information theory concepts have been applied for various purposes beyond their original intent. These include the analysis of digital text by Natural Language Processing (NLP). The NLP programs use these information theory principles for analyzing digital text and reducing it to its essential elements. They process and convert text in unstructured narrative documents into a format that is appropriate for computer-based analysis for extraction of specific information. We developed a similar NLP program to extract pertinent information such as presence or absence of findings from electronic radiology reports2. This analysis of relative rates of positive and negative findings in radiology reports can help to determine the yield of high-cost imaging exams performed for different patient and imaging attributes which is important given the rising concerns about the spiraling health care costs and increase in the use of radiology services3–8. In addition, the comparison of the finding trends for radiologists of different subspecialties as well as within each subspecialty can help in setting standards and identify outliers or inconsistencies in practice.
Such analysis of findings would have to include millions of radiology reports to make meaningful inferences for several dependent and independent variables influencing the relative rates of positive and negative radiology examinations. Manual interpretation of these data to determine the yield of specific imaging examinations for a particular clinical variable would be time consuming and essentially impractical. In addition, most electronic radiology reports are only available in a free-text or unstructured form with a considerable amount of text that does not carry much meaning or intent with respect to diagnostic findings. Therefore, to overcome the limitation of time-consuming manual interpretation of findings and automating the process of extracting relevant information, such as pertinent radiology findings, we applied the NLP program to analyze a large electronic radiology reports database. We further used this NLP program in conjunction with Online Analytic Processing (OLAP) technique to determine the relative rates of positive and negative reports for different patient and imaging characteristics as well as different radiologists.
The purpose of our study was to demonstrate the use of NLP (Leximer) along with OLAP for extraction of finding trends in a large radiology practice. Furthermore, we determined the relative rates of positive and negative reports for different patient attributes and subspecialties.
Materials and Methods
The local ethical committee of our hospital approved this Health Insurance Portability and Accountability Act (HIPAA) compliant study, which involved retrospective analysis of radiology reports, and the need to obtain informed consent was waived.
Financial Disclosure
Two coauthors (K.J.D. and T.J.S.) received royalties for Radcube (Leximer) patent licensing to Nuance Inc. which is the commercial vendor for the product. The remaining co-authors have no financial disclosures and had complete and independent access to the data presented in this article.
NLP-OLAP (Radcube)
We used a recently developed NLP and feature extraction program (Lexicon-mediated entropy reduction, Leximer)2 to analyze free text, unstructured radiology reports, and categorize them into reports with positive radiology findings (FPOS) and negative radiology findings (FNEG). The FPOS were defined as reports with new relevant findings or a change in the status from prior imaging. The FNEG included reports with no radiology findings, stable disease, and no change in the findings since prior imaging or some incidental findings, which were not clinically relevant findings such as calcified granulomas, age related cerebral atrophy or simple renal cysts. Radiology reports were classified as FPOS, if they had explicit statements reflecting a change in a previously described abnormality such as “previously noted fracture has healed,” “the disease has progressed on the present study,” or “previously noted lesion is no longer seen.” Also, reports with new findings such as pneumothorax or lung mass were classified as FPOS on the first study, but were considered FNEG on all subsequent studies if the radiologist documented “stable disease” or “no change in findings compared to prior exams.” Radiology reports with merely the mention that “no abnormality is noted on the study” without the inclusion of words such as “compared to prior radiology report” were categorized as FNEG even if it implied a change in status compared to prior imaging.
After classification of the reports into FPOS and FNEG by the NLP program, trends of FPOS and FNEG in the radiology reports database were analyzed with OLAP by performing various multidimensional relational queries in a structure called Radcube.
Prior publications have evaluated the NLP program used in the present study for extraction of specific signals for findings from other contents or data in the radiology reports2. The program was found to have accuracy, sensitivity, specificity, positive and negative predictive values of 97.5% (95% confidence interval [CI]: 96.6%, 98.5%), 98.9% (95% CI: 97.9%, 99.6%), 94.9% (95% CI: 93.1%, 96.0%), 97.5% (95% CI: 96.6%, 98.0%), and 97.7% (95% CI: 95.8%, 98.8%), respectively, for classifying radiology reports on the basis of presence of findings or FPOS2. Also, there was no difference in accuracy of the NLP program for different radiology subspecialties (for example, thoracic radiology, neuroradiology, abdominal imaging, breast imaging,) and different imaging modalities such as vascular procedure (which includes interventional radiology), barium, computed tomography (CT), mammography, magnetic resonance imaging (MRI), positron emission tomography, radiography, ultrasound, and nuclear medicine2.
In the present retrospective, cross-sectional observation study, all electronic radiology reports were exported from the Radiology Information System (RIS) via a Health Level 7 (HL-7) link to form a radiology reports database. Each radiology report included two sections, one with structured data and the other with unstructured text. The structured section of the report contained exam header information such as the patient’s name, medical record number, accession or examination number, billing number, gender, date of birth, as well as date of the imaging examination, exam type, body region being examined, clinical indication, referring physician, and radiologist. The unstructured radiology text comprised of free-text final radiology reports signed off by radiologists and often included a findings section and an impression section.
The NLP program was trained to analyze the unstructured radiology reports, reduce the entropy or noise (data without much diagnostic value) and preserve the outcome or signal (data with some meaning or intent). It parsed specific signals or outcomes such as findings from other contents by phrase-level extraction, text parsing (breaking text into smaller parts with punctuation-based phrase isolation through use of an internally developed parser) and syntactic algorithms (created to group phrases)2.
This program obtained a report in the form of a text file and then broke it to its composite elements or phrases (text parsing for phrase level extraction). At the time of phrase identification and extraction, the location of the phrase was determined, and priority was given to the impression and conclusion section which were likely to contain more information and findings than the non-summarizing locations like the body of the report. These phrases extracted were processed for signal extraction by the decision trees. The phrases parsed by the NLP program were known as the raw concepts. The basic principles of the NLP program were that if some of the raw concepts matched with the nodal terms in decision tree algorithms, it enhanced the likelihood of the presence of a positive finding, whereas another set of nodal term matches (such as “not seen”) was a strong indication of a negative finding.
These decision tree nodal terms were chosen by manual selection of terms which were likely to represent high signal for presence or absence of findings by a group of radiologists within a selected set of radiology reports. The Leximer program was initially trained on 200 consecutive CT and MR reports with known classification of findings and approximately 50 decision tree optimizing iterations were performed (K.J.D.) while monitoring the accuracy at every step. This was followed by an addition of 180 reports representative of all imaging modalities, and 20 additional iterations were performed to achieve a higher accuracy for classifying the reports on the basis of presence or absence of findings.
The NLP program thus categorized the database on the basis of presence or absence of findings, that is FPOS and FNEG. The results of the NLP program analysis along with other radiological data obtained from the structured sections of the reports from different sources like RIS, PACS, and voice recognition were saved in a data warehouse and exported to a multidimensional data structure called Radcube.
Multiple relational and comparative queries pertaining to finding trends were performed on the data in the Radcube using the OLAP technique (Microsoft Inc., Redmond, WA, USA). It uses the relationships defined in data warehouse, aggregates the relationships, and stores the pre-aggregated counts in a propriety data format. The most basic abstraction of the data within Radcube such as individual radiologists or individual clinical indications are called attributes. Facts are the attributes that describe the measures and a dimension is a collection of related attributes. For example, in our study, all radiologists, findings, indications, patient age groups, and referring physicians were the dimensions, whereas facts included measures such as the number of radiologists, number of findings, and number of discrete reports.
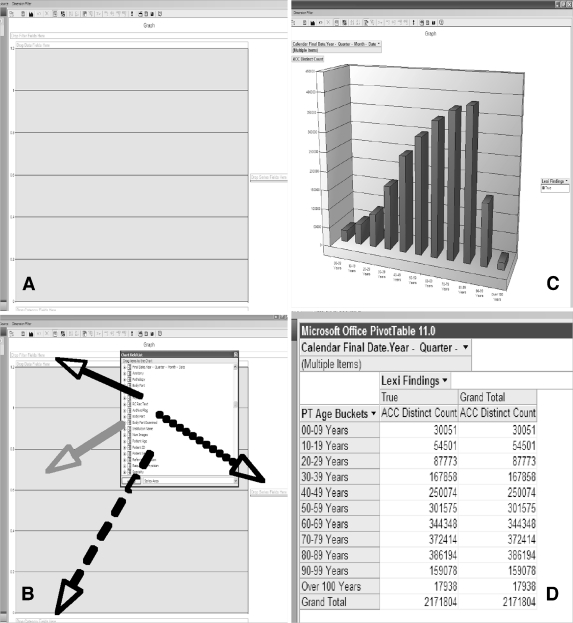
A visualization application of Radcube was used to create a query as well as to view the results. The dimensions were arranged in a field list form on the visualization application. Different dimensions were selected from the list, dragged and dropped to a graphical layout (Fig. 1). These drag and drop operations were relayed as Multi-Dimension Expression (MDX) language queries to the server of Radcube using the OLAP query application. The MDX is the query language used to work with and retrieve multidimensional data. By linking all the exams having a common radiology accession number, the server performed a series of permutations, created relationships between the data, and produced results. The accession number was used as the granularity (smallest attribute to count), as it was a unique value of the exam to which all the data fields could be related. These results were relayed back to appear on the visualization application and viewed with Microsoft Office web components like graphs and pivot tables. These can be exported from Radcube interface to Microsoft Excel for statistical analysis.
Fig 1.
Steps involved in querying NLP-OLAP data. First, the visualization application is launched (a), then, the chart field list is opened, and different dimensions selected from the list are dragged and dropped to the graph-like layout (b). The program generates graphs (c), and pivot tables (d) for the particular query on different dimensions.
The NLP-OLAP cube used in our study allowed organization of information into a common platform for efficient analysis of large databases. This Radcube interface enabled rapid analysis of the data by optimizing limitless queries for data analysis. It allowed efficient data storage, management, and querying along with the ability for data analysis without any special training.
Thus, the different applications used in our study include the NLP program, OLAP engine, and the visualization tool for viewing the results of the query. All these applications run on Windows. The SQL Server 2005 (Microsoft Inc., Redmond, WA, USA) is the OLAP database engine. This program is commercially available through Microsoft Inc. The NLP program and the visualization tool were written in C# (C-Sharp) language and developed at our institution. The NLP program also runs on the same system as the OLAP engine.
Data Collection
In the present study, NLP-OLAP was used to analyze electronic radiology reports from 1995 to 2002 (n = 3,201,276). Of these, the program excluded reports with incomplete or no text (n = 34,903, 1.1%). Thus, our final sample size included 3,166,373 radiology reports. The radiology reports were categorized on the basis of different age groups such as 0–9 years, n = 48,090; 10–19 years, n = 92,025; 20–29 years, n = 148,639; 30–39 years, n = 274,059; 40–49 years, n = 391,848; 50–59 years, n = 469,810; 60–69 years, n = 507,657; and over 70 years, n = 1,234,245. Similar to age classification within Radcube, radiology reports were also classified according to the gender (males, n = 1,470,825; females, n = 1,695,459; and unknown, n = 89), imaging modalities (angiography, n = 49,330; CT, n = 391,617; fluoroscopy, n = 56,155; MR imaging, n = 166,189; mammography, n = 212,906; nuclear medicine, n = 109,374; radiography, n = 1,742,150; special procedures, n = 68,660; ultrasound, n = 319,579; and unspecified imaging tests, n = 50,413), referring physicians, radiology subspecialties, radiologists, clinical indications, patient types (outpatient, n = 2,173,661; inpatient, n = 894,462; emergency department, and other satellite centers of our institute, n = 98,250), and other attributes.
Overall FPOS rates were obtained for different attributes available in Radcube. In cases of referring physicians, we used NLP-OLAP to obtain FPOS rates for all those physicians ordering more than 100 exams (n = 315) only (total n = 98,831exams; average n = 314 exams; range, n = 100–2757 exams). For analysis of trends for different patient types, outpatients, emergency department, and patients from other satellite centers were grouped together as ambulatory patients, and FPOS rates were obtained for ambulatory patients and inpatients. NLP-OLAP combined different patient and imaging attributes to obtain composite trends such as FPOS rates for a given imaging exam in different age groups for a given clinical indication.
The Radcube was also used to categorize the reports on the basis of the number of exams performed annually. Thus, NLP-OLAP was used to extract annual FPOS rates from 1995 to 2002 for each attribute. In addition, the time taken to perform different queries on a standard stand alone personal computer was also recorded (Intel Pentium 4 central processing units, 3.00 GHz and 1.49 GB of RAM).
Statistical Analysis
Data analyses were performed using SAS statistics software (SAS Inc., Cary, NC, USA) and Microsoft Excel (Microsoft Inc). Logistic regression models were used to test for differences in different age groups, imaging modalities, patient types, diseases, radiology subspecialties, referring physicians, and indications for FPOS and FNEG rates. Comparisons of FPOS rates in males and females temporally and for different age groups were made using the Student’s t tests. A p value of less than 0.05 was considered to represent statistical significance. We anticipated that screening tests such as mammography can skew the findings’ results particularly for female patients. Therefore, we performed a stratified analysis of FPOS rates for male and female patients after excluding mammography from the radiology reports database.
Results
NLP-OLAP allowed rapid analysis of the FPOS and FNEG trends in a large radiology report database comprising of 3,166,373 radiology reports. Of the total reports, 2,171,804 reports had FPOS (68.6%), and FNEG was noted in 994,569 reports (31.4%). The change in the total volume of imaging exams and FPOS rates attained by NLP-OLAP from 1995 to 2002 are illustrated in Table 1.
Table 1.
Temporal Trends of FPOS Rates and Volume of Exams from 1995 to 2002
| Year | Findings | Percent change | ||
|---|---|---|---|---|
| FPOS rates (%) | FPOS rates (%) | Volume | ||
| 1995 | 68.1 | (230,657/338,491) | N/A | N/A |
| 1996 | 68.1 | (234,167/343,638) | 0.0 | 1.5 |
| 1997 | 67.7 | (227,823/336,481) | −0.4 | −2.1 |
| 1998 | 67.9 | (253,064/372,475) | 0.2 | 10.7 |
| 1999 | 67.6 | (259,298/383,633) | −0.4 | 3.0 |
| 2000 | 68.9 | (293,206/425,572) | 1.3 | 10.9 |
| 2001 | 70.1 | (323,184/461,076) | 1.2 | 8.3 |
| 2002 | 69.4 | (350,405/505,007) | −0.7 | 9.5 |
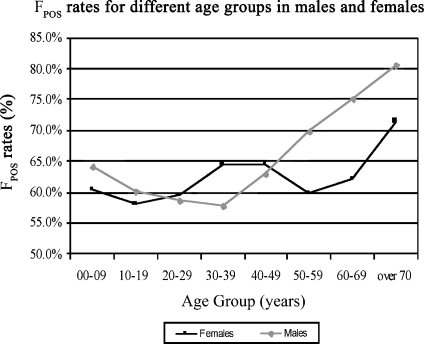
The NLP-OLAP showed FPOS rates for different patient attributes such as patient age with lowest FPOS rates in the age group of 20–29 years (59.1%, 87,773/148,639) followed by 10–19 years (59.2%, 54,501/92,025) and patient gender, indicating significantly higher FPOS rates in male patients (72.0%, 1,058,348/1,470,825) than female patients (65.7%, 1,113,382/1,695,459) (p < 0.0001). By excluding the mammography reports from this analysis, the FPOS rates in women increased substantially from 65.7% to 71.8% (1,064,745/1,483,227) but remained 72.0% (1,057,823/1,470,154) in males.
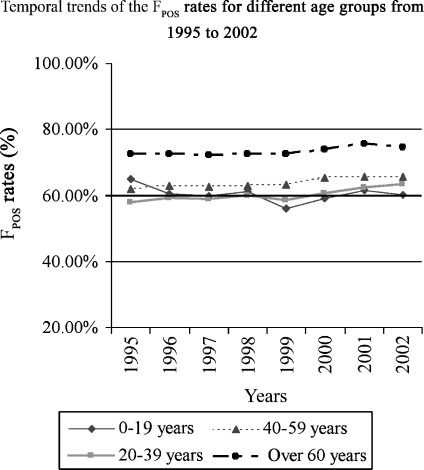
It also illustrated the lowest FPOS rates in the age group of 10–19 years in females (58.0%, 23,945/41,266) and 30–39 years in male patients (57.8%, 74,603/129,151; Fig. 2) with no significant difference in the FPOS trends for different age groups between males and females (p = 0.40). The temporal trends of FPOS rates for different age groups obtained with the program are illustrated in Figure 3.
Fig 2.
Line graph illustrates FPOS rates (y-axis) for different age groups (x-axis) in male (gray line) and female (black line) patients. As age increases, males tend to have higher FPOS rates when compared to female patients.
Fig 3.
Line diagram illustrates the temporal trends of FPOS rates (y-axis) for different age groups from 1995–2002 (x-axis).
Common clinical indications for CT and MR studies and their FPOS rates are illustrated in Table 2, and common clinical indications with low FPOS rates are illustrated in Table 3.
Table 2.
Common Clinical Indications (with more than 100 exams) for CT and MR Studies and Their FPOS Rates
| CT | MRI | ||||
|---|---|---|---|---|---|
| Common indications | FPOS rates (%) | No. of exams | Common indications | FPOS rates (%) | No. of exams |
| Abdominal or pelvic pain | 80.7 | 5,443 | Joint pain | 94.6 | 6,323 |
| Nodule on previous CT scan | 80.4 | 4,956 | Back pain | 89.7 | 5,035 |
| Abnormal chest X-ray | 90.5 | 2,771 | Limited movement | 94.6 | 3,446 |
| Persistent cough | 89.2 | 2,228 | Radiculopathy | 91.2 | 3,034 |
| Back pain | 87.3 | 2,073 | Bone pain | 92.1 | 2,733 |
| Hematuria | 84.0 | 1,934 | Sciatic leg pain | 91.0 | 2,497 |
| Shortness of breath | 88.6 | 1,687 | Abnormal extremity sensation | 87.5 | 2,248 |
| Weight loss | 83.4 | 1,405 | Dizziness | 72.2 | 1,615 |
| Lymphadenopathy | 79.1 | 1,272 | Chronic headache | 70.4 | 1,174 |
| Renal calculus | 87.7 | 1,185 | Vision changes | 74.0 | 851 |
Table 3.
Clinical Indications with Low FPOS Rates
| Clinical indications | FPOS rates |
|---|---|
| Lymphoma | 60.7% (632/1,042) |
| Pituitary gland dysfunction | 60.8% (379/623) |
| Chronic headache | 64.0% (429/670) |
| Dizziness | 70.9% (1,579/2,227) |
| Hypertension | 71.2% (1,300/1,826) |
| Sensation loss | 72.0% (542/753) |
| Vision changes | 73.8% (807/1,093) |
| Coronary artery disease | 74.3% (609/820) |
| Dyspnea on exertion | 75.2% (1,473/1,958) |
| Lymphadenopathy | 79.1% (1,048/1,325) |
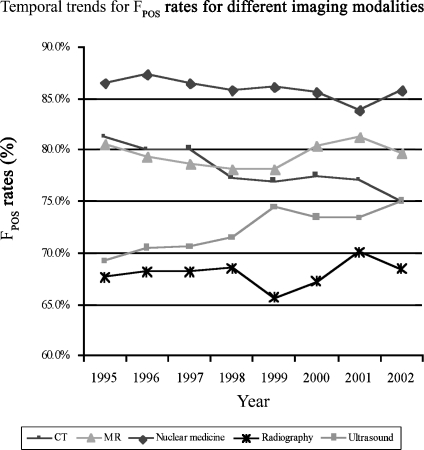
As expected, the program showed that ambulatory patients had significantly lower FPOS rates (64.2%, 1,457,685/2,270,309) when compared to inpatients (79.7%, 713,055/894,462; p < 0.0001). FPOS rates were also obtained for different imaging modalities (Fig. 4), as well as for radiology subspecialties such as neuroradiology, 69.5% (75,917/109,155); breast imaging, 33.3% (109,172/328,249); abdominal imaging, 54.1% (244,813/452,394); pediatric radiology, 66.4% (14,631/22,021); emergency radiology, 54.8% (64,798/118,296); thoracic imaging, 76.2% (406,300/533,394); musculoskeletal radiology, 69.4% (138,706/199,860); and cardiac imaging, 66.2% (20,361/30,743). Annual FPOS rates for different imaging modalities from 1995 to 2002 are summarized in Figure 5.
Fig 4.
Bar diagram summarizes substantial variability in the FPOS rates (y-axis) by different imaging modalities (x-axis).
Fig 5.
Line diagram illustrates the temporal trends of FPOS rates (y-axis) for different imaging modalities from 1995 to 2002 (x-axis). An increase in FPOS rates for ultrasound and decrease in FPOS rates for CT examinations is observed over the years.
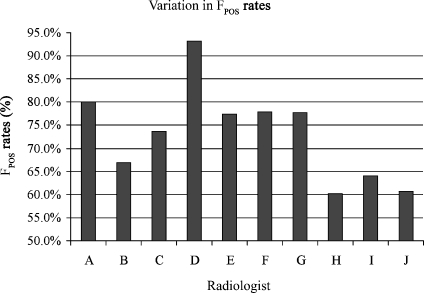
Significant variations were noted in the FPOS and FNEG rates obtained with NLP-OLAP for the imaging exams interpreted by different subspecialty radiologists as well as radiologists within each subspecialty (Fig. 6; p < 0.001). For example, although all radiologists in the cardiac imaging section read the same imaging modalities (cardiac CT and MRI only), they had substantial differences in their FPOS rates. FPOS rates also varied significantly between 38.8% (47/121) and 97.4% (152/156) for radiology examinations ordered by different referring physicians (p < 0.001).
Fig 6.
Bar diagram depicts the FPOS rates (y-axis) for radiologists (x-axis) of the same subspecialty (cardiac imaging). A substantial variation is observed in the FPOS rates of different radiologists.
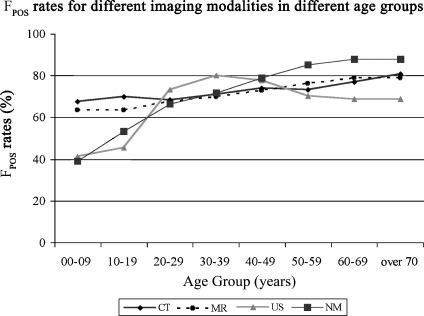
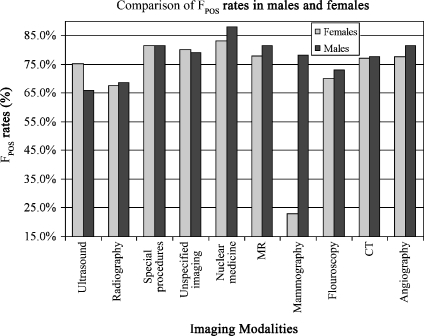
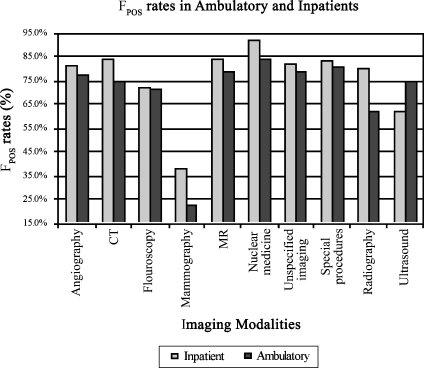
Besides simple trends, Radcube also provided composite trends like FPOS and FNEG rates for different imaging modalities in different age groups (Fig. 7) and for different imaging modalities in male and female patients (Fig. 8). Other examples of the composite trends obtained by NLP-OLAP are the FPOS rates in different patient types (ambulatory and inpatients) for different imaging modalities indicating higher rates for inpatients when compared with ambulatory patients except ultrasound (ambulatory, 75.2%, 194,037/258,149; inpatient, 62.1%, 37,845/60,974; Fig. 9). Table 4 summarizes the relative time taken to obtain results for the most time-consuming queries. The average time for obtaining results with Radcube was 141 s per query ±32 s.
Fig 7.
Line diagram illustrates the FPOS rates (y-axis) for different imaging modalities in different age groups (x-axis).
Fig 8.
Bar diagram shows the FPOS rates (y-axis) for males and females for different imaging modalities (x- axis). Males had higher FPOS rates when compared to females except for ultrasound exams.
Fig 9.
Bar diagram illustrates the variation in the FPOS rates (y-axis) in ambulatory and inpatients for different imaging studies (x-axis). Lower FPOS rates were observed in inpatients except for ultrasound studies.
Table 4.
The Relative Time Taken (in seconds) to Get Results for the Top Ten Queries Which Took the Most Time to Perform in our Study
| FPOS and FNEG rates for | Time to perform the query (s) |
|---|---|
| Commonly presenting clinical indications in CT studies | 198 |
| Ambulatory and inpatients for different imaging modalities | 190 |
| Commonly presenting clinical indications in MR studies | 185 |
| Commonly presenting clinical indications | 182 |
| Different imaging modalities in different age groups | 168 |
| Different imaging modalities in male and female patients | 151 |
| Abdominal imaging | 148 |
| Emergency radiology | 146 |
| Breast imaging | 145 |
| Number of examinations for: | |
| Different clinical indications in CT studies | 178 |
| Different clinical indications | 165 |
| Different clinical indications in MR studies | 157 |
The observation was made on an Intel Pentium 4 CPU, 3.00 GHz, and 1.49 GB of RAM system.
Discussion
Randomized control trials and cost effectiveness studies are conducted to assess benefits and risks from the application of an intervention or a technique in a clinical indication. In fact, most drugs only become approved for use after rigorous clinical trials for safety, benefit, and risk. However, in radiology, randomized control trials and cost effectiveness studies are relatively few. One of the reasons for this relative lack is that radiology technology evolves very rapidly, and secondly, there are a few guidelines on definite uses of imaging in different clinical indications. Also, prospective clinical trials are time consuming and expensive. These may represent some of the main reasons for the smaller sample size retrospective investigations that predominate in the radiology literature.
The retrospective studies are aided by the stored data of electronic images, reports, and medical records available in a state-of-the-art radiology practice. These data sources can also provide information about the yield of imaging examinations from analysis of relative rates of positive and negative findings in radiology reports. It is important to assess the relative rates of positive and negative findings in radiology reports, as concerns have been expressed about the overuse of radiology exams with a large number of tests having no or negative findings in the results7,8. Exams with high negative finding rates may be contributing to the rising costs of imaging studies and may, in fact, expose the patients to unnecessary risks associated with imaging such as contrast reactions, radiation exposure, or further invasive workup of indeterminate lesions. We developed NLP-OLAP program to enable rapid and efficient analysis of a large number of radiology reports for determining the relative rates of positive and negative reports of radiology examinations for different clinical indications, patient age groups, gender, and patient types (inpatient versus outpatient).
NLP has been used in prior studies for assessing free-text medical records both in radiology and other clinical disciplines2,9–17. Hersch et al. described a set of experiments to adapt Semantic and Probabilistic Heuristic Information Retrieval Environment (SAPHIRE) system, a natural language processing program, for automated indexing of radiology reports5. The SAPHIRE system, which matched text to concepts in Unified Medical Language System, or UMLS Metathesaurus, was trained and used by the authors for indexing of findings and diagnosis in radiology reports by recognizing the important Metathesaurus terms9.
In another study, a NLP program (MEDLEE) was used to identify 24 common clinical conditions in a database of 889,921 chest radiographic reports15. This processor coded the information in radiology reports by converting the narrative text to a semantic structure which contained a controlled vocabulary. Other studies using NLP for automatic detection and extraction of information from narrative reports include use of another NLP program, LifeCode (A-Life Medical, Inc., San Diego, CA, USA) for coding of findings in a set of 500 cancer-related radiology reports16. In this program, NLP and the medical coding expert system were combined for extracting clinical information from free-text clinical records and were optimized by using 1,400 chest X-ray reports16. Similarly, NLP has also been used for coding neuroradiology reports for identifying stroke-related findings14 and specific clinical conditions such as acute bacterial pneumonia from chest X-ray reports13.
Some studies have described the use of other data-mining techniques on top of NLP18,19. However, use of OLAP as a platform for data mining along with NLP has not been described in clinical research. Most clinical studies have described use of Microsoft Access (Microsoft Inc., Redmond, WA, USA) and Structured Query Language (SQL) for data mining20–29.
Querying large databases with Access or SQL programs typically require programming specific queries, which can take up to several hours to complete, depending on the complexity of the analysis. OLAP databases such as the one used in our study draw their source data from SQL databases (or other large data sets), which is stored in a multidimensional summarized form. This abstracted form makes OLAP a fast, easy, and interactive program to aggregated data and to drill down to detail. It allows users to query large volumes of data with minimal dependence on database programmers.
Our study shows how NLP-OLAP can be used to derive finding trends in radiology reports and to analyze FPOS rates for various patient and imaging characteristics such as different patient age groups, gender, imaging modalities, referring physicians, radiologists of different subspecialties, clinical indications, and diseases. We are in the process of implementing the NLP-OLAP program on the hospital intranet. This password-protected program would provide to the referring physicians and the radiologists information on the finding rates in radiology reports for different patient and imaging characteristics. We believe that this program can help physicians to modify their practice to decrease exams with a high negative rate for findings.
The report database analysis with NLP-OLAP also revealed a few notable findings. For patients’ gender, NLP-OLAP showed that radiology exams in female patients had a lower finding rate. This was specially seen in the 60–69 years age group (difference of 12.7% in FPOS observed between men and women). The differences in the positive finding rates between men and women were due to the negative reports for large number of screening mammograms performed in female patients. This was confirmed by excluding the mammography reports, which increased the FPOS rates in women substantially from 65.7% to 71.8% without affecting the FPOS rates in men.
Also, FPOS rates for mammography reports of men were higher than women, which are likely due to the fact that screening mammography is unusual in men. We are not aware of any such observation reported in the literature. Symptomatic men (men with a lump) are usually managed clinically, and if they have a clinically suspicious lump, they may undergo a biopsy without a mammogram. Women had slightly lower finding rate (77.9%) in MRI exams when compared to men (81.5%). By identifying the factors responsible for low yield of exams, appropriate measures may be taken to optimize referral indications for a particular modality.
Nuclear medicine was observed to have slightly high FPOS rates compared to other modalities. Although the causes of high relative rates of positive reports were not evaluated, use of a different threshold for performing a nuclear medicine examination at our institution or different clinical indications or disease stage at the time of examination are potential causes. Another possibly anecdotal observation in our study is a high FPOS rate for back pain. Several factors may have contributed to this observation, for example, labeling of noncontributory spine findings (early degenerative spine disease) and incidental findings (ovarian cyst, renal cyst) as FPOS. Also, physicians may follow a different threshold for requesting radiology examinations at our institution, which may have resulted in higher FPOS rates. In addition, we were limited by the program’s current inability to query the clinical indication in sufficient detail for differentiating between suspected and known diagnoses and provide relevant FPOS rates for the same.
We believe that finding trends for different imaging modalities in different age groups and clinical indications can help radiologists as well referring physicians to identify the lower yield imaging studies for specific patient ages particularly among the younger and elderly groups and also for different clinical indications.
In the long term, this methodology has the potential of being adopted by many hospitals for assessing and improving their radiology practice. The finding trends obtained by NLP-OLAP using multicenter radiology report data may help in setting benchmarks for different clinical and patient variables such as age groups, gender, imaging modalities, and radiology subspecialties. Monitoring the finding trends of different departments, subspecialties, and individual referring physicians can identify variations in the practice, and outliers and corrective measures can be taken to homogenize the practice across different centers. This can be achieved by providing feedback to physicians in the form of retrospective reports. In addition, integrating these results with exam ordering to provide real time benchmarking and alerting at the time of ordering exams can have even a greater effect on the practice. Centers with low yield may then modify their practice to achieve an “acceptable level” of yield for imaging tests. Monitoring the practice at different centers and limiting the low yield exams would help in the optimization of practices while avoiding added costs and contrast and radiation-related risks associated with these imaging exams. Thus, this application can be of great value for continuous quality monitoring and improvement in radiology. Current limitations and possible measures needed to achieve these goals would include applying this program to a multi-institutional database, and determining the real clinical relevance of the positive and negative classifications by Leximer and integrating this software with the radiology information system (RIS) among different practices.
Although radiologists do not order most radiology exams, there is a criticism about overuse of imaging and rising costs associated with use of radiology services. NLP-OLAP can provide important information to radiologists about relative FPOS rates for different imaging modalities. Such information can help the radiologists to set up imaging algorithms for different clinical indications in collaboration with their referring physicians. Radiologists can also use such information to educate residents, fellows, and physicians about the appropriate use of an imaging test for a given clinical indication. The more crucial question, however, remains unanswered in the present study, which is defining the threshold for a significant negative finding rate. Furthermore, the acceptable threshold may be different for different indications, as some conditions may be clinically subtle to detect without imaging but catastrophic to miss. Further studies would be necessary for defining such thresholds for FPOS rates and trigger change in the existing algorithms based on risks versus benefits analysis. These studies may also help the third party payers to assess cost effectiveness of different imaging modalities for different clinical indications and patient demographics.
Our study has certain limitations. The FPOS and FNEG rates derived from the NLP-OLAP may have some errors owing to the accuracy of the program reported to be 97.5% in the prior validation study2. As the NLP program does not communicate or interface with the medical records of the patient, it cannot assess the clinical significance of a positive radiology finding. For example, a CT scan done for coronary artery evaluation may reveal a finding such as a pulmonary nodule, which in most cases is benign17. Therefore, even though pulmonary nodules on coronary CT angiography are classified as FPOS, in clinical context, the presence of such a finding may not affect the outcome of the patient. Similarly, in some cases, a lack of finding or change in radiology reports categorized as FNEG may be clinically significant. For instance, in a patient presenting with symptoms of appendicitis, a negative finding on CT study would alter the clinical management of the patient substantially. In these circumstances, FNEG is indeed an important finding, as it guides the management and possibly the outcome for a particular clinical presentation. Resolution of these issues of clinical significance of findings will need further studies to assess the true clinical relevance of FPOS and the FNEG.
Another limitation of our study would be that we analyzed radiology reports through 2002. The results of the present study may vary to some extent from the current patterns, as trends may have changed over the last few years. Also, as the current study is not a multi-institutional study and includes radiology reports only from a single tertiary health care center, the finding trends obtained may not reflect trends from other smaller institutions. The fact that patients in a tertiary care academic hospital may be referred from other hospitals, repeat studies of already positive exams or patients with advanced or known disease may skew the results in comparison to other imaging facilities. Also, the NLP-OLAP program cannot differentiate between finding rates of index exams from subsequent follow-up or repeat exams.
Conclusions
In summary, NLP-OLAP can help in the analysis of relative rates of positive and negative reports of different radiology exams from a large radiology report database on the basis of the finding trends. Determination of finding trends can help in the assessment, comparison, and possible improvement of radiology practice. Further studies will be needed to prove and improve the true clinical relevance of what the program perceives as positive and negative findings.
References
- 1.Shannon CE. The mathematical theory of communication. Bell Syst Tech J. 1948;27:379–423. [Google Scholar]
- 2.Dreyer KJ, Kalra MK, Maher MM. Application of recently developed computer algorithm for automated classification of unstructured radiology reports: Validation study. Radiology. 2005;234:323–329. doi: 10.1148/radiol.2341040049. [DOI] [PubMed] [Google Scholar]
- 3.Poisal JA, Truffer C, Smith S, Sisko A. Health spending projections through 2016: Modest changes obscure part D’s impact. Health Aff (Millwood) 2007;26:w242–w253. doi: 10.1377/hlthaff.26.2.w242. [DOI] [PubMed] [Google Scholar]
- 4.Lubitz J. Health, technology, and medical care spending. Health Aff (Millwood) 2005;24(2):w5R81–w5R85. doi: 10.1377/hlthaff.w5.r81. [DOI] [PubMed] [Google Scholar]
- 5.Matin A, Bates DW, Sussman A, Ros P, Hanson R, Khosarani R. Inpatient radiology utilization: trends over the past decade. AJR. 2006;186:7–11. doi: 10.2214/AJR.04.0633. [DOI] [PubMed] [Google Scholar]
- 6.The House Committee on Ways and Means. Statement of Record, American College of Radiology, Josh Cooper. February 10, 2005. Website: http://waysandmeans.house.gov/hearings.asp?formmode=view&id=3074&keywords=cooper (Accessed on May 3, 2007).
- 7.Frush DP. Pediatric CT: practical approach to diminish the radiation dose. Pediatr Radiol. 2002;32:714–7. doi: 10.1007/s00247-002-0797-1. [DOI] [PubMed] [Google Scholar]
- 8.Bhargavan M, Sunshine JH. Utilization of radiology services in United States: Levels and trends in modalities, regions, and populations. Radiology. 2005;234:824–832. doi: 10.1148/radiol.2343031536. [DOI] [PubMed] [Google Scholar]
- 9.Hersh W, Mailhot M, Arnott-Smith C, Lowe H. Selective automated indexing of findings and diagnoses in radiology reports. J Biomed Inform. 2001;34:262–273. doi: 10.1006/jbin.2001.1025. [DOI] [PubMed] [Google Scholar]
- 10.Friedman C, Alderson PO, Austin JH, et al. A general natural-language text processor for clinical radiology. J Am Med Inform Assoc. 1994;1:161–174. doi: 10.1136/jamia.1994.95236146. [DOI] [PMC free article] [PubMed] [Google Scholar]
- 11.Hripcsak G, Friedman C, Alderson PO. Unlocking clinical data from narrative reports: a study of natural language processing. Ann Intern Med. 1995;122:681–688. doi: 10.7326/0003-4819-122-9-199505010-00007. [DOI] [PubMed] [Google Scholar]
- 12.Jain NL, Knirsch CA, Friedman C, Hripcsak G: Identification of suspected tuberculosis patients based on natural language processing of chest radiograph reports. Proc AMIA Annu Fall Symp 542–546, 1996 [PMC free article] [PubMed]
- 13.Fiszman M, Chapman WW, Aronsky D, Evans RS, Haug PJ. Automatic detection of acute bacterial pneumonia from chest X-ray reports. J Am Med Inform Assoc. 2000;7:593–604. doi: 10.1136/jamia.2000.0070593. [DOI] [PMC free article] [PubMed] [Google Scholar]
- 14.Elkins JS, Friedman C, Boden-Albala B. Coding neuroradiology reports for the Northern Manhattan Stroke Study: A comparison of natural language processing and manual review. Comput Biomed Res. 2000;33:1–10. doi: 10.1006/cbmr.1999.1535. [DOI] [PubMed] [Google Scholar]
- 15.Hripcsak G, Austin JH, Alderson PO, Friedman C. Use of natural language processing to translate clinical information from a database of 889,921 chest radiographic reports. Radiology. 2002;224:157–163. doi: 10.1148/radiol.2241011118. [DOI] [PubMed] [Google Scholar]
- 16.Mamlin BW, Heinze DT, McDonald CJ: Automated extraction and normalization of findings from cancer-related free-text radiology reports. AMIA Annu Symp Proc 420–424, 2003 [PMC free article] [PubMed]
- 17.Diederich S, Das M. Solitary pulmonary nodule: Detection and management. Cancer Imaging. 2006;6:S42–S46. doi: 10.1102/1470-7330.2006.9004. [DOI] [PMC free article] [PubMed] [Google Scholar]
- 18.Wilcox AB, Hripcsak G. The role of domain knowledge in automating medical text report classification. J Am Med Inform Assoc. 2003;10:330–338. doi: 10.1197/jamia.M1157. [DOI] [PMC free article] [PubMed] [Google Scholar]
- 19.Wilcox A, Hripcsak G: Medical text representations for inductive learning. Proc AMIA Symp 923–927, 2000 [PMC free article] [PubMed]
- 20.Shah SP, Huang Y, Xu T, Yuen MM, Ling J, Ouellette BF. Atlas—a data warehouse for integrative bioinformatics. BMC Bioinformatics. 2005;6:34. doi: 10.1186/1471-2105-6-34. [DOI] [PMC free article] [PubMed] [Google Scholar]
- 21.Lee TJ, Pouliot Y, Wagner V. BioWarehouse: A bioinformatics database warehouse toolkit. BMC Bioinformatics. 2006;7:170. doi: 10.1186/1471-2105-7-170. [DOI] [PMC free article] [PubMed] [Google Scholar]
- 22.Sanders NW, Mann NH 3rd, Spengler DM: Web client and ODBC access to legacy database information: a low cost approach. Proc AMIA Annu Fall Symp 799–803, 1997 [PMC free article] [PubMed]
- 23.Newland RF, Baker RA, Stanley R. Electronic data processing: the pathway to automated quality control of cardiopulmonary bypass. J Extra Corpor Technol. 2006;38(2):139–143. [PMC free article] [PubMed] [Google Scholar]
- 24.Beer SR, Field WE. Analysis of factors contributing to 674 agricultural driveline-related injuries and fatalities documented between 1970 to 2003. J Agromedicine. 2005;10(3):3–19. doi: 10.1300/J096v10n03_02. [DOI] [PubMed] [Google Scholar]
- 25.Dillavou ED, Muluk SC, Makaroun MS. A decade of change in abdominal aortic aneurysm repair in the United States: Have we improved outcomes equally between men and women? J Vasc Surg. 2006;43(2):230–238. doi: 10.1016/j.jvs.2005.09.043. [DOI] [PubMed] [Google Scholar]
- 26.Robinson B, Frizelle F, Dickson M, Frampton C. Colorectal cancer treated at Christchurch Hospital, New Zealand: a comparison of 1993 and 1998 cohorts. N Z Med J. 2005;118(1210):U1323. [PubMed] [Google Scholar]
- 27.Zavala-Alarcon E, Cecena F, Ashar R. Safety of elective–including “high risk”–percutaneous coronary interventions without on-site cardiac surgery. Am Heart J. 2004;148(4):676–683. doi: 10.1016/j.ahj.2004.03.040. [DOI] [PubMed] [Google Scholar]
- 28.Gu S, Du Y, Chen J. Large-scale quantitative proteomic study of PUMA-induced apoptosis using two-dimensional liquid chromatography-mass spectrometry coupled with amino acid-coded mass tagging. J Proteome Res. 2004;3(6):1191–1200. doi: 10.1021/pr049893a. [DOI] [PubMed] [Google Scholar]
- 29.Creighton C, Hanash S. Mining gene expression databases for association rules. Bioinformatics. 2003;19(1):79–86. doi: 10.1093/bioinformatics/19.1.79. [DOI] [PubMed] [Google Scholar]


