Abstract
The study investigates the effect of a substantial dose reduction on the variability of lung nodule volume measurements by assessing and comparing nodule volumes using a dedicated semiautomated segmentation software on ultralow-dose computed tomography (ULD-CT) and standard-dose computed tomography (SD-CT) data. In 20 patients, thin-slice chest CT datasets (1 mm slice thickness; 20% reconstruction overlap) were acquired at ultralow-dose (120 kV, 5 mAs) and at standard-dose (120 kV, 75 mAs), respectively, and analyzed using the segmentation software OncoTREAT (MeVis, Bremen, Germany; version 1.3). Interobserver variability of volume measurements of 202 solid pulmonary nodules (mean diameter 11 mm, range 3.2–44.5 mm) was calculated for SD-CT and ULD-CT. With respect to interobserver variability, the 95% confidence interval for the relative differences in nodule volume in the intrascan analysis was measured with −9.7% to 8.3% (mean difference −0.7%) for SD-CT and with −12.6% to 12.4% (mean difference −0.2%) for ULD-CT. In the interscan analysis, the 95% confidence intervals for the differences in nodule volume ranged with −25.1% to −23.4% and 26.2% to 28.9% (mean difference 1.4% to 2.1%) dependent on the combination of readers and scans. Intrascan interobserver variability of volume measurements was comparable for ULD-CT and SD-CT data. The calculated variability of volume measurements in the interscan analysis was similar to the data reported in the literature for CT data acquired with equal radiation dose. Thus, the evaluated segmentation software provides nodule volumetry that appears to be independent of the dose level with which the CT source dataset is acquired.
Key words: Chest CT, lung neoplasms, segmentation, computer-aided diagnosis (CAD), radiation dose
Introduction
Chest computed tomography (CT) is the modality of choice to determine the size of a pulmonary mass or of pulmonary nodules in case of metastatic disease. In most cases, nodule size is still determined by the one-dimensional diameter measurement according to the established criteria.1 However, since the majority of pulmonary nodules are not perfectly spherical, volumetric measurement is preferable to diameter measurements for accurate determination of nodule size. In vitro segmentation analysis of artificial nodules rendered excellent results in terms of interobserver and interscan variability.2–4 In these studies, interscan variability was defined as the difference in nodule volume between two consecutive CT scans. Interobserver variability was found to be larger for in vivo volume measurements of pulmonary nodules compared to in vitro phantom studies.5 It has been suggested that the accuracy of volume measurements in vivo strongly depends on the size, location, and in particular, nodule morphology. Closer evaluation of factors that might, however, influence segmentation results besides morphology and location is desirable. In this context, the effect of technical aspects such as CT image compression, reconstruction kernel, CT scanner technology, or observer training levels for computer-assisted lung nodule volumetry has been evaluated in vivo and ex vivo, respectively.6–11
Thin-slice low-dose CT was not only found to be sufficient for the detection of pulmonary nodules and, hence, for the early diagnosis of lung cancer12,13 but was also used to study nodule volumetry. Nodule volumetry and interobserver variability has been evaluated using screening CT datasets acquired in low-dose technique at 30 mAs.14 Wormanns et al. analyzed interscan variability of nodule segmentation using dual-scan data acquired at low dose with 20 effective mAs.15 Goodman et al. performed an interscan analysis comparing nodule volumes determined on three consecutive CT scans, however, using 200–400 mAs for data acquisition.16 The assessment of lesion growth is the major indication for follow-up imaging in low-dose CT screening trials or using routine chest CT. Since adequate size determination and, hence, assessment of lesion growth are considered to be assessed more sensitively with volume than with the diameter measurements, there is clinical need for reproducible volume measurements across different dose levels.
To our knowledge, no in vivo study has been performed to evaluate the impact of dose reduction and, hence, increased image noise on the intrascan and interscan variability of lung nodule volume measurements using a semiautomated segmentation software. Thus, the purpose of the present study was to compare volume measurements of pulmonary nodules using CT data acquired at ultralow dose (ULD-CT) and, consecutively, at standard dose (SD-CT).
Materials and Methods
Study Population and Design
Chest CT datasets of 20 patients (12 females and eight males) were retrospectively analyzed. Patients were examined between March 2004 and May 2005 and retrospectively selected for the present study. In this period, CT data had been acquired in a previously conducted prospective study in which ULD-CT imaging was investigated. Indications for multislice computed tomography (MSCT) had been staging of an extrathoracic primary carcinoma or restaging in case of previously detected lung metastases. Other indications had been suspicious roundish opacities on chest radiograph or suspected pulmonary malignancies in chronic obstructive lung disease. Included were 20 consecutive patients with one or more solid pulmonary nodules reported with a diameter of 3 mm or more. Patients with metastatic disease had been diagnosed with primary lung cancer or metastatic spread of soft tissue sarcoma, cancer of the thyroid gland, and renal cell carcinoma. Exclusion criteria were significant alterations of the lung parenchyma like ground-glass opacities or fibrosis. Two patients had negligible discrete focal overinflation of the lung parenchyma due to low-grade emphysema associated with chronic obstructive pulmonary disease. Two hundred two solid pulmonary nodules were included in the final analysis. Included were only solid nodules including nodules with contact to pleura and vessels. Nodules were spherical as well as nonspherical and irregularly shaped. The number of pulmonary nodules per patient ranged from one to 46 nodules (mean number per patient = 10.2; median number per patient = 6.5).
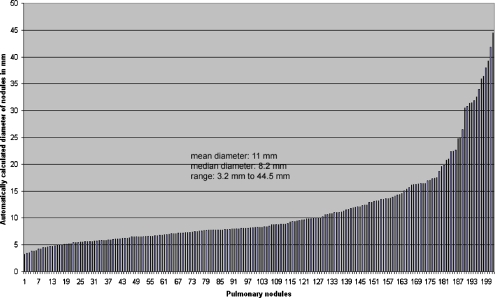
The CT study protocol had institutional review board approval. The distribution of nodules by diameter is shown in Figure 1.
Fig 1.
Distribution of nodule diameters of 202 nodules included in the analysis as measured automatically by the software.
CT Data Acquisition
Two MSCT scans had been obtained in all patients, one scan in ultralow dose (ULD) and, consecutively, another scan in standard-dose (SD) technique, on a 16-slice MSCT scanner (Aquilion 16, Toshiba Medical, Nasu, Japan). Informed consent had been obtained from each patient at the time of the examination. The following scanning parameters had been used for ULD-CT with the patient in supine position and data acquisition during suspended full inspiration: 5 mAs tube current with a pitch of 1.43—hence 3.5 effective mAs—at a tube voltage of 120 kV. All examinations had been reconstructed at a slice thickness of 1 mm with 0.8 mm collimation. Following ULD-CT, the SD-CT dataset had been acquired during suspended full inspiration and after automatic intravenous injection of 80 mL nonionic contrast medium using a standard tube current of 75 mAs with a pitch of 1.43 (hence, 52.2 effective mAs). Thin-slice images used for volume analysis had been reconstructed using a soft tissue kernel (FC12) for both SD-CT and ULD-CT as recommended by the software manufacturer.
Data Analysis
The CT data of the 20 patients were sent to a workstation and analyzed with the OncoTREAT volumetry software (Mevis, Bremen, Germany). This software employs a hybrid combination of region growing and morphological image processing algorithms for segmentation. In order to improve repeatability under varying imaging protocols, the volume is not simply defined as the product of segmented voxels and voxel size. Rather, the partial volume zone around the lesion will be analyzed and voxels near the 3-D boundary of the segmentation mask will contribute to the volume (unless detected as belonging to vasculature or pleura). The contribution of the voxels depends on their gray value and the contrast between lesion and surrounding parenchyma. Details of the algorithm and results of phantom evaluations were published earlier by Bornemann et al.17 and Kuhnigk et al.18
Pulmonary nodules were identified and analyzed by two experienced radiologists (H-C.B., P.A.H.) using axial thin-slice reconstructions. Reconstructed soft tissue kernel images were displayed for nodule detection and selection with lung window level and width setting of 1,500 and −500 HU, respectively, which could be, if necessary, altered by the readers. The readers determined the volumes of all nodules in the datasets independently of their location, size, and morphology. Each reader performed segmentations of each nodule at each dose level.
The reader selected a pulmonary nodule with a single mouse click. Segmentation was then automatically initiated and usually completed within 2–3 s. For detailed verification of segmentation quality, the readers are presented with three orthogonal detail views (showing the axial, coronal, and sagittal sections) of the lesion and a local 3-D volume reconstruction with a bright color isosurface rendering of the segmentation result embedded. Whenever semiautomatic nodule segmentation was not satisfying after five attempts, a poor quality result was recorded by the reader. If both readers found the segmentation inappropriate, this nodule was excluded from further analysis.
To avoid bias through recognition of a previously obtained segmentation result, ULD-CT and SD-CT datasets of the same patient were analyzed with at least some days between readings. For the purpose of result registration, the serially numbered locations of the pulmonary nodules already segmented by one of the readers were marked in the CT dataset. These markers in the ULD-CT or SD-CT dataset were then available for the reader as reference on one screen of the two-screen setting of the workstation. Thus, only pulmonary nodule position and number, but not the segmentation result of the previous measurement, were provided by the software during the second reading at each dose level.
Statistical Analysis
Since we found that the distribution of errors did not follow the pattern of a normal distribution, we assessed interobserver correlation by using the Spearman correlation coefficient for nonnormally distributed populations. For intrascan and interscan analysis, we calculated the mean of two measurements by the same reader on the identical dataset and used the results for further analysis. Differences in volume measurements were calculated by subtracting the volume measured by reader 1 (R1) or on one scan, respectively, from the volume measured by reader 2 (R2) or on the other scan. Relative differences in volume percent were also calculated. These relative differences were plotted against the mean nodule volume by using the Bland and Altman approach. Limits of agreement were given as 95% confidence intervals.
The equality of the limits of agreement for the interobserver variabilities of the intrascan analysis was tested using a two-tailed F test.
Regarding the absolute results of volume measurements, a volume may be, alternatively, more intuitively described by means of its effective diameter (D), which is defined as the diameter of a volume equivalent sphere and was computed for all nodules.
Results
Twelve percent of all nodules had to be excluded from further analysis due to unacceptable segmentation results. In all excluded nodules, segmentation was unacceptable in ULD-CT as well as in SD-CT. All nodules excluded were in juxtapleural location or were found in a costodiaphragmatic recess with contact to the pleural surface.
The automatically displayed median diameter of the 202 included nodules on axial slices was 8.2 mm (mean diameter 11 mm) with a range of 3.2 to 44.5 mm. The median volume of all analyzed nodules in the SD-CT scans was 0.19 mL and ranged between 0.01 and 48 mL. Of all nodules, 90% were found to have volumes between 0.035 and 7.7 mL. The median effective nodule diameter was 7.1 mm (range 2.8 to 45.4 mm). Interobserver correlation was excellent with a Spearmen correlation coefficient of 0.99 for all combinations of readers and scans.
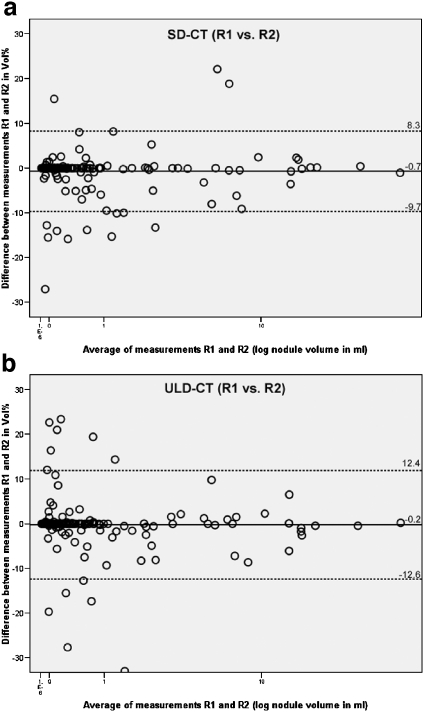
The relative differences of nodule volume for interobserver variability—R1 vs. R2—in the intrascan analysis were median 0%. The 95% confidence interval for relative differences in nodule volume in the intrascan analysis was measured with −9.7% to 8.3% (mean difference −0.7%) for SD-CT and with −12.6% to 12.4% (mean difference −0.2%) for ULD-CT. Absolute differences in volume ranged between −0.7 and +1.3 mL for SD-CT and between −0.9 and +0.9 mL for ULD-CT.
No statistical significance was found when comparing the limits of agreement in the intrascan analysis (F test > 0.05). Scatter plots illustrate interobserver variability of the intrascan analysis (Fig. 2).
Fig 2.
a The graph shows the interobserver agreement of volume measurements of 202 nodules at SD-CT. The relative differences between measurements of reader 1 and reader 2 are plotted against the mean nodule volume (logarithmic scale). The mean relative difference is shown by the continuous line; upper and lower limits of agreement are shown by the dashed lines. R1 reader 1, R2 reader 2. b The graph shows the interobserver agreement of volume measurements of 202 nodules at ULD-CT. The relative differences between measurements of reader 1 and reader 2 are plotted against the mean nodule volume (logarithmic scale). The mean relative difference is shown by the continuous line; upper and lower limits of agreement are shown by the dashed lines. R1 reader 1, R2 reader 2.
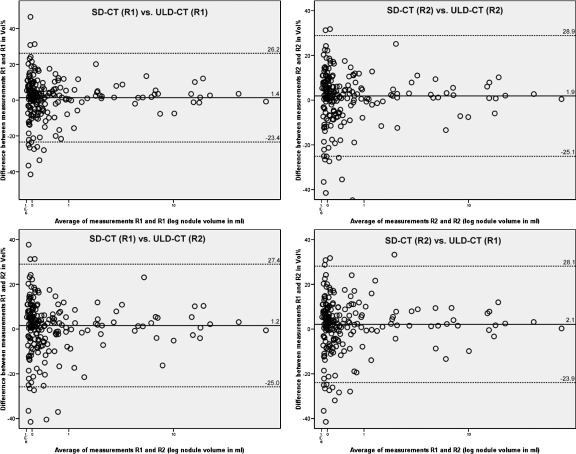
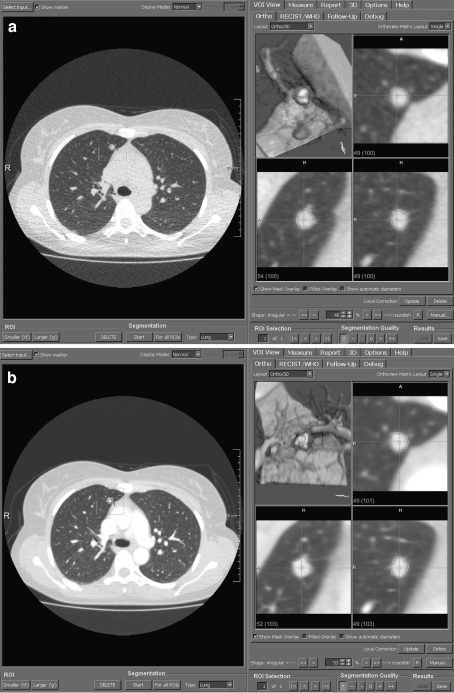
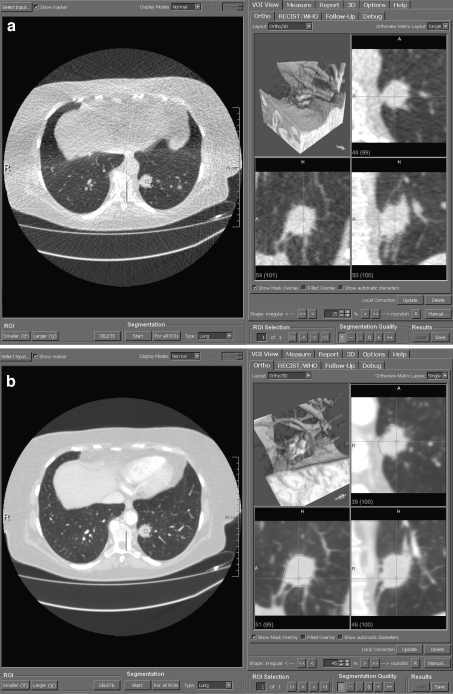
Variability of volume measurements was considerably greater for the interscan data (ULD-CT vs. SD-CT). Median interobserver and intraobserver variability of relative differences in volume measurements ranged between 1.9% and 2.4% vs. 0% in the intrascan analysis. The mean relative difference for volume measurements amounted to 1.4% with a 95% confidence interval of −23.4% to 26.2% comparing measurements of R1 at SD-CT vs. R1 at ULD-CT and to 1.9% with a 95% confidence interval of −25.1% to 28.9% comparing measurements of R2 at SD-CT vs. R2 at ULD-CT. The mean relative difference for volume measurements was recorded with 1.2% with a 95% confidence interval of −25.0% to 27.4% comparing measurements of R1 at SD-CT vs. R2 at ULD-CT and with 2.1% with a 95% confidence interval of −23.9% to 28.1% comparing measurements of R2 at SD-CT and R1 at ULD-CT. Absolute differences of nodule volume ranged between −1.3 and +2.1 mL. Interscan agreement of volume measurements is illustrated in Figure 3. Figures 4 and 5 show the representative volume measurements of identical nodules in ULD-CT and SD-CT.
Fig 3.
The graphs show the intraobserver and interobserver agreements of volume measurements of 202 nodules in the interscan analysis. The mean relative difference is shown by the continuous line; upper and lower limits of agreement are shown by the dashed lines. R1 reader 1, R2 reader 2.
Fig 4.
a Volume measurement of an intraparenchymal pulmonary nodule using the CT dataset acquired in ultralow-dose technique. The axial thin-slice section is displayed on the left and multiplanar reconstructions as well as volume rendering on the right. b Volume measurement of the identical pulmonary nodule using the CT dataset acquired in standard-dose technique.
Fig 5.
a Volume measurement of a more complex-shaped pulmonary nodule with pleural and vascular contact and spiculated margins in ULD-CT. The multiplanar reconstructions and volume-rendered image illustrate the segmentation result with successful separation of the nodule from the adjacent structures. b Corresponding images of the identical pulmonary nodule obtained with SD-CT.
Discussion
Linear measurement of pulmonary nodules on chest CT images is the common tool to determine nodule size for primary staging purposes or assessment of changes in follow-up CT. According to the Response Evaluation Criteria in Solid Tumors guidelines, the largest diameter is measured to determine the size of a pulmonary nodule or tumor. Since pulmonary nodules commonly do not present as perfectly spherical structures but are often lobulated and have spiculated margins, measurement of the long axis is necessarily subjective. Therefore, an observer-independent, reproducible, and accurate measurement tool is needed to diagnose progressive disease by detecting size increase on follow-up imaging. Wormanns et al. assessed interobserver variability of linear measurements of nodule sizes using CT images reconstructed with 3 and 5 mm slice thickness.19 They found an interobserver correlation of 0.91 and 0.89, respectively. Other studies investigating one- or two-dimensional nodule measurements also described a rather high variability in nodule size when one nodule was measured twice by the same observer or by different observers.20 Measuring 40 tumors unidimensionally or bidimensionally on CT scans, Erasmus et al. reported higher interobserver misclassification rates compared to intraobserver misclassification rates using either progressive disease or response criteria. Revel et al. recorded the maximum diameters of 54 solid pulmonary nodules.21 The authors concluded that linear measurements were not reliable for evaluating the size of uncalcified nodules. The 95% limits of agreement for the difference among readers were −1.73 and 1.73 mm with nodule sizes of 3–18 mm in their study.
The investigation of interobserver and interscan variability is likewise of highest importance for volume determination when assessing proportional changes in nodule size at follow-up. An increase in nodule diameter or interobserver variability of diameter measurements of 10% would correspond to a change in volume by a factor of about 3. Clinically relevant nodule growth might be an indication for an interventional procedure or alternative therapy. Phantom studies yielded excellent results for volume measurements in this context. Yankelevitz et al. assessed deformable and spherical nodules with diameters ranging from 3.9 to 11 mm.2 The resulting volumes of the silicone nodules after semiautomated segmentation matched the true volumes of the nodules as determined by fluid replacement with a small variance of ±3%. Phantom studies were also performed for detailed analysis of the effects of technical parameters on accurate nodule segmentation, e.g., image compression, reconstruction parameters, and nodule segmentation thresholds.6 In their study, Goo et al. found a strong impact of slice thickness and segmentation threshold on volume analysis.22 The dependency of volumetry on slice thickness was also assessed by a phantom study conducted by Winer-Muram et al. According to their results, thick-section reconstruction of chest CT led to overestimation of nodule volume.3
The findings of our intrascan analysis are comparable to the results of the most recent large study conducted by Gietema et al. In their study, screening CT datasets of 232 men with 430 nodules were analyzed with regard to interobserver variability. The authors found a high interobserver correlation and no differences in volume were seen for the majority of nodules. However, discrepant results were obtained for 47 nodules with a discrepancy of over 10% in 16 cases. The authors reported that the most frequent cause of variability was incomplete segmentation due to an irregular shape or irregular margins although nonsolid nodules, pleura-based nodules, and nodules attached to a vessel were excluded from this interobserver variability study. In contrast, and noteworthy to be mentioned in particular, we chose the CT datasets to represent the full spectrum of nodule shapes and sites encountered in clinical practice. Our CT datasets contained intraparenchymal nodules as well as nodules with contact to the pleural surface and vessels in all lung lobes. For that reason, the obtained results of the intrascan analysis can be considered to indicate good correlation compared to the previously published data.
The limits of agreement in the interscan analysis were observed up to three times higher than those of the intrascan analysis. Differences in volume measurements of pulmonary nodules on consecutive CT scans are attributed to several factors. These comprise alterations of the nodule itself and the surrounding lung parenchyma due to physiologic changes between the scans. A different phase within the cardiac cycle as well as changes in total lung volume may also affect volume measurements.23 Moreover, focal microatelectasis, different patient positioning, or different acquisition parameters affect measurements. Using a semiautomated segmentation software, Wormanns et al. analyzed 50 nodules with diameters ranging from 2 to 20 mm.15 They assessed intraobserver and interobserver variability on two consecutive CT scans obtained within 10 min on ten patients. They used 20 effective mAs for both CT scans. Automated volumetry yielded an interobserver variability of 0.5% (95% confidence interval of −3.0% to 1.4%). The results of our interscan analysis corresponded well to the data published by Wormanns et al. The authors described a noticeable increase between intrascan and interscan data with respect to interobserver variability, whereby the authors used the same radiation dose for both CT scans in their study; 95% limits of agreement were −20.4% to 21.9%. The increase in interobserver variability when analyzing respective nodule volumes on different scans is comparable to our findings and can be interpreted to indicate that the calculated volumes are independent of the radiation dose with which the CT datasets are acquired. An increase in intraobserver and interobserver variability when analyzing interscan data was also observed in a recent study by Goodman et al. The study evaluated a semiautomated segmentation software on 50 nodules with different morphologies and diameters of less than 20 mm. Volumes were evaluated on three consecutively obtained CT scans and segmentation results compared. The authors concluded that interscan variability in vivo is substantial with a standard deviation of the mean of 13.1% and wide confidence limits (95% confidence limit of ±25.6%). The three CT scans were acquired with rather high radiation doses of 200–400 mAs. The result of interscan variability comparable to our findings can be as well interpreted to indicate that the calculated volumes are independent of the radiation dose with which the CT datasets are acquired.
The acquisition dose of 75 mAs of the SD-CT scan at 120 kV is standard for a chest MSCT at our institution. The acquisition dose for a chest CT might vary between different institutions. The standard acquisition dose can be considered to be below average in comparison with other institutions. There are worldwide growing dose concerns especially with respect to CT as imaging modality. The radiological societies encourage the radiologist or institution, respectively, to acquire CT images resulting in the lowest exposure achievable without jeopardizing sufficient image quality for diagnosis. The dose level used in our study provided high-quality CT images in all patients examined. The term “standard-dose” CT was used for categorization purpose and might be misleading to use the specific mAs product as full-dose reference standard. The acquisition dose is a factor which influences the image quality and image noise of a CT study. However, besides the used mAs product, various factors have impact on image quality, in particular reconstruction algorithms and filters. There are differences in the image quality and resulting radiation exposure of chest CT protocols between different CT manufacturers. Das et al. studied in vitro the effect of different CT systems (single-row CT and different MSCT systems) on lung nodule segmentation.8 The resulting mean absolute percentage errors were reported to be comparable. The investigation of the effect of the substantial dose reduction on the results of our study should not be influenced by the rather low standard acquisition dose level of the SD-CT.
With the currently available software, segmentation was feasible in 88% of all nodules in our study. This result is in agreement with the rate of approximately 12% unsuccessful segmentations of nodules reported by Goodman et al. assessing 50 nodules.16 Volterrani et al. concluded that reproducibility of volume estimation in juxtapleural pulmonary nodules, particularly those adjacent to diaphragmatic pleura, was inadequate and software improvement needed.24 Analysis of the locations of the nodules excluded in our study suggests that the juxtapleural and, in particular, the juxtadiaphragmatic locations are most critical for segmentation.
The following limitations to our study had to be mentioned: Certainly, the retrospective nature of the analysis with preselection of CT datasets and the missing ground truth of nodule volumes in an in vivo study is a limitation. However, patient preselection was based on the inclusion criterion, the presence of pulmonary nodules. Nodule preselection due to its location as part of the methodology in previously published studies was not performed.
Due to the change of a parameter (mAs) of the CT scan acquisition, a “true” interscan variability could not be calculated. It has to be mentioned that the authors were aware of this fact and chose to refer to as interscan analysis to describe the results.
The administration of contrast agent in the SD-CT scans has to be mentioned as one major limitation of the study which might influence segmentation results. However, in a previous study, Goodman et al.16 could not observe a higher interobserver interscan variability measuring enhancing nodules. The administration of contrast material might, however, facilitate segmentation of nodules from parenchyma, except vessels, due to high contrast differences and could influence segmentation variability.
In conclusion, the interobserver variability of semiautomated volumetry of pulmonary nodules seems to be independent of the dose level with which the chest CT datasets used for analysis are acquired. Interobserver variability of volume measurements was higher in the interscan analysis. Interobserver variability of volume measurements in the intrascan analysis was in a comparable range for ULD-CT and SD-CT, thus nodule volumetry on CT datasets acquired with ultralow dose seems to be feasible.
References
- 1.Watanabe H, Yamamoto S, Kunitoh H, et al. Tumor response to chemotherapy: the validity and reproducibility of RECIST guidelines in NSCLC patients. Cancer Sci. 2003;94(11):1015–1020. doi: 10.1111/j.1349-7006.2003.tb01394.x. [DOI] [PMC free article] [PubMed] [Google Scholar]
- 2.Yankelevitz DF, Reeves AP, Kostis WJ, Zhao B, Henschke CI. Small pulmonary nodules: volumetrically determined growth rates based on CT evaluation. Radiology. 2000;217(1):251–256. doi: 10.1148/radiology.217.1.r00oc33251. [DOI] [PubMed] [Google Scholar]
- 3.Winer-Muram HT, Jennings SG, Meyer CA, et al. Effect of varying CT section width on volumetric measurement of lung tumors and application of compensatory equations. Radiology. 2003;229(1):184–194. doi: 10.1148/radiol.2291020859. [DOI] [PubMed] [Google Scholar]
- 4.Ko JP, Rusinek H, Jacobs EL, et al. Small pulmonary nodules: volume measurement at chest CT—phantom study. Radiology. 2003;228(3):864–870. doi: 10.1148/radiol.2283020059. [DOI] [PubMed] [Google Scholar]
- 5.Revel MP, Lefort C, Bissery A, Bienvenu M, Aycard L, Chatellier G, Frija G. Pulmonary nodules: preliminary experience with three-dimensional evaluation. Radiology. 2004;231(2):459–466. doi: 10.1148/radiol.2312030241. [DOI] [PubMed] [Google Scholar]
- 6.Ko JP, Chang J, Bomsztyk E, Babb JS, Naidich DP, Rusinek H. Effect of CT image compression on computer-assisted lung nodule volume measurement. Radiology. 2005;237(1):83–88. doi: 10.1148/radiol.2371041079. [DOI] [PMC free article] [PubMed] [Google Scholar]
- 7.Bolte H, Riedel C, Knoss N, et al. Computed tomography-based lung nodule volumetry—do optimized reconstructions of routine protocols achieve similar accuracy, reproducibility and interobserver variability to that of special volumetry protocols? Rofo. 2007;179(3):276–281. doi: 10.1055/s-2007-962929. [DOI] [PubMed] [Google Scholar]
- 8.Das M, Muhlenbruch G, Katoh M, et al. Automated volumetry of solid pulmonary nodules in a phantom: accuracy across different CT scanner technologies. Invest Radiol. 2007;42(5):297–302. doi: 10.1097/01.rli.0000258683.20123.c4. [DOI] [PubMed] [Google Scholar]
- 9.Bolte H, Jahnke T, Schafer FK, et al. Interobserver-variability of lung nodule volumetry considering different segmentation algorithms and observer training levels. Eur J Radiol. 2007;64(2):285–295. doi: 10.1016/j.ejrad.2007.02.031. [DOI] [PubMed] [Google Scholar]
- 10.Ravenel JG, Leue WM, Nietert PJ, et al. Pulmonary nodule volume: effects of reconstruction parameters on automated measurements—a phantom study. Radiology. 2008;247(2):400–408. doi: 10.1148/radiol.2472070868. [DOI] [PMC free article] [PubMed] [Google Scholar]
- 11.Larici AR, Storto ML, Torge M, et al. Automated volumetry of pulmonary nodules on multidetector CT: influence of slice thickness, reconstruction algorithm and tube current. Preliminary results. Radiol Med (Torino) 2008;113(1):29–42. doi: 10.1007/s11547-008-0231-3. [DOI] [PubMed] [Google Scholar]
- 12.Diederich S, Wormanns D, Semik M, et al. Screening for early lung cancer with low-dose spiral CT: prevalence in 817 asymptomatic smokers. Radiology. 2002;222:773–781. doi: 10.1148/radiol.2223010490. [DOI] [PubMed] [Google Scholar]
- 13.Swensen SJ, Jett JR, Hartman TE, et al. Lung cancer screening with CT: Mayo Clinic experience. Radiology. 2003;226:756–761. doi: 10.1148/radiol.2263020036. [DOI] [PubMed] [Google Scholar]
- 14.Gietema HA, Wang Y, Xu D, et al. Pulmonary nodules detected at lung cancer screening: interobserver variability of semiautomated volume measurements. Radiology. 2006;241(1):251–257. doi: 10.1148/radiol.2411050860. [DOI] [PubMed] [Google Scholar]
- 15.Wormanns D, Kohl G, Klotz E, et al. Volumetric measurements of pulmonary nodules at multi-row detector CT: in vivo reproducibility. Eur Radiol. 2004;14(1):86–92. doi: 10.1007/s00330-003-2132-0. [DOI] [PubMed] [Google Scholar]
- 16.Goodman LR, Gulsun M, Washington L, Nagy PG, Piacsek KL. Inherent variability of CT lung nodule measurements in vivo using semiautomated volumetric measurements. AJR Am J Roentgenol. 2006;186(4):989–994. doi: 10.2214/AJR.04.1821. [DOI] [PubMed] [Google Scholar]
- 17.Bornemann L, Kuhnigk JM, Dicken V, et al. Informatics in radiology (infoRAD): new tools for computer assistance in thoracic CT part 2. Therapy monitoring of pulmonary metastases. Radiographics. 2005;25(3):841–848. doi: 10.1148/rg.253045163. [DOI] [PubMed] [Google Scholar]
- 18.Kuhnigk JM, Dicken V, Bornemann L, et al. Fast automated segmentation and reproducible volumetry of pulmonary metastases in CT-scans for therapy monitoring. IEEE Trans Med Imaging. 2006;25(4):417–434. doi: 10.1109/TMI.2006.871547. [DOI] [PubMed] [Google Scholar]
- 19.Wormanns D, Diederich S, Lentschig MG, Winter F, Heindel W. Spiral CT of pulmonary nodules: interobserver variation in assessment of lesion size. Eur Radiol. 2000;10(5):710–713. doi: 10.1007/s003300050990. [DOI] [PubMed] [Google Scholar]
- 20.Erasmus JJ, Gladish GW, Broemeling L, et al. Interobserver and intraobserver variability in measurement of non-small-cell carcinoma lung lesions: implications for assessment of tumor response. J Clin Oncol. 2003;21(13):2574–2582. doi: 10.1200/JCO.2003.01.144. [DOI] [PubMed] [Google Scholar]
- 21.Revel MP, Bissery A, Bienvenu M, Aycard L, Lefort C, Frija G. Are two-dimensional CT measurements of small noncalcified pulmonary nodules reliable? Radiology. 2004;231(2):453–458. doi: 10.1148/radiol.2312030167. [DOI] [PubMed] [Google Scholar]
- 22.Goo JM, Tongdee T, Tongdee R, Yeo K, Hildebolt CF, Bae KT. Volumetric measurement of synthetic lung nodules with multi-detector row CT: effect of various image reconstruction parameters and segmentation thresholds on measurement accuracy. Radiology. 2005;235(3):850–856. doi: 10.1148/radiol.2353040737. [DOI] [PubMed] [Google Scholar]
- 23.Boll DT, Gilkeson RC, Fleiter TR, Blackham KA, Duerk JL, Lewin JS. Volumetric assessment of pulmonary nodules with ECG-gated MDCT. AJR Am J Roentgenol. 2004;183(5):1217–1223. doi: 10.2214/ajr.183.5.1831217. [DOI] [PubMed] [Google Scholar]
- 24.Volterrani L, Mazzei MA, Scialpi M, et al. Three-dimensional analysis of pulmonary nodules by MSCT with Advanced Lung Analysis (ALA1) software. Radiol Med (Torino) 2006;111(3):343–354. doi: 10.1007/s11547-006-0033-4. [DOI] [PubMed] [Google Scholar]


