Abstract
In this paper, a fast, slice-by-slice, nonrigid registration algorithm of dynamic magnetic resonance breast images is presented. The method is based on a multiresolution motion estimation of the breast using complex discrete wavelet transform (CDWT): the pyramid of oriented complex subimages is used to implement a hierarchical phase-matching-based motion estimation algorithm. The resulting motion estimate is nonrigid and pixel-independent. To assess the method performance, we computed the correlation coefficient and the normalized mutual information between pre- and postcontrast images with and without realignment. The indices increased after using our approach and the improvement was superior to rigid or affine registration. A set of clinical scores was also evaluated. The clinical validation demonstrated an increased readability in the subtraction images. In particular, CDWT registration allowed a best definition of breast and lesion borders and greater detail detectability.
Key words: Breast, magnetic resonance, contrast agent, registration algorithm, nonrigid, wavelet transform
INTRODUCTION
In the past few years, dynamic contrast-enhanced magnetic resonance imaging (MRI) has gained attention in the early diagnosis of breast malignancies and its differentiation from other breast diseases.1,2 In a typical examination, a patient is scanned prior to and immediately after the intravenous injection of the contrast agent [Gadolinium-diethylenetriamine pentaacetic acid (DTPA)].3–5 Postcontrast scans are performed repeatedly and the resulting MR image consists of a set of images of parallel tissue slices. The evaluation of the contrast agent uptake curves, estimated from the difference between pre- and postcontrast images,1,2 may improve the discrimination between malignant and benign lesions.
However, during MR dynamic acquisitions (which usually last a few minutes), any motion by the patient, even mere respiration activity, may induce changes in the shape of the breast and misalignment between precontrast and postcontrast volumes. Volumes matching is usually required to improve accuracy and efficiency of lesion detection,1–5 and motion-correction algorithms must take into account that: (1) breast tissues may deform in a nonrigid way and (2) voxel intensity and contrast may change between precontrast and postcontrast scans.
Several registration methods have been proposed in the literature for solving the specific problem of breast MRI registration6–13 using rigid and nonrigid transformations, as well as different figures of merit. Voxel-based algorithms carry out alignment by the calculation of similarity measures, such as joint entropy, mutual information (MI), and normalized mutual information (NMI), which are independent from pixel intensity. However, these algorithms are usually limited to rigid or affine transformation.6 Conversely, a nonrigid registration algorithm based on elastic deformation using physical models7 assumes that the intensity of tissue between images remains constant. An attempt to realize a nonrigid transformation taking into account pixel intensity variation was proposed by Hayton et al.,8 who introduced a pharmacokinetic model to describe changes in pixel values. However, the need to select the model of the different tissues and lesions may limit the performance of the method. A different solution was proposed by Rueckert et al.,10 and later, by Rohlfing and Maurer.11 The authors obtained a nonrigid registration by combining an affine transformation for the global motion of the breast and a free-form deformation based on B-splines for the local breast motion. The method iteratively minimizes a cost function, which represents a combination of the cost associated with the smoothness of the transformation and a measure of similarity (NMI). Finally, an approach including automatic feature extraction and realignment based on corresponding features between pre- and postcontrast images was proposed.12 In the work by Denton et al.,13 the superiority of a nonrigid registration method with respect to rigid or affine ones was demonstrated. However, these last methods, although very attractive, are iterative and often very time consuming for a direct clinical application.
Fleet et al.14 introduced the advantages of using phase-based approaches for solving the general problem of stereo images matching. Phase-based motion estimation algorithms utilize the Fourier shift theorem, which relates shifts in spatial domain to phase rotation in the frequency domain.14 The performance of this algorithm has been successively improved by Magarey and Kingsbury15 using a multiresolution hierarchical structure based on complex discrete wavelet transform (CDWT) and Gabor-like basis. In the work by Magarey and Kingsbury,15 both computational complexity and noise sensitivity have been reduced. The algorithm is fully automatic and very fast.
In this paper, the algorithm proposed by Magarey and Kingsbury15 has been applied to the slice-by-slice registration of MRI-breast images. Accuracy and performance of the algorithm will be addressed in relation to the specific problem using both quantitative indices and clinical score.
MATERIALS AND METHOD
The Registration Algorithm
In this section, the algorithm proposed by Magarey and Kingsbury15 for solving the problem of estimating motion in video image sequences is briefly introduced. Only the features relevant to MR image registration will be addressed here. A detailed theoretical description can be found elsewhere.15,16 The method can be divided in two steps: (1) decomposition of the original image and (2) estimation of the motion field (MF) at different scales, as shown in Figure 1.
Fig 1.
The registration algorithm.
CDWT Decomposition
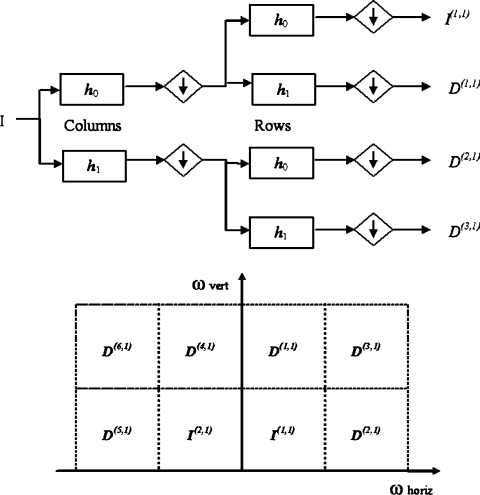
The algorithm is based on a multiresolution survey obtained by a CDWT decomposition.15 The DWT has been largely proposed in literature as an efficient tool for multiresolution analysis because it is possible to implement it as a bank of filters. The decomposition is obtained at different scales, m, by repeated applications of a simple processing block (Fig. 2, top), in which 1-dimensional convolutions with filter basis pair, performed both along the columns and rows, is followed by downsampling. Even-length finite impulse response (FIR) filters are used with approximate Gabor form
 |
1 |
 |
2 |
Fig 2.
Two-dimensional DWT processing block (top). The image (I) is filtered low-pass and high-pass by h0 and h1, respectively, and then down-sampled. This operation is firstly applied for columns and then for rows. I(1,1) represents the input for the next decomposition level. CDWT outputs in frequency domain at level 1 (bottom). I(1,1) and I(2,1) are the low-resolution output images, whereas {D(n,1), n=1,...,6} are the subband images oriented in the six directions defined by Wavelet filters.
where n = −D,...,D−1 and a0, a1, σ0, σ1, ω0 and ω1 are the filter parameters. Gabor-like filters are used because they are optimally localized in both spatial and spatial frequency domains.
At a given scale m along the decomposition, a set of details, D(n,m), and a coarse approximation, I(n,m), of the original image I are obtained. With respect to the original image, it is equivalent to apply the following linear filters
 |
3 |
 |
4 |
where n is the spatial coordinate; I(n) is the original image; and ψ(n) and ϕ(n) are, respectively, the wavelet and the scaling filters, and their parameters are closely related to those of h0 and h1. It can be shown that ψ(n) and ϕ(n) are also Gabor-like
 |
5 |
 |
6 |
In the spatial frequency domain, the central frequency Ωn,m specifies the orientation of each filter, ie, a direction in the spatial plane where contours are mainly enhanced.
When observed in the frequency domain, these spatial filters can cover only the first quadrant (see Fig. 2, bottom), whereas the negative part of the spectrum is neglected. However, for a detailed image analysis, both the first and second quadrants contain nonredundant information and cannot be excluded (conversely, the third and fourth quadrants are conjugated versions of the first two). For this reason, the conjugated filters of h0 and h1 have been considered. Conjugating h0 and h1 reflects their frequency responses at ω = 0. An extension of the decomposing path of Figure 2 (top), in which a parallel path is added, is considered; the parallel path uses the same 2-dimensional building block except that the row filtering is performed using  and
and  instead of h0 and h1.
In conclusion, at each level m, there are eight complex outputs, two (I(1,m), I(2,m)) are images at lesser resolution that correspond to inputs at the next level m + 1; the other six subimages {D(n,m), n = 1,...,6} may be regarded as the (down-sampled) output of an equivalent wavelet filter, which has 2-dimensional Gabor form. Each wavelet filter, and its corresponding subimage, has a characteristic orientation specified by the spatial frequency Ωn,m. Their orientation can be evenly spaced in the range [−π/2, π/2] by a careful selection of h0 and h1.
Motion Estimation
At each level m, an estimation of the MF f is obtained by minimizing, for each subpixel n, the following quantity:
 |
7 |
where  and
and  are the detail CDWT coefficients at scale m, as obtained from the decomposition of images I1 and I2, respectively, and where P(n,m) is the energy of each wavelet filter. The quantity 7 is known as subband squared difference (SSD).15 The SSD is analogous to the squared pixel difference computed in the intensity domain;16 however, details rather than intensities are used and all information contained in the six subbands are combined. The SSD is independent from any offset or scaling between I1 and I2 intensites.16 In addition, it can be demonstrated15 that Eq. 7 it is a maximum likelihood estimator of the MF f.
This approach is particularly attractive thanks to the property of interpolability of the subimages  , which allows to rewrite expression 7 as a 2-dimensional quadratic surface with elliptical contours:
 |
8 |
where f0 is the minimum location, κ is the curvature matrix, and δ is the minimum height of the surface. Surface parameters {f0, κ, δ} may be computed directly from the coefficients  , and
, and  from the spatial frequency Ωn,m.15 They are obtained for each subpixel n at level m of each image.
For our purposes, two parameters are of interest: f0 and κ. f0 represents the desired displacement for the subpixel n. The values f0 of all the subpixels form the nonrigid MF at level m. The curvature matrix κ also plays an important role as measure of confidence in the estimate. In fact, it may be shown that the curvature of the surface in a given direction indicates the confidence of the estimate f0 in that direction. A scalar confidence measure is obtained from κ for each subpixel. In this way, the unreliable estimates can be removed, so that they cannot influence subsequent processing and the global minimum, rather than a local minimum, can be found.
Equation 8 provides a very efficient way of computing f0 over a real interval of values, avoiding an extensive, time-consuming search over a discrete set of candidates. The registration procedure starts at the coarsest level (m = mmax) of the CDWT decomposition and continues up to the finest level mmin. The result of the m-level estimator is a coarse approximation of the MF. The estimate may be refined by including information contained at finer scales according to a coarse-to-fine strategy. In this regard, motion estimates and the other surface parameters are propagated to the next finer level (m = mmax−1). First, parameters are scaled and interpolated (bilinear interpolation is used) to obtain the right number of samples:
 |
9 |
and the interpolated field of level m surfaces is denoted by SSD′(m). Next, the SSD(m−1) is computed as described in the previous section. The latter is then added (using a weighting factor ξ) to the coarser ones, thus producing a new surface: the cumulative squared difference (CSDm+1) surface
 |
10 |
The cumulative combination of surfaces makes it possible to incorporate information from every level of detail in the estimated MF. In addition, maintaining prior information from lower levels guides us towards a unique minimum in regions affected by aperture problems. The procedure is iterated until a desired level of detail (mmin) is reached.
Algorithm performances depend on some project parameters, eg, the maximum and minimum decomposition levels, mmin and mmax, and the type of interpolation used for the coarse-to-fine propagation of the estimate. The choice of the optimal parameters is influenced by the characteristics of the images to be realigned. To optimize the parameters for breast MR images, we performed simulations based on the application of a known a priori MF. The values that minimized the error in the estimate were selected. In particular, we used an eight-sample Gabor filter, FIR interpolating kernel (windowed sinc), and mmin = 2, mmax = 6.
Patient Data
Fifteen 3-dimensional contrast-enhanced (Gd-DTPA) MRI examinations were considered for this study. Data were acquired using a 3-dimensional FLASH sequence with time to repeat = 8.1 ms, time to echo = 4 ms, flip angle = 20°, acquisition time = 67 s, field of view = 320 mm, 192 × 256 matrix, and axial slice orientation. The MR images were acquired on a 1.5-T system (Siemens Vision, Erlangen, Germany). A sequence of six scans was acquired. Every scan acquired a volume of 50 slices, resulting in a slice thickness < 3 mm. After a basal (precontrast) scan, five postcontrast scans were acquired 67 s after Gd-DTPA injection (patients received 0.1 mmol/kg). The examinations were selected a posteriori among patients acquisitions routinely performed at the Department of Images for Diagnosis and Therapy of the National Cancer Institute of Milan. Patients’ ages ranged from 37 to 67 years (median 45). All the selected studies have been classified by radiologists as affected by consistent patient motion ( ≥ 5 mm) between precontrast and postcontrast volumes. Misalignment was identified by presence of rim artifacts and areas of false enhancement on subtraction images.
Method Evaluation
To test the performance of the proposed registration method, we used both quantitative numerical indices and qualitative clinical scores. As in the work by Denton et al.,13 the new approach was compared with two techniques based on rigid registration and affine transformation, respectively. Two quantitative indices were computed: MI and correlation coefficient (CC). They are used as similarity measures between the precontrast image I1 and the postcontrast image I2 correct for the MF (namely, T(I2), where T(.) is the estimated transform).
MI has been largely proposed as an index of similarity between images.6 Maximization of MI has also been proposed as a criterion for aligning MR and multimodality images.8 In this paper, we used the NMI index8
 |
11 |
to verify the efficiency of the realignment procedure. In Eq. 7, H(I1) and H(T(I2)) are the entropy of the image I1 and T(I2), respectively, and H(I1,T(I2)) is their joint entropy.
The CC was computed as
 |
12 |
where  and
and  are the average intensities of
  and
and  .
.
Concerning the clinical evaluation of the registration procedure, two expert radiologists were asked to score the subtraction images after realignment. Subtraction images were obtained between the precontrast and the first (and the fourth) postcontrast volume. The clinicians compared the subtraction images obtained without registration with those obtained by affine registration and by our method (CDWT registration). Rigid registration was not included in clinical evaluation. The following properties of the image were evaluated: (a) small structure (lesions and vessels) detectability, (b) definition of breast borders and structures, (c) definition lesion borders, and (d) diagnostic usability of the images. Each property was scored from 0 to 5, with 5 corresponded to top quality.
RESULTS
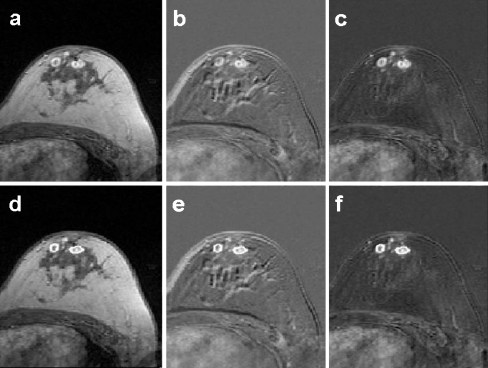
Figures 3, 4, and 5 show some examples of the algorithm outcomes. In Figure 3, a postcontrast image (Fig. 3a), the correspondent nonregistered subtraction image (Fig. 3b), and the registered subtraction image (Fig. 3c) are shown, where there are two significant left-breast multifocal lesions. A contour of lesions is delineated in the postcontrast image (Fig. 3d), and the same contour is put on both non-registered (Fig. 3d) and registered (Fig. 3e) subtraction images. The subtraction puts emphasis on lesions, but, as demonstrated by contours, the algorithm preserve even volume and shape of lesions.
Fig 3.
Post-contrast image (a) and the correspondent non-registered (b) and registered (c) images. In (d), (e) and (f) the same images in which the same contour around the two significant lesions is put.
Fig 4.
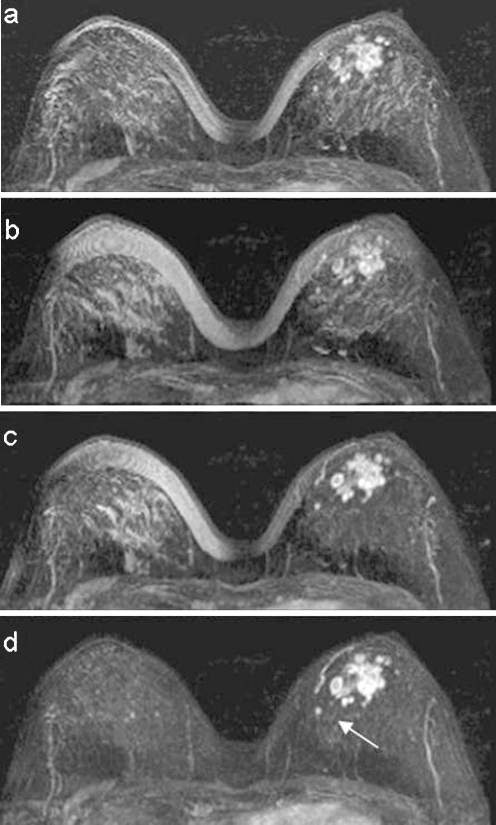
A case of multicentric lesion in the left breast. Maximum-intensity projection reconstruction of the images difference after a no registration, b rigid registration, c affine registration, and d wavelet registration. The arrow shows a small medial lesion in the left breast.
Fig 5.
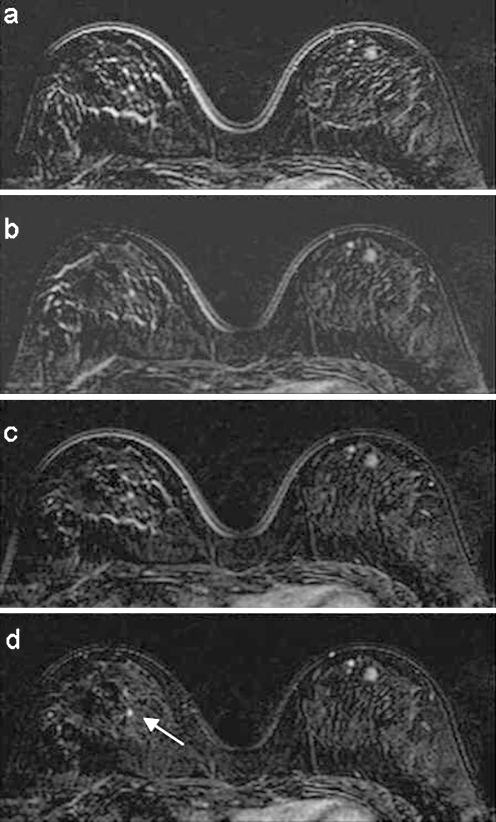
Subtraction between precontrast and postcontrast images in a cranial position: a no registration, b rigid registration, c affine registration, and d wavelet registration. In d, the cluster of lesion is better detectable. The right breast is also present to show the small controlateral lesion (arrow) detectable in d.
Figure 4 shows a case with several contrast-enhanced lesions, caused by left-breast multicentric carcinoma in retroareolar region. A comparison of maximum-intensity projection reconstruction of subtraction image after no registration (Fig. 4a), rigid registration (Fig. 4b), affine registration (Fig. 4c), and wavelet registration (Fig. 4d) is presented. The comparison shows as the presence of several artifacts avoids the identification of the vascular structures in the left-breast internal region (Fig. 4a,b). In Figure 4c, vessel detection is recovered and contrast-enhanced lesions are more clearly defined. The best performance is realized by CDWT method (Fig. 4d); a small medial lesion (arrow) is also detectable.
In Figure 5a, the punctual uptake to the right in the internal breast region is hidden by rim artifacts of the breast glandular tissue structures. The artifact reduction in Figure 5b,c improves the lesion detectability even if border effect at the cutaneous profile remains. In Figure 5d, thanks to the CDWT registration, lesions to the left breast are better visible (open arrow) and, in addition, it is worth noting that a small controlateral lesion (in the right breast) is also detectable (arrow).
Table 1 summarizes the results of the registration quality methods in terms of NMI and CC for the different types of transformation. All the measured indices show an improvement after registration: the best performance was obtained by the use of the CDWT. It is worth noting that the improvement obtained by CDWT algorithm is significantly different in respect to all the other methods.
Table 1.
Normalized Mutual Information and CC of the Patient Studies After Different Types of Registration (Mean ± Standard Deviation)
| NR | RR | AR | WR | |
|---|---|---|---|---|
| NMI | 0.379 ± 0.057* | 0.391 ± 0.050* | 0.400 ± 0.053* | 0.417 ± 0.050 |
| CC | 0.945 ± 0.025* | 0.954 ± 0.020* | 0.956 ± 0.020* | 0.965 ± 0.015 |
NR = no registration, RR = rigid registration, AR = affine registration, WR = wavelet registration
*P < 0.001
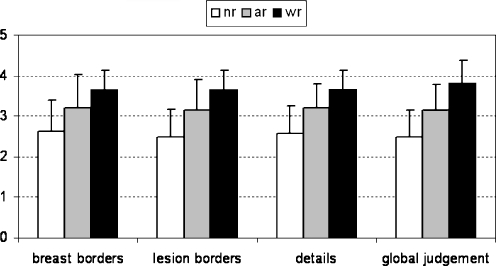
Results of clinical evaluation are summarized in Figure 5. The mean clinical score was higher using CDWT algorithm for all the analyzed features. In particular, comparing affine and CDWT registration, we have an improvement in lesion borders (affine registration vs CDWT: 3.1 ± 0.8 vs 3.6 ± 0.5 P < 0.001, paired t test), details (3.2 ± 0.6 vs 3.6 ± 0.5, P < 0.05, paired t test), and breast borders (3.2 ± 0.8 vs 3.6 ± 0.4, P < 0.1, NS). Scores obtained by CDWT registration were always superior or equal to affine transformation for all the clinical aspects. In only two cases affine transformation have a better score than CDWT. As a consequence, the score for the global clinical judgement was always better or equal using CDWT. In one patient (study 3), CDWT reached the maximum score.
DISCUSSION AND CONCLUSION
In this paper, a new method for a 2-dimensional registration of pre- and postcontrast breast images has been proposed and validated. The correct MF is obtained by a multiresolution algorithm based on CDWT image decomposition. We evaluated the algorithm with respect to both rigid and affine registration approaches as in the work by Denton et al.,13 and we verified its performances using numerical indices and clinical scores. The proposed approach had the best performances: NMI and CC indices were significantly higher using the CDWT method with respect to rigid and affine registration. These results are also confirmed by clinical scores (Fig. 6).
Fig 6.
Performances of wavelet registration (wr) with respect to no registration (nr) and affine registration (ar). The graph represents the mean values of the clinical score for the different clinical aspects (standard deviation bars are superimposed).
Because the goal we want to achieve is the method applicability for clinical tasks, in the current version, the method is limited to a slice-by-slice registration. Even if 3-dimensional registration has been proposed for breast volume, the use of 2-dimensional registration is not a limiting factor for this kind of application;12 in fact, in clinical practice, the slice thickness of the transversal image is much greater than the within-plane resolution (ie, pixel width), so that the partial volume effects make displacements in the axial direction harder to detect. In addition, taking into account the prone position on the breast coil, movements of the patient are more likely to occur in the transversal plane only, and, finally, changes in the shape of the breast due to gravitation occur parallel to the image plane.
There are peculiar properties that make the proposed algorithm particularly appealing for the registration of MR breast images: the registration is (1) nonrigid, (2) pixel-independent, and (3) computationally efficient. The use of a nonrigid registration has been suggested for breast’s soft tissue,7–12 but only a few algorithms take into account the fact that pre- and postcontrast images have different pixel intensities due to the injection of contrast agent.8–12 With respect to those works, in our approach, the nonrigid matching is easily obtained thanks to the coarse-to-fine strategy, and it does not need a combination of different registration techniques for global and local realignment.10,11 Furthermore, the estimation of the MF is not restricted to a predefined finite set of values,12 nor does a definition of a pharmacokinetic model.8 In addition, it is worth noting that, in our method, a regularization of the MF can be easily performed at each level of decomposition using a confidence filtering.16
A second requirement for realignment of breast images is pixel independence: MI has been largely proposed as the optimum similarity measure in images,6 and it has already been used for breast image analysis.10,11 In our approach, an extension of SSD is used as a similarity measure. The SSD is computed on the image details rather than pixel values; thus, the solution is independent from scaling and shifts in the gray levels of the pre- and postcontrast images. Although the algorithm does not maximize MI directly, we observed (Results) an increase of MI using CDWT registration with respect to rigid and affine method, in demonstration of the algorithm robustness.
Most of the algorithms10,11 use an iterative search to find the MF. The limit is the computational efficiency and problem of local minimum. In our approach, thanks to the fact that the figure of merit can be expressed as a quadratic surface with elliptical contours, the MF can be computed by simple arithmetic operations. In addition, because the MF estimation is obtained by a coarse-to-fine strategy,16 the algorithm is likely to fast converge to the minimum. Thus, the algorithm is highly efficient from a computational point of view: in our Matlab® implementation, which is totally automatic, the registration of two breast volumes (50 slices) takes, on average, less than 1 min, running on PC.
In conclusion, the proposed approach, even if it is not 3-dimensional, provides better performance than rigid and affine ones; it increases the MI between pre- and postcontrast images and, from a clinical viewpoint, it improves images readability. In addition, this performance is obtained by a full automatic, low-computational algorithm.
References
- 1.Irwig L, Houssami N, Vliet C. New technologies in screening for breast cancer: a systematic review of their accuracy. Br J Cancer. 2004;90(11):2118–2122. doi: 10.1038/sj.bjc.6601836. [DOI] [PMC free article] [PubMed] [Google Scholar]
- 2.Tardivon A, Khoury C, Thibault F, Meunier M. New developments in breast imaging. Cancer Radiother. 2004;8(1):2–8. doi: 10.1016/j.canrad.2003.10.003. [DOI] [PubMed] [Google Scholar]
- 3.Hulka CA, Smith BL, Sgroi DC, Tan L, Edmister WB, Semple JP, Campbell T, Kopans DB, Brady TJ, Weisskoff RM. Benign and malignant breast lesions: differentiation with echo-planar MR imaging. Radiology. 1995;197:33–38. doi: 10.1148/radiology.197.1.7568850. [DOI] [PubMed] [Google Scholar]
- 4.Stack JP, Redmond OM, Codd MB, Dervan PA, Ennis JT. Breast disease: tissue characterization with Gd-DTPA enhancement profiles. Radiology. 1990;174:491–494. doi: 10.1148/radiology.174.2.2296657. [DOI] [PubMed] [Google Scholar]
- 5.Kenney PJ, Sobol WT, Smith JK, Morgan DE. Computed model of gadolinium enhanced MRI of breast disease. Eur J Radiol. 1997;24:109–119. doi: 10.1016/S0720-048X(96)01141-2. [DOI] [PubMed] [Google Scholar]
- 6.Pluim JPW, Maintz JBA, Viergever MA. Mutual information based registration of medical images: a survey. IEEE Trans Med Imaging. 2003;22(8):986–1004. doi: 10.1109/TMI.2003.815867. [DOI] [PubMed] [Google Scholar]
- 7.Davis MH, Khotanzad A, Flamig DP, Harms SE. A physic-based coordinate transformation for 3-D image matching. IEEE Trans Med Imaging. 1997;16(3):317–328. doi: 10.1109/42.585766. [DOI] [PubMed] [Google Scholar]
- 8.Hayton PM, et al. Analysis of dynamic breast images using a model of contrast enhancement. Med Image Anal. 1997;1(3):207–224. doi: 10.1016/S1361-8415(97)85011-6. [DOI] [PubMed] [Google Scholar]
- 9.Hayton PM, Brady M, Tarassenko L, Moore N. A non-rigid registration algorithm for dynamic breast MR images. Artif Intell. 1999;114:125–156. doi: 10.1016/S0004-3702(99)00073-9. [DOI] [Google Scholar]
- 10.Rueckert D, Sonoda LI, Hayes C, Hill DLG, Leach MO, Hawkes DJ. Nonrigid registration using free-form deformation: application to breast MR images. IEEE Trans Med Imaging. 1999;18:712–721. doi: 10.1109/42.796284. [DOI] [PubMed] [Google Scholar]
- 11.Rohlfing T, Maurer CR., Jr Volume-preserving nonrigid registration of MR breast images using free-form deformation with an incompressibility constraint. IEEE Trans Med Imaging. 2003;22(6):730–741. doi: 10.1109/TMI.2003.814791. [DOI] [PubMed] [Google Scholar]
- 12.Lucht R, Knopp MV, Brix G. Elastic matching of dynamic MR mammographic images. Magn Reson Med. 2000;43:9–16. doi: 10.1002/(SICI)1522-2594(200001)43:1<9::AID-MRM2>3.0.CO;2-C. [DOI] [PubMed] [Google Scholar]
- 13.Denton ERE, Sonoda LI, Rueckert D, Rankin SC, Hayes C, Leach MO, Hill DLG, Hawkes DJ. Comparison and evaluation of rigid, affine, and nonrigid registration of breast MR images. J Comput Assist Tomogr. 1999;23(5):800–805. doi: 10.1097/00004728-199909000-00031. [DOI] [PubMed] [Google Scholar]
- 14.Fleet D, Jepson A, Jenkin M. Phase-based disparity measurement. Computer vision, graphics, and image processing. Image Understanding. 1991;53(2):198–210. doi: 10.1016/1049-9660(91)90027-M. [DOI] [Google Scholar]
- 15.Magarey J, Kingsbury N. Motion estimation using a complex-valued wavelet transform. IEEE Trans Signal Process. 1998;46(4):1069–1084. doi: 10.1109/78.668557. [DOI] [Google Scholar]
- 16.Magarey J: Motion estimation using complex wavelets. Ph.D. thesis, University of Cambridge, 1997


