Abstract
Purpose: The purpose of the study was to evaluate the usefulness of power law spectral analysis on mammographic parenchymal patterns in breast cancer risk assessment. Materials and Methods: Mammograms from 172 subjects (30 women with the BRCA1/BRCA2 gene mutation and 142 low-risk women) were retrospectively collected and digitized. Because age is a very important risk factor, 60 low-risk women were randomly selected from the 142 low-risk subjects and were age matched to the 30 gene mutation carriers. Regions of interest were manually selected from the central breast region behind the nipple of these digitized mammograms and subsequently used in power spectral analysis. The power law spectrum of the form  was evaluated for the mammographic patterns. The performance of exponent β as a decision variable for differentiating between gene mutation carriers and low-risk women was assessed using receiver operating characteristic analysis for both the entire database and the age-matched subset. Results: Power spectral analysis of mammograms demonstrated a statistically significant difference between the 30 BRCA1/BRCA2 gene mutation carriers and the 142 low risk women with an average β values of 2.92 (±0.28) and 2.47(±0.20), respectively. An Az value of 0.90 was achieved in distinguishing between gene mutation carriers and low-risk women in the entire database, with an Az value of 0.89 being achieved on the age-matched subset. Conclusions: The BRCA1/BRCA2 gene mutation carriers and low-risk women have different mammographic parenchymal patterns. It is expected that women identified as high risk by computerized feature analyses might potentially be more aggressively screened for breast cancer.
Key words: Mammographic parenchymal patterns, computerized texture analysis, image analysis, breast cancer risk, power spectral analysis
Introduction
Mammography is a valuable tool for the early detection of breast cancer1,2 and has been regularly used for breast cancer screening. An estimated 178,480 new cases of invasive breast cancer are expected to occur among women in the USA in 2007.3 Many factors increase a woman’s risk of developing breast cancer,4,5 with the inherited susceptibility genes, most notably BRCA1 and BRCA2, accounting for approximately 5–10% of all cancer cases. Approximately 50% of these gene mutation carriers will develop breast cancer by the age of 50 years.6–9 Therefore, a woman at high risk of developing breast cancer is expected to benefit from close surveillance and aggressive screening for breast cancer.
Mammographic parenchymal patterns have been studied extensively10–25 to demonstrate the relationship between breast density and the risk of developing breast cancer. Wolfe10 described the mammographic parenchymal patterns with four categories (N1, P1, P2, and DY) based on the radiographic appearance of prominent ducts and dysplasia. Visual estimation of the percentage of fibroglandular tissue on the mammogram as breast density has also been used to characterize the breast parenchymal patterns.12,13 Quantitative breast density estimation and mammographic pattern characterization based on computerized texture analyses14–25 have been also investigated using digitized mammograms. Numerous studies13,18–20 have shown that increased mammographic breast density yields as high as a five- to sixfold increase in risk of developing breast cancer.
In our earlier studies,21,22 regions of interest (ROIs) were selected from the central breast region behind the nipple, and then computerized radiographic features were extracted from the ROIs to characterize both breast density and the parenchymal texture patterns of the breast. Our results showed that women at high risk of developing breast cancer tended to have dense breasts with mammographic patterns that were coarse and low in contrast. Our results also suggested that there was a statistically significant decrease in the performance of the computerized texture features in the task of distinguishing between high-risk and low-risk women groups, as the ROI location was varied from the central region behind the nipple.23
Power law spectrum of the form  has recently been shown by Burgess et al. to be related to the background parenchymal pattern of breast structure on mammography.26,27 Thus, in our current study, we investigate such power law spectral analysis on the digitized mammograms of two groups of women—BRCA1/BRCA2 gene mutation carriers and low-risk women. Power spectral analyses were performed on selected ROIs, and the performance of the individual image β value, as the decision variable in the task of differentiating between BRCA1/BRCA2 gene- mutation carriers and low-risk women, was evaluated using receiver operating characteristic (ROC) analyses.28,29
Materials and Methods
Database
The cases used in this study are summarized here and have been described in detail elsewhere.22 Women with known BRCA1 and BRCA2 gene mutations were recruited from the Cancer Risk Clinic at the University of Chicago and the University of Pennsylvania Cancer Center where genetic counseling is available for women at high risk of developing breast cancer. The gene mutation carriers were tested at the Clinical Laboratory Improvement Amendments-approved laboratories under the institution review board-approved protocols at both institutions. For women known to have breast cancer, we only used mammograms that were obtained before the cancer diagnosis. These prior mammograms were reviewed by an expert mammographer and were included only if they were free of any detectable abnormalities. The 30 BRCA1 and BRCA2 gene mutation carriers had ages 33 to 55 years, with a mean age of 42.7 years.
The mammograms of 142 low-risk women from the screening mammography program at the University of Chicago Hospitals were also obtained. These mammograms were of women who had no family history of breast or ovarian cancer and no prior history of breast cancer or benign breast disease. These women had a less than 10% lifetime risk of developing breast cancer based on the Gail model.30 Because age is one of the most important risk factors, 60 low-risk women were randomly selected and age matched to the 30 BRCA1 and BRCA2 mutation carriers at 5-year intervals for the study.
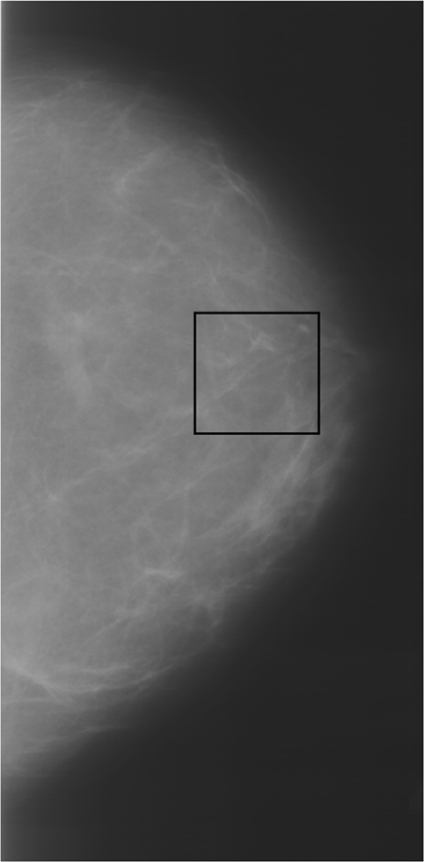
All mammograms were digitized using a laser film digitizer (Konica LD 4500; Konica Medical, Wayne, NJ) at 100 × 100-μm2 pixel size and 10-bit quantization level. The laser film digitizer was routinely calibrated to assure that film optical density in the range of 0.0 to 3.5 is linearly translated into digital pixel values. ROIs, 256 by 256 pixels in size, were manually selected from the central breast region behind the nipple,23 as they usually include the most dense part of the breast. These ROIs were used for subsequent power law spectral analyses. An example of a selected ROI from a breast image is shown in Fig 1.
Fig. 1.
A selected ROI from central breast region behind nipple on a digitized mammogram.
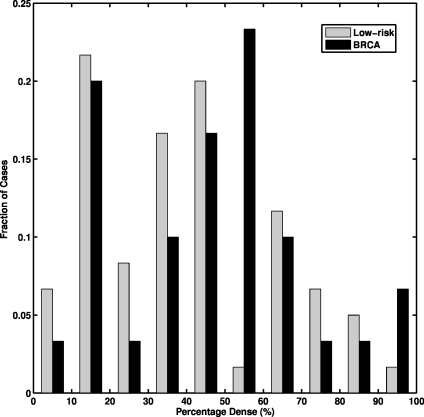
The breast percentage dense was estimated by an expert breast radiologist for the age-matched data set. The histogram of the percentage dense distribution is shown in Fig. 2. The 30 gene mutation carriers have breast percentage dense ranging from 5 to 90%, with a mean of 43%, and the 60 age-matched low-risk women have breast percentage dense ranging from 3 to 90%, with a mean of 37% (p = 0.22 from a two-tailed t test for the difference between the two groups).
Fig. 2.
The histogram of breast percentage dense for the 30 BRCA1/2 gene mutation carriers and the 60 age-matched low-risk women.
Power Law Spectral Analysis
Power law spectral analysis performed in this study is based on the power spectrum from the discrete Fourier transformation (DFT) of the ROI image data. The discrete Fourier transform31 of an ROI image, f(m, n), of size M by N is given by
 |
1 |
where u and v are the spatial frequencies in the x and y directions, respectively.
The ROI image used in our study has a finite number of data samples, which can be represented by the two-dimensional Rect function in spatial domain and results in a two-dimensional sinc2 function in the spatial frequency domain.26 To reduce the discontinuity in the spatial domain, a window function is applied on the ROI image before the DFT.26 The radial window function is based on a Hanning window function,26,32,33h(r), which is given by
 |
2 |
The power spectrum, P(f) (also called spectral density), is given by
 |
3 |
where  is radial frequency.
The power law spectrum26 is defined by
 |
4 |
This power law spectrum was calculated using selected ROI images. The algorithm used for estimating the exponent β for an ROI image is as follows: (1) Compute the power spectrum of the ROI image, (2) average the power spectrum along a radial slice, and (3) estimate the exponent β from the least squares fit of the power law spectrum up to the Nyquist frequency.26,34
Computer-extracted Feature
As noted earlier, mammograms from both BRCA1 and BRCA2 gene mutation carriers and low-risk women were included in this study. The exponent β was estimated for each image and was used as a computer-extracted feature (i.e., the mathematical descriptor) to characterize the mammographic parenchymal pattern of the specific mammogram. The usefulness of the exponent β as a decision variable in the task of differentiating between the BRCA1 and BRCA2 gene mutation carriers and the women at low-risk of developing cancer was evaluated using ROC analysis.28,29
Results
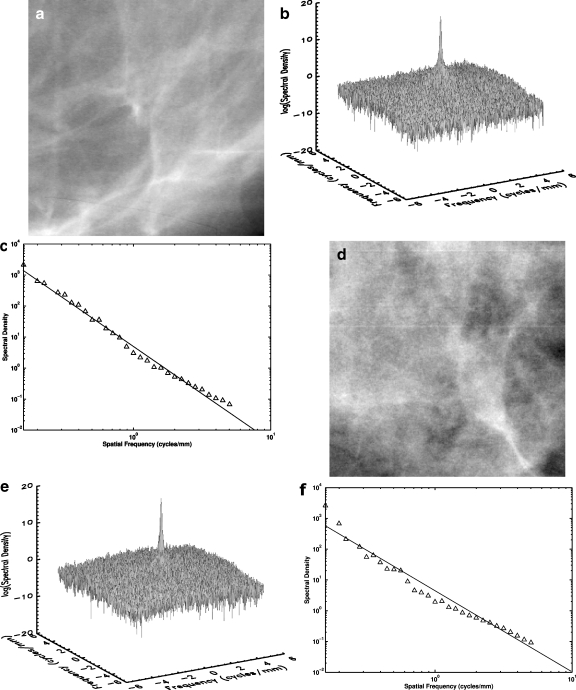
The power spectrum (spectral density), which is based on the discrete Fourier transform method with a radial Hanning window, was calculated for each ROI image in the data set. Figure 3a shows an example of an ROI image selected from the BRCA1/BRCA2 mutation carrier group. The spectral density surface plot for the same ROI image is shown in Fig. 3b. This spectral density surface plot is sharply peaked at zero frequency and has little angular dependence. The relationship between spectral density and spatial frequency (log–log plot) is shown in Fig. 3c for the same ROI. The least squares fit from the log–log plot yields a β value of 2.90 and a coefficient of determination R2 value of 0.99 for the linear fit.
Fig. 3.
a A selected ROI image from a digitized mammogram of a BRCA1 gene-mutation carrier. b The surface plot of the power spectrum of the ROI image in a. c The log–log plot of spectral density vs spatial frequency of the ROI image in a. The coefficient of determination R2 value for the linear fit is 0.99. d A selected ROI image from a digitized mammogram of a low-risk woman. e The surface plot of the power spectrum for the ROI image in d. f The log–log plot of spectral density vs spatial frequency of the ROI image in d. The coefficient of determination R2 value for the linear fit is 0.97.
An ROI image selected from a woman at low risk for breast cancer is shown in Fig. 3d. The surface plot of the 2D spectral density for the same ROI image is shown in Fig. 3e, and the log–log plot between spectral density and spatial frequency is shown in Fig. 3f. A β value of 2.58 is estimated from the linear regression line with a coefficient of determination R2 value of 0.97 for the linear fit.
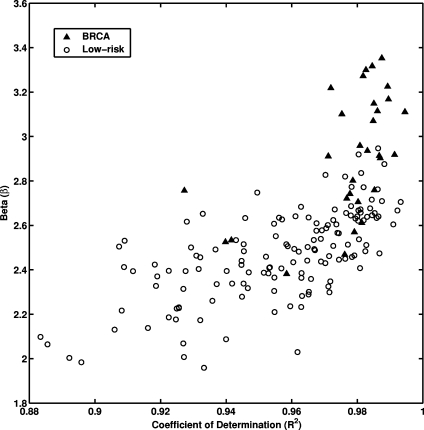
The least-squares fits were performed between log spectral density and log spatial frequency on each mammographic image for the entire database. Figure 4 shows the relationship between individual β value and the coefficient of determination R2 value of the corresponding linear regression line for all the ROI images. A relatively high R2 value was observed for the entire data set (average R2 value of 0.96 with a standard deviation of 0.02). Such high R2 value suggests that indeed there is a linear relationship between log spectral density and log spatial frequency for the mammographic patterns of breast structure. The mammographic parenchymal patterns appear to have an approximately isotropic power law spectrum of the form  , as noted earlier by Burgess.26
Fig. 4.
The distribution between the exponent β values of power law spectrum and coefficient of determination R2 values for the entire database.
Larger β values (Figure 4) were obtained for the database of 30 gene mutation carriers with an average value of 2.92 ± 0.28. Whereas, an average β value of 2.47 ± 0.20 was obtained for the database of 142 low-risk women. The p value was less than 0.0001 with 95% confidence interval of 0.36–0.53 for the difference of the two means from an unpaired t test. The usefulness of the β value as a decision variable in the task of differentiating between the gene mutation carriers and the low-risk women can be indicated in terms of area under the ROC curve, Az. Using this single feature, ROC analysis yielded an Az value of 0.90 in differentiating between gene mutation carriers and low-risk women in the entire database. For the age-matched subset, an Az value of 0.89 was achieved. The estimated standard error for Az value was 0.04, both for the entire database and in the age-matched subset.
Discussion
In this study, we investigated the power law spectrum, of the form  , of the mammographic parenchymal patterns of BRCA1 and BRCA2 gene mutation carriers as well as of women at low risk for developing breast cancer. Our results demonstrate that in general, the mammographic parenchymal patterns appears to have an isotropic 2D power law spectrum of the form
  , with β in the range from 2.0 to 3.3 for the entire database. Similar observations on mammographic images, in general, have been reported by others.32,35
An important issue is the understanding of the effect of high frequency noise on the power spectral analysis. In our study, we chose to include frequencies—up to the Nyquist frequency in the estimation of the exponent β value, as the purpose of our study was to differentiate between gene mutation carriers and low-risk women for breast cancer risk assessment, rather than to characterize the parenchymal patterns for human observer detection tasks. Others have shown that human observer detection performance depends on the statistical characteristics of the image noise.36
Understanding the image noise properties is useful in evaluating the effect of image noise on the visual signal detection performance. From Fig. 3c and f, it is apparent that image noise is present at high frequencies in the mammographic images, as indicted by the slight change in slopes of the log–log plots at frequencies around one cycle per millimeter.
BRCA1 and BRCA2 gene mutation carriers and low-risk woman have different mammographic patterns, which are indicated by the β value as a computer-extracted feature (Figure 4). On average, the larger β values were obtained for mutation carriers, and the smaller β values were obtained for low-risk women. As indicated by the Az value, the high-level performance in differentiating between mammographic patterns of gene mutation carriers and low-risk women was achieved by using the exponent β value as the single feature.
It is interesting to note that as observed in Fig. 4, the goodness of the fitting, as indicated by the coefficient of determination R2 value, is higher for the gene carrier database as compared to the low-risk database. While the reason for this is still under investigation, it may be that women at high risk for breast cancer have a parenchymal texture pattern that is more statistically self-similar over a range of spatial scales than that of women at low risk, or it may be that because of the coarser nature of the parenchymal texture pattern of women at high risk, spectral analysis yields more accurate calculations within the spatial limitations of the 0.1-mm pixel size.
To further elaborate the relationship between the exponent β and mammographic parenchymal patterns, the exponent β can be transformed to the fractal dimension, which is defined by
 |
5 |
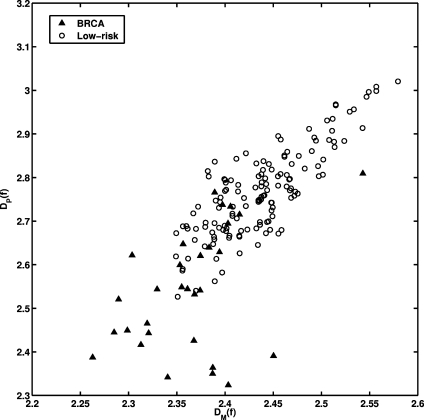
where D is fractal dimension.26,37 For the gene mutation carriers, their mammographic images appear to have a coarser texture, as reflected by a lower fractal dimension (larger β value). The texture pattern from the low-risk women yields higher fractal dimension (smaller β value). These observations agree with our previous studies on fractal analysis of mammograms.25 As seen in Fig. 5, we obtained a correlation coefficient of r = 0.80 (P value less than 0.0001) between the fractal dimension estimated using the β value and the fractal dimension estimated using the Minkowski algorithm from our earlier studies.25
Fig. 5.
The distribution between the fractal dimension estimated from the power spectral analysis (DP(f)) and from the Minkowski fractal dimension (DM(f)) for the entire database. The correlation coefficient (r) between DM(f) and DP(f) is 0.80 (P < 0.0001).
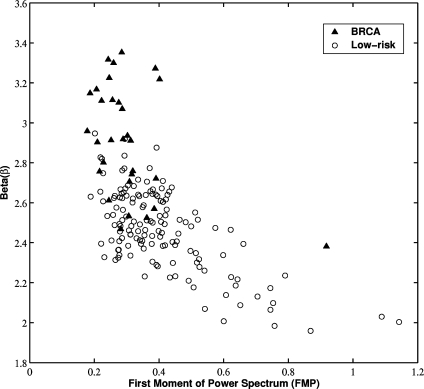
The exponent β value indirectly characterizes the frequency content of the texture pattern with a large β value reflecting a low spatial frequency component. The exponent β value was compared with our previous investigations of the first moment of power spectrum (FMP).24 FMP is derived from the two-dimensional Fourier transform and is used to characterize the texture pattern’s spatial frequency content. For the gene mutation carriers, their mammographic patterns appear to be dominated by low-frequency content (larger β value), which is in good agreement with their FMP features (smaller FMP value). From Fig. 6, a correlation coefficient of r = 0.62 (P value less than 0.0001) was obtained between β value and FMP.
Fig. 6.
The distribution between the exponent β from the power spectral analysis and FMP for the entire database. The correlation coefficient (r) between β and FMP is 0.62 (P < 0.0001).
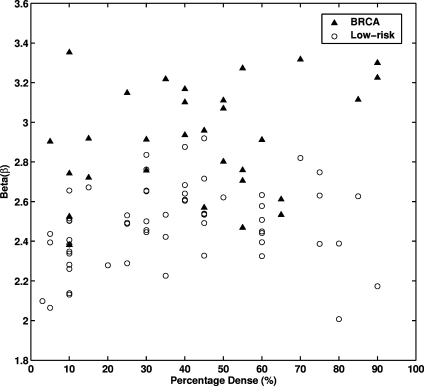
A relatively low correlation coefficient (r = 0.26) was observed between β value and breast density (Figure 7). Mammograms from both the gene mutation carriers and the women at low risk spanned the range of densities. Thus, breast density and parenchymal patterns may act as risk factors in a complementary way.
Fig. 7.
The distribution between the exponent β from the power spectral analysis and breast percentage dense for the entire database. The correlation coefficient (r) between β and percentage dense is 0.26 (P = 0.013).
In summary, the results from this study agree with prior research in that mammographic parenchymal patterns have an isotropic 2D power law spectrum of the form  . Furthermore, we have found that the mammographic images of BRCA1 and BRCA2 gene mutation carriers present a coarser texture (i.e., larger β value) than those of women at low risk for breast cancer. Such a radiographic marker may aid clinicians in assessing an individual’s risk of developing breast cancer and for monitoring the effectiveness of preventive and therapeutic treatments.
Acknowledgments
We would like to thank Zhimin Huo, Ph.D., for initial studies on the database, Arthur E. Burgess, Ph.D., for useful discussions, Barbara L. Weber, M.D., for contributing cases to the database, and Dulcy E. Wolverton, M.D., for reviewing the mammograms. This work was supported in parts by USPHS grants R01-CA89452, R21-CA113800, and P50-CA125183 and by a grant from the US Army Medical Research and Materiel Command (DAMD 98-1209). M. L. Giger is a shareholder in R2/Hologic (Sunnyvale, CA). It is the policy of the University of Chicago that investigators disclose publicly actual or potential significant financial interests that may appear to be affected by the research activities.
References
- 1.Carter CL, Allen C, Henson DE. Relation of tumor size, lymph node status, and survival in 24,740 breast cancer cases. Cancer. 1989;63:181–189. doi: 10.1002/1097-0142(19890101)63:1<181::AID-CNCR2820630129>3.0.CO;2-H. [DOI] [PubMed] [Google Scholar]
- 2.Clay MG, Hishop G, Kan L, Olivotto IA, Burhenne LJ. Screening mammography in British Columbia 1988–1993. Am J Surg. 1994;167:490–492. doi: 10.1016/0002-9610(94)90241-0. [DOI] [PubMed] [Google Scholar]
- 3.Jemal A, Siegel R, Ward E, Murray T, Xu J, Thun MJ. Cancer statistics, 2007. CA Cancer J Clin. 2007;57:43–66. doi: 10.3322/canjclin.57.1.43. [DOI] [PubMed] [Google Scholar]
- 4.Singletary SE. Rating the risk factors for breast cancer. Ann Surg. 2003;237:474–482. doi: 10.1097/00000658-200304000-00007. [DOI] [PMC free article] [PubMed] [Google Scholar]
- 5.Heine JJ, Malhotra P. Mammographic tissue, breast cancer risk, serial image analysis, and digital mammography. Acad Radiol. 2002;9:298–316. doi: 10.1016/S1076-6332(03)80373-2. [DOI] [PubMed] [Google Scholar]
- 6.Stoutjesdijk MJ, Boetes C, Jager GJ, Beex L, Bult P, Hendriks J, Laheij R, Massuger L, Die LE, Wobbes T, Barentsz JO. Magnetic resonance imaging and mammography in women with a hereditary risk of breast cancer. J Natl Cancer Inst. 2001;93:1095–1102. doi: 10.1093/jnci/93.14.1095. [DOI] [PubMed] [Google Scholar]
- 7.Warner E, Plewes DB, Shumak RS, Catzavelos GC, Prospero LS, Yaffe MJ, Goel V, Ramsay E, Chart PL, Cole DEC, Taylor GA, Cutrara M, Samuels TH, Murphy JP, Murphy JM, Narod SA. Comparison of breast magnetic resonance imaging, mammography, and ultrasound for surveillance of women at high risk for hereditary breast cancer. J Clin Oncol. 2001;19:3524–3531. doi: 10.1200/JCO.2001.19.15.3524. [DOI] [PubMed] [Google Scholar]
- 8.Euhus DM, Smith KC, Robinson L, Stucky A, Olopade OI, Cummings S, Garber JE, Chittenden A, Mills GB, Rieger P, Esserman L, Crawford B, Hughes KS, Roche CA, Ganz PA, Seldon J, Fabian CJ, Klemp J, Tomlinson G. Pretest prediction of BRCA1 or BRCA2 mutation by risk counselors and the computer model BRCAPRO. J Natl Cancer Inst. 2002;94:844–851. doi: 10.1093/jnci/94.11.844. [DOI] [PubMed] [Google Scholar]
- 9.Thompson D, Easton DF. Cancer incidence in BRCA1 mutation carriers. J Natl Cancer Inst. 2002;94:1358–1365. doi: 10.1093/jnci/94.18.1358. [DOI] [PubMed] [Google Scholar]
- 10.Wolfe JN. Breast patterns as an index of risk for developing breast cancer. Am J Roentgenol. 1976;126:1130–1139. doi: 10.2214/ajr.126.6.1130. [DOI] [PubMed] [Google Scholar]
- 11.Boyd NF, O’Sullivan B, Fishell E, Simor I, Cooke G. Mammographic patterns and breast cancer risk: methodologic standards and contradictory results. J Natl Cancer Inst. 1984;72:1253–1259. [PubMed] [Google Scholar]
- 12.Boyd NF, Martin LJ, Stone J, Greenberg C, Minkin S, Yaffe MJ. Mammographic densities as a marker of human breast cancer risk and their use in chemoprevention. Curr Oncol Rep. 2001;3:314–321. doi: 10.1007/s11912-001-0083-7. [DOI] [PubMed] [Google Scholar]
- 13.Brisson J, Diorio C, Mâsse B. Wolfe’s parenchymal pattern and percentage of the breast with mammographic densities: redundant or complementary classifications? Caner Epidemiol Biomarkers Prev. 2003;12:728–732. [PubMed] [Google Scholar]
- 14.Tahoces PG, Correa J, Souto M, Gomez L, Vidal JJ. Computer-assisted diagnosis: the classification of mammographic breast parenchymal patterns. Phys Med Biol. 1995;40:103–117. doi: 10.1088/0031-9155/40/1/010. [DOI] [PubMed] [Google Scholar]
- 15.Magnin IE, Cluzeau F, Odet CL. Mammographic texture analysis: an evaluation of risk for developing breast cancer. Opt Eng. 1986;25:780–784. [Google Scholar]
- 16.Taylor P, Hajnal S, Dilhuydy MH, Barreau B. Measuring image texture to separate “difficult” from “easy” mammograms. Br J Radiol. 1994;67:456–463. doi: 10.1259/0007-1285-67-797-456. [DOI] [PubMed] [Google Scholar]
- 17.Byng JW, Yaffe MJ, Lockwood LE, Little LE, Tritchler DL, Boyd NF. Automated analysis of mammographic densities and breast carcinoma risk. Cancer. 1997;80:66–74. doi: 10.1002/(SICI)1097-0142(19970701)80:1<66::AID-CNCR9>3.0.CO;2-D. [DOI] [PubMed] [Google Scholar]
- 18.Boyd NF, Lockwood GA, Martin LJ, Knight JA, Byng JW, Yaffe MJ, Tritchler DL. Mammographic densities and breast cancer risk. Breast Dis. 1998;10:113–126. doi: 10.3233/bd-1998-103-412. [DOI] [PubMed] [Google Scholar]
- 19.Boyd NF, Martin LJ, Stone J, Greenberg C, Minkin S, Yaffe MJ. Mammographic densities as a marker of human breast cancer risk and their use in chemoprevention. Cancer Prev. 2001;3:314–321. doi: 10.1007/s11912-001-0083-7. [DOI] [PubMed] [Google Scholar]
- 20.Atkinson C, Warren R, Bingham SA, Day NE. Mammographic patterns as a predictive biomarker of breast cancer risk: effect of tamoxifen. Cancer Epidemiol Biomarkers Prev. 1999;8:863–866. [PubMed] [Google Scholar]
- 21.Huo Z, Giger ML, Wolverton DE, Zhong W, Cumming SA, Olopade OI. Computerized analysis of mammographic parenchymal patterns for breast cancer risk assessment: feature selection. Med Phys. 2000;27:4–12. doi: 10.1118/1.598851. [DOI] [PubMed] [Google Scholar]
- 22.Huo Z, Giger ML, Olopade OI, Wolveton DE, Weber BL, Metz CE, Zhong W, Cummings SA. Computerized analysis of digitized mammograms of BRCA1 and BRCA2 gene mutation carriers. Radiology. 2002;225:519–526. doi: 10.1148/radiol.2252010845. [DOI] [PubMed] [Google Scholar]
- 23.Li H, Giger ML, Huo Z, Olopade OI, Lan L, Weber BL, Bonta I. Computerized analysis of mammographic parenchymal patterns for assessing breast cancer risk: effect of ROI size and location. Med Phys. 2004;31:549–555. doi: 10.1118/1.1644514. [DOI] [PubMed] [Google Scholar]
- 24.Li H, Giger ML, Olopade OI, Margolis A, Lan L, Chinander MR. Computerized texture analysis of mammographic parenchymal patterns of digitized mammograms. Acad Radiol. 2005;12:863–873. doi: 10.1016/j.acra.2005.03.069. [DOI] [PubMed] [Google Scholar]
- 25.Li H, Giger ML, Olopade OI, Lan L. Fractal analysis of mammographic parenchymal patterns in breast cancer risk assessment. Acad Radiol. 2007;14:513–521. doi: 10.1016/j.acra.2007.02.003. [DOI] [PubMed] [Google Scholar]
- 26.Burgess AE: Mammographic structure: data preparation and spatial statistics analysis. Medical Imaging 1998, Image Processing, San Diego, CA. In: Hanson K Ed. Proceedings of the Society of photo-optics Instrumentation Engineers, Bellingham, WA, vol. 3661, 1998, pp 642–653
- 27.Heine JJ, Velthuizen RP. Spectral analysis of full field digital mammography data. Med Phys. 2002;29:647–661. doi: 10.1118/1.1445410. [DOI] [PubMed] [Google Scholar]
- 28.Metz CE. ROC methodology in radiologic imaging. Invest Radiol. 1986;21:720–733. doi: 10.1097/00004424-198609000-00009. [DOI] [PubMed] [Google Scholar]
- 29.Metz CE. Some practical issues of experimental design and data analysis in radiological ROC studies. Invest Radiol. 1989;24:234–245. doi: 10.1097/00004424-198903000-00012. [DOI] [PubMed] [Google Scholar]
- 30.Gail MH, Brinton LA, Byar DP, Corle DK, Green SB, Schairer C, Mulvihill JJ. Projecting individualized probabilities of developing breast cancer for white females who are being examined annually. J Natl Cancer Inst. 1989;81:1879–1886. doi: 10.1093/jnci/81.24.1879. [DOI] [PubMed] [Google Scholar]
- 31.Sonka M, Hlavac V, Boyle R. Image processing, analysis, and machine vision. Pacific Grove, CA: PWS; 1999. [Google Scholar]
- 32.Burgess AE, Jacobson FL, Judy PF. Human observer detection experiments with mammograms and power-law noise. Med Phys. 2001;28:419–437. doi: 10.1118/1.1355308. [DOI] [PubMed] [Google Scholar]
- 33.Bendat JS, Piersol AG. Random data: analysis and measurement procedures. New York: Wiley; 2000. [Google Scholar]
- 34.Rice JA. Mathematical statistics and data analysis. Belmont, CA: Duxbury; 1995. [Google Scholar]
- 35.Heine JJ, Velthuizen RP. Spectral analysis of full field digital mammography data. Med Phys. 2002;29:647–661. doi: 10.1118/1.1445410. [DOI] [PubMed] [Google Scholar]
- 36.Eckstein MP, Whiting JS. Visual signal detection in structured backgrounds: I. Effect of number of possible spatial locations and signal contrast. J Opt Soc Am A. 1996;13:1777–1787. doi: 10.1364/JOSAA.13.001777. [DOI] [PubMed] [Google Scholar]
- 37.Soille P, Rivest JF. On the validity of fractal dimension measurements in image analysis. J Visual Commun Image Represent. 1996;7:217–229. doi: 10.1006/jvci.1996.0020. [DOI] [Google Scholar]


