Abstract
A new application, Fusion Viewer, available for free, has been designed and implemented with a modular object-oriented design. The viewer provides both traditional and novel tools to fuse 3D data sets such as CT (computed tomography), MRI (magnetic resonance imaging), PET (positron emission tomography), and SPECT (single photon emission tomography) of the same subject, to create maximum intensity projections (MIP) and to adjust dynamic range. In many situations, it is desirable and advantageous to acquire biomedical images in more than one modality. For example, PET can be used to acquire functional data, whereas MRI can be used to acquire morphological data. In some situations, a side-by-side comparison of the images provides enough information, but in most of the cases it may be necessary to have the exact spatial relationship between the modalities presented to the observer. To accomplish this task, the images need to first be registered and then combined (fused) to create a single image. In this paper, we discuss the options for performing such fusion in the context of multimodal breast imaging. Additionally, a novel spline-based dynamic range technique is presented in detail. It has the advantage of obtaining a high level of contrast in the intensity range of interest without discarding the intensity information outside of this range while maintaining a user interface similar to the standard window/level windowing procedure.
Key words: Multimodality visualization, fusion visualization, multimodal imaging, image fusion, clinical image viewing, image viewer, image visualization, image display, contrast enhancement, image contrast, volume visualization, imaging, three-dimensional, image analysis, biomedical image analysis, image enhancement, cancer detection, breast, algorithms
INTRODUCTION
In most instances, multiple-modality visualization of pathologies will present advantages over single-modality studies. Recently, benefits stemming from acquisition of medical images from multiple instruments have begun to outweigh the additional cost. Images from different modalities, such as x-ray computed tomography (CT), magnetic resonance imaging (MRI), single photon emission computer tomography (SPECT), positron emission tomography (PET), and ultrasound are used to acquire complementary information. For example, an MRI or CT image might be acquired to obtain the anatomical information followed by the acquisition of one or more PET or SPECT images to obtain information on the physiological and/or functional behavior in the areas of interest.
There is an ample body of research devoted to non-rigid registration of images; however, not so much effort has been dedicated to the fusion of registered images. A new application, Fusion Viewer1, available for free, has been designed and implemented with a modular object-oriented design. The application was implemented on the .NET platform in its language of choice, C#. The application can be widely used because of the unique capability of a .NET application of being both operating system and machine architecture independent, with the added advantage of being supported for the foreseeable future because of the growing popularity of the .NET platform.
To earn acceptance of the biomedical research community, the tool has to be simple to download and launch. The .NET platform makes the distribution of the Fusion Viewer software trivial. The application only needs to be compiled (to MSIL) once, after which it can be run on any computer with the .NET framework installed. This means it can simply be downloaded and run, and the user does not need to perform a complicated compilation process.
In addition to fusing capabilities, several options are provided for mapping 16-bit data sets onto an 8-bit display, including windowing, automatically and dynamically defined tone transfer functions, and histogram-based techniques. Also, both traditional Maximum Intensity Projections (MIP) and MIPs of fused volumes are supported.
The remainder of this article focuses on the features of the Fusion Viewer software package. Options for controlling the viewing experience including spatial scaling, brightness and contrast settings, dynamic range options, coloring, and projection options will be discussed. After a complete coverage of the tools for viewing a single volume, tools for viewing multiple volumes will be discussed, including synchronizing data sets and tools for fusion.
THE APPLICATION
Fusion Viewer is designed to process data on an as-needed basis. By only processing the portions of the image volume that are currently visible to the user, the images can be resized, converted to 8-bit, can undergo contrast and brightness adjustments, have color tables applied and get fused with other images in real time. By processing on an as-needed basis, a highly interactive environment is available to the user.
Importing/Exporting and Viewing Volumetric Data Sets
The “File” drop down menu allows for import and export of data sets. Currently, only the capability for importing multi-page tiff files is included in the release version of the software, but work on supporting other formats such as DICOM is underway. Data can be saved as a 2D slice or a 3D stack. The read and write capabilities of the software are provided by the FreeImage library.1,2
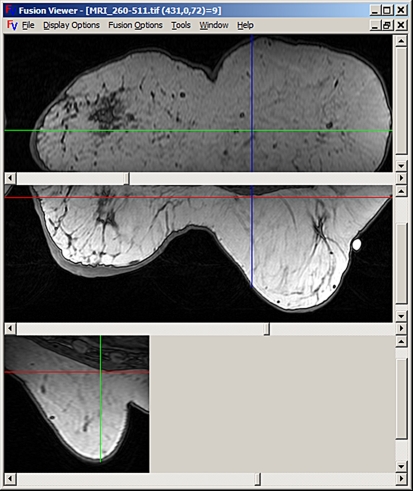
Volumes are displayed using conventional orthogonal cross-sectional views: coronal, axial, and sagittal. Figure 1 presents a screen capture of a volume display window. The cross-hairs shown on each image indicate the point of focus, and the two lines of each cross-hair represent the locations of the other two displayed slices.
Fig 1.
A volume displayed in the three conventional orthogonal views: coronal, axial, and sagittal from top to bottom.
Image Adjustment for Display
Most medical images, as acquired, are not ready to be examined using common display options. A few simple steps can be taken to prepare the data for analysis. A growing body of research related to image quality and dynamic range adjustment pertaining to medical imaging has become available in the last few years. Approaches include adaptive histogram equalization, neural network algorithms, adaptive window width/center adjustments, etc.3–7. Traditional mapping techniques such a linear mapping and histogram equalization are implemented,8 in Fusion Viewer, as well as two novel spline-based techniques. The latter are proposed as a very simple yet robust alternative to the traditional linear windowing. The dynamic range compression settings of FusionViewer are found by selecting the Brightness/Contrast option from the “Display Options” drop down menu.
Splines are piecewise polynomials of degree n that have the advantage of being simple functions with a very flexible global behavior; they are used as interpolators preserving the monotonicity and convexity of the data. These polynomials are joined together at the break points with n−1 continuous derivatives. These properties render themselves very useful for generating a piecewise Tone Transfer Function, TTF.
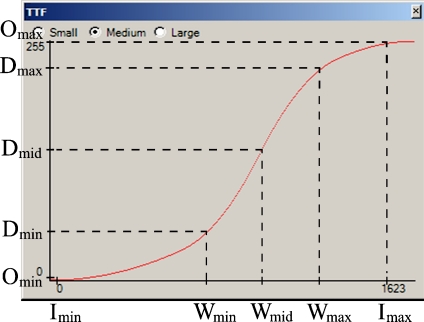
The TTF is divided in four regions as shown in Figure 2, with breakpoints set at (Imin, Omin), (Wmin, Dmin), (Wmid, Dmid), (Wmax,Dmax) and (Imax,Omax). The horizontal axis shows the 1,624 different intensities in the input MRI data set and how these are mapped into 256 gray level values for a common 8-bit display. This is the look-up table used to generate Figure 1.
Fig 2.
Example of spline-based TTF.
The minimum and maximum gray level values that are to be retained from the input image, Imin and Imax, are found, and these are mapped to the output minimum and maximum intensity values, Omin and Omax, respectively.
Wmin, Wmid, and Wmax are determined by the user using standard window/level adjustment controls. Wmid is the level and Wmin and Wmax are the upper and lower range of the window, respectively. Wmid is halfway between Wmin and Wmax and serves as a point of inflection. The goal is to maximize the contrast of intensities that reside in the window while not completely discarding the surrounding contextual information. The parameters that define this window are selected using a slider tool that allows real-time visualization of both the image and the TTF.
The output window size is specified by the observer and is related to the points on the vertical axis according to Eq. 1.
 |
1 |
The value of Wsize ranges from 0 to 1. The location of Dmid is determined from the location of Wmid using Eq. 2.
 |
2 |
Dmax and Dmin are determined from Dmid and Wsize utilizing Eq. 3 and Eq. 4.
 |
3 |
 |
4 |
As a result of saturation, the slope of the TTF to the left of Imin and the right of Imax is assumed to be zero, and these values are used along with the breakpoint locations to start the interpolation process.
Values within the window specified by the user are mapped to a percentage (Wsize) of the display’s intensity range and the values outside of the window are compressed significantly to the remaining portions of the display’s intensity range. For example, intensities of interest from 600 to 1,000 are mapped to 80% of the display’s intensity range, and the remaining intensities are compressed significantly more and mapped onto the remaining 20% of the display’s intensity range. The advantage of the spline-based windowing techniques over traditional windowing techniques is their ability to retain a relatively high contrast in the intensity range of interest, while not totally discarding the intensity information that does not fall in this range. The familiar window/level user interaction makes adoption of the spline-based dynamic range techniques much simpler than other dynamic range options. Two spline choices have been implemented: quadratic splines and quadratic-cubic splines. The first case is self-explanatory, in the second case, the interpolators between (Imin, Omin) and (Wmin, Dmin), and (Wmax, Dmax) and (Imax, Omax) are quadratic splines, and the interpolators between (Wmin, Dmin) and (Wmid, Dmid) , and (Wmid, Dmid) and (Wmax, Dmax) are cubic splines.
Maximum Intensity Projection
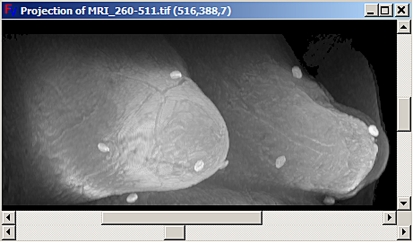
Maximum Intensity Projection (MIP) is a widely used volume visualization technique. The method finds the maximum value of the signal in the way of parallel rays traced from the view plane to the plane of projection. It provides a very good visualization of the structures defined by high signal intensities. Figure 3 shows an example implemented using the command “Show MIP” under the “Display Options” drop down menu. Advanced features such as mean intensity projection, depth adjustment, and noise suppression are supported.
Fig 3.
MIP formed from MRI. Bright spots correspond to contrast markers placed on patient’s skin for image registration.
DISPLAYING COMBINED DATA SETS
A combined MRI/PET image has the benefit of directly showing the spatial relationships between the two modalities, in many cases increasing the sensitivity, specificity, and accuracy of diagnosis.
Several factors need to be considered when choosing a visualization technique. These include information content, observer interaction, ease of use, and observer understanding. From an information theory point of view it is desirable to maximize the amount of information present in the fused image. Ideally, the registered images would be viewed as a single image that contains all of the information contained in both the MRI image and the PET image. Limitations in the dynamic range and colors visible on current display devices as well as limitations in the human visual system make this nearly impossible.
This loss of information can be partially compensated for by making the fused display interactive. Some sort of control over the fusion technique can be provided, which allows the observer to change the information that is visible in the fused display. Several fusion techniques are implemented in the Fusion Viewer and are made available through the ‘Fusion Options’ drop down menu. These include, but are not limited to, color overlay, color mixing, use of other color spaces, and interlacing. Each of these is discussed in detail in the following sections.
Color Overlay
One of the most common techniques used for the fusion of two images is the color overlay technique.9–11 In this technique, one image is displayed semi-transparently on top of the other image. This can be implemented in many ways such as the addition of images, implementation of a 2D color table, or use of the alpha channel. Here it is implemented by performing a weighted averaging of the source images. Color tables are used to convert the grayscale MRI image and grayscale PET image to color images. We permit the weighting to be set, and the intensity of the fused image to be adjusted. Averaging causes a loss in contrast and a decrease in overall intensity, so the ability to scale the intensity of the fused image may be necessary. Some of the common color tables used include grayscale/hot–cold, and red/green. Study of the human visual system suggests that intensity should be used for the higher-resolution image, whereas color should be used for the lower-resolution image. This is because the human eye is more sensitive to changes in intensity than changes in color.12 The optimum color table is operator-dependent, and care should be taken to select a color table that conveys the original intent of the image.
Color Mixing
Color mixing is a technique that can be used to take any number of one-channel images (N) and create a fused RGB image.11 We perform channel mixing using Eq. 5. Here R, G, B represent the red, green, and blue channels in the displayed image, respectively, Si represents the intensity in the ith source image, Ri, Gi, and Bi are the weighting factors for the red channel, green channel, and blue channel. They determine the contribution of source i to each of the output channels.
 |
5 |
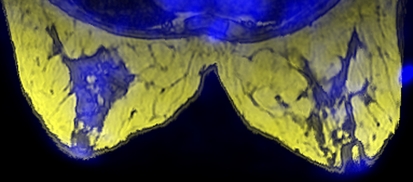
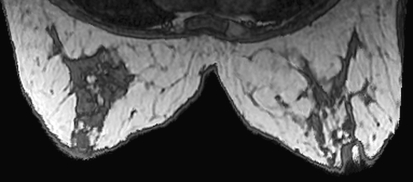
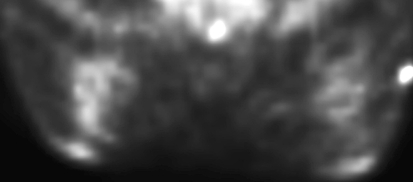
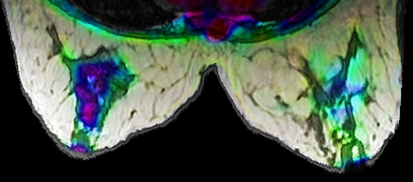
Let the source intensities be normalized from zero to one. Applying Eq. 5 is then equivalent to taking the intensity axis of source i and lying it along the line segment formed by connecting (0, 0, 0) to (Ri, Gi, Bi) in the RGB color space. The output image is then formed by summing the projections of each of these onto the red, green, and blue axes. Figure 4 was produced using six weights and two sources (Figs. 5 and 6). The user can manually change the weighting matrix to produce their desired result.
Fig 4.
Image created using color mixing fusion technique.
Fig 5.
Original MRI image.
Fig 6.
Original PET image.
The technique can be extended by allowing the vectors (Ri, Gi, Bi) to point in any direction. So, for example, as the source intensity increases the red in the fused image decreases. The technique can also be extended by using an offset so that the vectors, (Ri, Gi, Bi), do not need to be located at the origin. After making this extensionism, the color mixing technique can be represented by Eq. 6,13 where OXi represents the offset from the origin along the X axis for the contribution from source i.
 |
6 |
Although this is a powerful technique that provides a nearly infinite set of possible fused images, it is not suitable for clinical use, as it may be difficult to predict how changing weights affects the fused image. Ideally, a set of appropriate weights should be determined ahead of time and made available to the observer. For the most responsive implementation, color mixing can be implemented as a 2D look-up table (LUT) once the weights have been selected.
Use of Other Color Spaces
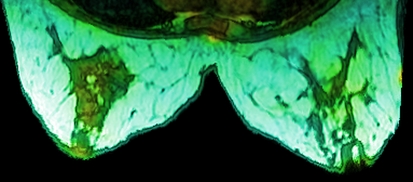
A powerful, yet more complex, technique for the creation of fused images involves the use of different color spaces.11,12,14,15 A few examples include CIE XYZ, CIE L*a*b*, HSV, and HSL. Each source grayscale image can be used as a channel in the color space. The resulting color image can then be converted to the RGB color space for display. For example, if registered PET, CT, and MRI images are available, MRI can be used as the lightness, CT as the saturation, and PET as the hue (Fig. 7).
Fig 7.
Image created using HSL color space. Hue = PET, saturation = CT, lightness = MRI.
This technique is perhaps better suited for the fusion of three sources, but none the less can be used for the fusion of two. It can be done by using a source for more than one channel, or by setting the third channel to a constant (Fig. 8).
Fig 8.
Image created using HSL color space. Hue varies from cyan to green to yellow with the value of PET image; saturation is constant and lightness varies with MRI.
Care needs to be taken with selection of a color space and its implementation details. For example, when mapping a source to the hue channel, it is advisable to map the source intensities to a small range of angles. Mapping to all 360° will result in drastic color changes, distorting or hiding the intensity changes in the image, and creating false segmentation (cf. Fig. 7 vs. Fig. 8).
Interlacing
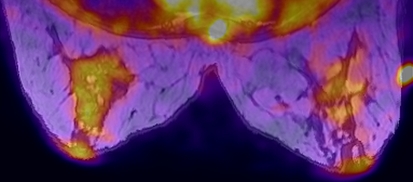
Interlacing is a very common image fusion technique.10,11,16,17 A simple implementation is to interleave the columns of pixels in the source images. For example the first column of the fused image will be the first column of the MRI, the second column of the fused image will be the second column of the PET, and so on (Fig. 9). Independent color tables can be applied to the source images, and the observer should be given control of the source intensities. By adjusting the intensities of the source images, the observer can bring the MRI or PET image out of the fused image as necessary.
Fig 9.
Image created by interlacing PET and MRI volumes. PET image is displayed using a fire color table and MRI with a grayscale color table.
Other interlacing options include interleaving the rows, or even every other pixel in the image. Adjusting the ratio of pixels given to the two modalities is another option for making one of the sources more prevalent. For example, one could have two MRI rows followed by one PET row.
One of the largest drawbacks of an interlacing approach is the loss of spatial resolution. Discarding every other row or pixel causes the contribution to the fused volume to have half of the resolution of the source. In the case of PET, which is magnified to be the same resolution as the MRI before fusion, this is a minor issue. However, the effect of this approach on the high-resolution MRI should be considered.
This loss of resolution could be compensated for by doubling the size of the source images. This, however, is not always convenient. This issue has been addressed by performing the interlacing temporally rather than spatially. Rapidly alternating the images allows fusion to be performed within the eye, via residual images on the retina. Adjusting the intensity of the images, or their allotted display times will adjust their contribution to the fused image.17
Color MIP
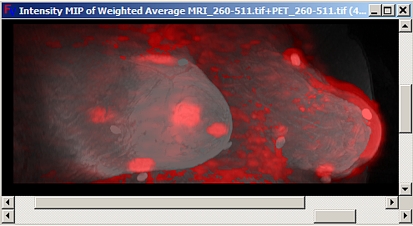
Color MIPs have also been implemented for fused volumes. An example using PET/MRI data is shown in Figure 10. Fusion was created by performing a weighted average of the two volumes and selecting a gray scale look-up table for the MRI set and a red look-up table for the PET set. In this case, the intensity was used to determine the projection, but other properties, for example the redness, could be used. Projection of other properties is supported using the plug-in interface. Options exist for both fusing MIPs and creating MIPs of fused volumes. After MIPs of individual data sets have been created within Fusion Viewer, they can be fused using any of the fusion techniques previously discussed using the choices available through the ‘Fusion Options’ drop down menu. Options for creating MIPs of previously fused data sets are also available through the same menu.
Fig 10.
Color MIP from fused PET/MRI.
CONCLUSIONS
Fusion Viewer, a new application for visualizing and examining three-dimensional medical data sets, was presented. The most significant advantage of Fusion Viewer over previous applications is its capabilities in examining multiple data sets simultaneously. Not only does Fusion Viewer keep multiple data sets synchronized, but it also provides tools for displaying them as a single color data set. Several fusion options are already provided as plug-ins, and a simple interface exists for experimenting with new fusion schemes18. In addition to these capabilities, Fusion Viewer provides interfaces to evaluate various projection techniques, such as the popular Maximum Intensity Projection (MIP). Specifically of interest are its capabilities to fuse projected data sets, and create projections of fused data sets. Fusion Viewer’s capability for dealing with the dynamic range of medical images was presented. Novel spline-based techniques introduced in the Fusion Viewer software package were presented, and an interface exists for experimenting with new dynamic range techniques. Fusion Viewer was implemented on the .NET framework for easy distribution, installation, and compatibility with current and future platforms. Its design for only processing the data currently being presented to the user makes it an ideal tool for real-time fusion and evaluation of large data sets.
By fusing the MRI and PET images, a combined functional and morphological image is produced. We believe such an image will prove invaluable when detecting and grading the cancer, and assessing the need for surgical biopsy.
Whereas the fusion techniques are presented in this paper in the context of MRI and PET breast images, the same techniques can be used for fusion of other imaging modalities. All of the techniques can be expanded for use with three or more image sources.
The techniques reported in this paper are relatively simple to implement, and the difficulty is in choosing the most appropriate approach for a given diagnostic application, and colors that offer visual appeal, accurate representation of the source images, and improved diagnostic performance. To the best of our knowledge, there is not a scientifically optimized fusion technique, and the technique used should be governed by the diagnostic situation and the observer’s experience, training, and preference.
Care should also be taken in preprocessing the images. Accounting for the high dynamic range in images, windowing, and intensity adjustments will have an important influence on the fused image.
Footnotes
References
- 1.Drolon H: FreeImage. Available at http://freeimage.sourceforge.net/. Accessed on 29 October 2006
- 2.Drolon H: FreeImage Documentation, Library Version 3.9.2, Oct. 29, 2006
- 3.Lai SH, Fang M. A hierarchical neural network algorithm for robust and automatic windowing of MR images. Artif Intell Med. 2000;19:97–100. doi: 10.1016/S0933-3657(00)00041-5. [DOI] [PubMed] [Google Scholar]
- 4.Jin Y, Fayad L, Laine A. Contrast enhancement by multi-scale adaptive histogram equalization. Wavelets: Applications in signal and image processing. Proc SPIE Int Soc Opt Eng. 2000;4478:206–213. [Google Scholar]
- 5.Fayad L, Jin Y, Laine A, et al. Chest CT window settings with multiscale adaptive histogram equalization: Pilot study. Radiology. 2002;223(3):845–852. doi: 10.1148/radiol.2233010943. [DOI] [PubMed] [Google Scholar]
- 6.Lai SH, Fang M. An adaptive window width/center adjustment system with online training capabilities for MR images. Artif Intell Med. 2005;33:89–101. doi: 10.1016/j.artmed.2004.03.008. [DOI] [PubMed] [Google Scholar]
- 7.Hara S, Shimura K, Nagata T. Generalized dynamic range compression algorithm for visualization of chest CT images. Medical imaging: Visualization, image-guided procedures, and display. Proc SPIE Int Soc Opt Eng. 2004;5367:578–585. [Google Scholar]
- 8.Gonzalez RC, Woods RE. Digital Image Processing. 2. Upper Saddle River: Prentice Hall, NY; 2002. [Google Scholar]
- 9.Porter T, Duff T: Compositing Digital Images. In: SIGGRAPH ’84 Conference Proceedings (11th Annual Conference on Computer Graphics and Interactive Techniques), 1984, vol. 18, pp 253–259
- 10.Spetsieris PG, Dhawan V, Ishikawa T, Eidelberg D: Interactive visualization of coregistered tomographic images. Presented at Biomedical Visualization Conference, Atlanta, GA, USA, 1995
- 11.Baum KG, Helguera M, Hornak JP, Kerekes JP, Montag ED, Unlu MZ, Feiglin DH, Krol A: Techniques for fusion of multimodal images: Application to breast imaging. In: Proceedings of IEEE International Conference on Image Processing, 2006, pp 2521–2524
- 12.Russ JC: The Image Processing Handbook, 4th ed: CRC Press, Inc., 2002
- 13.Baum KG, Helguera M, Krol A: Genetic Algorithm Automated Generation of Multivariate Color Tables for Visualization of Multimodal Medical Data Sets. Proceedings of IS & T/SID’s 14th Color Imaging Conference, 2006, pp 138–143
- 14.Agoston AT, Daniel BL, Herfkens RJ, Ikeda DM, Birdwell RL, Heiss SG, Sawyer-Glover AM. Intensity-modulated parametric mapping for simultaneous display of rapid dynamic and high-spatial-resolution breast MR imaging data. Radiographics. 2001;21:217–226. doi: 10.1148/radiographics.21.1.g01ja22217. [DOI] [PubMed] [Google Scholar]
- 15.Sammi MK, Felder CA, Fowler JS, Lee JH, Levy AV, Li X, Logan J, Palyka I, Rooney WD, Volkow ND, Wang GJ, Springer CS., Jr Intimate combination of low- and high-resolution image data: I. Real-space PET and H2O MRI, PETAMRI. Magn Reson Med. 1999;42:345–360. doi: 10.1002/(SICI)1522-2594(199908)42:2<345::AID-MRM17>3.0.CO;2-E. [DOI] [PubMed] [Google Scholar]
- 16.Rehm K, Strother SC, Anderson JR, Schaper KA, Rottenberg DA. Display of merged multimodality brain images using interleaved pixels with independent color scales. J Nucl Med. 1994;35:1815–1821. [PubMed] [Google Scholar]
- 17.Lee JS, Kim B, Chee Y, Kwark C, Lee MC, Park KS. Fusion of coregistered cross-modality images using a temporally alternating display method. Med Biol Eng Comput. 2000;38:127–132. doi: 10.1007/BF02344766. [DOI] [PubMed] [Google Scholar]
- 18.Baum KG, Helguera M, Krol A. A new application for displaying and fusing multimodal data sets. Proceedings of SPIE Biomedical Optics. 2007;6431:64310Y. doi: 10.1117/12.702153. [DOI] [Google Scholar]


