

Abstract
Segmentation of the internal organs in medical images is a difficult task. By incorporating a priori information regarding specific organs of interest, results of segmentation may be improved. Landmarking (i.e., identifying stable structures to aid in gaining more knowledge concerning contiguous structures) is a promising segmentation method. Specifically, segmentation of the diaphragm may help in limiting the scope of segmentation methods to the abdominal cavity; the diaphragm may also serve as a stable landmark for identifying internal organs, such as the liver, the spleen, and the heart. A method to delineate the diaphragm is proposed in the present work. The method is based upon segmentation of the lungs, identification of the lower surface of the lungs as an initial representation of the diaphragm, and the application of least-squares modeling and deformable contour models to obtain the final segmentation of the diaphragm. The proposed procedure was applied to nine X-ray computed tomographic (CT) exams of four pediatric patients with neuroblastoma. The results were evaluated against the boundaries of the diaphragm as identified independently by a radiologist. Good agreement was observed between the results of segmentation and the reference contours drawn by the radiologist, with an average mean distance to the closest point of 5.85 mm over a total of 73 CT slices including the diaphragm.
Key words: Computer-assisted image interpretation, X-ray computed tomography, landmark-based segmentation, diaphragm, deformable contour model, linear least-squares model, active contours
Introduction
Image analysis requires the extraction or delineation of specific objects of interest according to their expected characteristics within the image. In medical images, such as computed tomographic (CT) images, such analysis and processing is complicated by the fact that the objects of interest are commonly irregular, structures often overlap one another, and pathological abnormalities (e.g., cancerous tissues) often skew the normal characteristics of the objects of interest. For medical images, a knowledge-based approach to the identification of features within the image may be appropriate.1–6 A priori knowledge regarding contiguous structures, particularly those that are not subject to significant variations, may be used to improve the identification of the objects of interest.
The accurate identification of specific objects or organs in medical images is an important task. Radiation therapy requires that precise amounts of radiation are carefully targeted to destroy undesired tissues, such as cancerous tissue. By providing accurate knowledge regarding the location and characteristics of the objects of interest, the amount of undesired damage to adjacent structures may be minimized. Therefore, precise delineation of all relevant anatomical structures is necessary for accurate treatment planning.2
Knowledge-based approaches to segmentation provide an interesting method to extract objects of interest from medical images. By considering not only the expected grayscale values (or intensity or density) of the desired object but also the expected location, relative position, and distances to adjacent structures, it may be possible to improve the accuracy of segmentation.1 In such cases, the delineation of one structure may provide insight into its contiguous structures, such as the approximate locations. The concept of landmarking is important, as some structures are much easier to identify than others. A sequence of steps identifying the desired landmarks in order of their stability in terms of their appearance and characteristics in the image, that is, progressive landmarking, could lead to improved segmentation of related anatomical structures. For example, in the works of Deglint et al.7 and Vu et al.8, the peripheral muscle was identified by first delineating the artifacts and structures external to the body in CT images and then removing the skin and peripheral fat. A priori knowledge regarding the layers of tissues of the body was incorporated with good levels of success. Rangayyan et al.9 proposed a procedure to identify the spinal canal in CT images, which could be used subsequently to locate adjacent structures, such as the kidneys or aorta. Park et al.4 applied a sequential, landmark-based procedure to segment organs within the abdomen. In knowledge-based approaches, it is essential that stable features are identified first, to design a procedure that is not sensitive to potential variations and deformations in the organs being analyzed.
In many cases of pathological abnormalities, such as Wilm’s tumor or neuroblastoma,7,8 the primary tumor mass has a propensity to develop within the abdominal cavity. Therefore, in the case of identification of such pathologies, it may be appropriate to restrict the scope of segmentation procedures to the abdomen. Delineation of the diaphragm could provide a stable approach to identify the abdominal cavity in a given CT volume.
The diaphragm is a double-domed muscle separating the thoracic and abdominal cavities. It is located inferior to the lungs and forms the floor of the thorax on which the lungs and heart rest.10,11 The concave surface of the diaphragm forms the roof of the abdominal cavity, lying directly over the liver on the right-hand side of the body and over the spleen and the stomach on the left-hand side.10 Its relative proximity to several anatomical structures makes it a potential reference for landmarking the surrounding organs. It is an important structure, which could be used to limit segmentation algorithms spatially to either the abdomen or the thorax, or as a landmark to guide the delineation of contiguous structures.
The automatic detection of the diaphragm in CT images is a difficult problem. In CT, the diaphragm is a thin surface, which suffers from low resolution and partial-volume averaging. Previous related works include the use of an augmented active contour model, as proposed by Keatley et al.12 Beichel et al.13 proposed a three-dimensional (3D) active-appearance model approach to extract the surface of the diaphragm. At the same time that the current work was being developed independently,14 Zhou et al.15 proposed an automatic method to segment the diaphragm in X-ray CT images. The method of Zhou et al.15 uses thin-plate splines, initialized in a manner similar to the method in the present work, as described in the following sections. The results obtained by Zhou et al. were good; however, the exact method of evaluation was not discussed, and the procedure was applied to CT data with high spatial resolution.
In the present work, we propose a method to delineate the diaphragm from 3D CT datasets. The method is robust to low spatial resolution as found in commonly used CT systems. The method is initialized by segmenting the lungs, identifying the lower (diaphragmatic) lung surface, and modeling the diaphragm as a quadratic surface; the result is subsequently refined using a deformable contour model. The deformations are applied in 2D on contiguous CT slices. The method is evaluated using two methods that compare the results obtained with the contours drawn independently by a radiologist: the Hausdorff distance16 and the mean distance to the closest point (MDCP) of ground truth.17
The paper is organized as follows. First, the procedure used to segment the lungs is described, followed by a summary of the method for the extraction of the diaphragm–lung interface. The linear least-squares (LLS) framework used to model the diaphragm as a quadratic surface is then described. The procedure used to refine the diaphragm model is described. The results are then analyzed and discussed in detail. Finally, a conclusion and potential lines for future work are given.
Theoretical Background
To achieve delineation of the diaphragm, mathematical morphology18,19 and a deformable contour model20 are used. Mathematical morphology is used to evaluate the connectivity of pixels by determining pixels of similar value neighboring one another directly. As well, mathematical morphology is used to fill in objects and to remove minor or irrelevant details by using a structuring element. The deformable contour model refines the initial estimate of the diaphragm following the LLS modeling procedure.
Mathematical Morphology
Mathematical morphology provides for systematic alteration of the geometric content of an image while maintaining the stability of important geometric characteristics.18,19 It is based on an analysis of the effects of the application of a geometric form known as a structuring element to the given image. The goal is to probe the image with a structuring element and quantify the manner in which the structuring element fits or does not fit within the image. The type of information extracted depends upon the shape and size of the structuring element21 and the nature of the information in the image.
Binary operators, namely, morphological erosion and dilation, comprise the fundamental operations of mathematical morphology.18 By probing a binary image and computing a Minkowski subtraction (erosion), addition (dilation), or combination thereof (structural opening or closing), it is possible to examine the structural information of the objects within the image according to the structuring element used.18,19 It is possible to filter an image and remove structures smaller than the structuring element or to process an image so as to detect edges. Specific regions of interest can be extracted by using opening by reconstruction,22 which evaluates the connectivity of pixels by considering the topology of the image and the initialization provided.
Deformable Contour Model
Deformable contours20 are curves or surfaces defined within an image domain that can move under the influence of internal forces, which are defined within the curve or surface itself, and external forces, which are computed from the image data. The internal forces are designed to keep the model smooth during deformation, whereas the external forces are defined to move the model toward an object boundary or other desired feature within the image.
The deformable contour is modeled as a closed curve C(s) = (X(s), Y(s)), for s ∈ [0, 1]. Here, s indicates a point or pixel on the contour. The contour moves through the image domain under the influence of internal forces Fint(C) and external forces Fext(C), which deform and displace the contour. The internal and external forces are designed to adjust the contour to a configuration that approximates the boundary of the object of interest, while being bound or limited by smoothness and continuity constraints. The contour is modeled as an elastic string subjected to a set of forces, as follows:
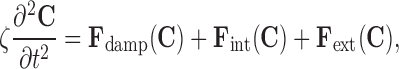 |
1 |
where ζ is the specific mass of the contour and t refers to time. The internal force20 is given by
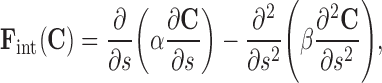 |
2 |
where the parameters α and β control the model’s tension and rigidity. The damping force is given by
 |
3 |
where γ is the viscosity constant; a viscous force is introduced to stabilize the deformable contour around the static equilibrium configuration. The external force Fext(C) is given by the characteristics of the image. The external force pushes the contour toward the object’s boundary.
In image segmentation, the mass of the contour is often assumed to be 0, resulting in the following equation:
 |
4 |
Discretizing the equation above permits the implementation of the deformable contour technique as a numerical simulation problem. The spatial and temporal derivatives are approximated by finite differences.
External forces influence the ability of the contour to deform to the boundaries of the objects in the image. Traditional methods of computing these forces (i.e., image gradients) have limited capture ranges, which reduce the contour’s ability to deform to actual boundaries.23 To increase the capture range of the deformable contour model, Xu and Prince23 presented a method, called gradient vector flow (GVF). GVF extends the influence of the external force through the use of a vector diffusion equation. The GVF field (u(x, y), v(x, y)) is defined as the solution of the following system of differential equations:
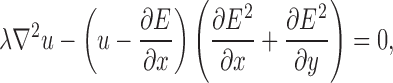 |
5 |
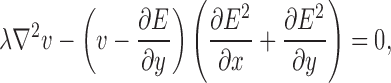 |
6 |
where E represents the external energy derived from the image, and the arguments (x, y) have been removed for clarity. The parameter λ is a regularization parameter that controls the amount of smoothness in the GVF field. The system of differential equations can be solved through discretization using finite differences, followed by numerical simulation.
To enhance further the uniformity and extent of the external forces, in the present work, the following mapping function is applied to the gradient magnitude of the edge map:
 |
7 |
where  represents the gradient magnitude of the edge map, C1 determines the rate of convergence, and C2 determines the asymptote of convergence.
A similar mapping function is also used to remap the GVF as
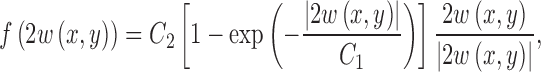 |
8 |
where w(x, y) is a vector of the GVF components, w(x, y) = [u(x, y) v(x, y)]T. The mapping functions in Eqs. 7 and 8 saturate high values at an upper bound, while amplifying small values.
Methodology
The diaphragm is located directly below the lungs; therefore, the lungs serve as a natural starting point for the procedure for the detection and segmentation of the diaphragm. Once the lungs have been delineated, the lower lung surface (diaphragmatic lung surface) is used to compute a quadratic model of the surface of the diaphragm. The model is subsequently refined to obtain the final surface of the diaphragm. The procedure, which is illustrated in the flowchart in Figure 1, is described in detail in the following sections.
Fig 1.

Flowchart for the delineation of the diaphragm. LLS refers to the linear least-squares procedure.
Segmentation of the Lungs
A few methods have been described in the literature for the segmentation of the lungs in CT images. Prasad and Sowmya24 used several morphological image processing methods to segment the lungs in CT images. Zrimec and Busayarat25 proposed the use of morphological image processing methods and active contours to achieve segmentation of the lungs. Brown et al.26 proposed a method including the use of seeded region growing, edge tracking, and knowledge-based segmentation for the assessment of differential left and right lung function.
In the present work, the lungs are segmented according to the method proposed by Hu et al.,27 with a modification to account for the size and proportions of anatomical structures in children. The procedure is based on the fact that the lungs form the single largest volume of air in the body. In addition, the contents of the lungs comprise mostly low-density tissues (i.e., alveoli) and air, making them readily distinguishable from the surrounding structures. It is assumed that there are two types of voxels in the image data: nonbody voxels of the low-density voxels in the lungs and in the air surrounding the body of the patient and body voxels corresponding to voxels within the dense body and chest wall structures.27 An optimal thresholding technique is used to separate the body and nonbody voxels and subsequently to identify the lungs.
The lungs are segmented using an iterative procedure to determine the optimal threshold. Let Ti be the threshold applied at step i to separate the image data into the two regions mentioned above. Let μb and μn denote the mean values of the body and nonbody regions after thresholding with Ti. Upon thresholding, an updated threshold for step i + 1 is computed as
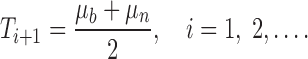 |
9 |
The updating procedure is iterated until the optimal value has been determined; that is, the algorithm continues until the threshold reaches stability, with Ti + 1 ≈ Ti. The initial threshold, T0, is based on the expected CT number for air: T0 = −1,000 Hounsfield Units (HU).
Once the optimal threshold has been determined, the nonbody voxels will correspond to the air surrounding the body, the lungs, and other low-density regions within the body, such as the air in the stomach and the bowels. The region surrounding the body is removed by using binary opening by reconstruction with a six-connected neighborhood to extract connected regions of air outside the body with a CT value of −1,000 HU. The remaining nonbody regions are grouped into disjoint regions. Using six-connected reconstruction,22 every voxel is grouped according to its spatially connected neighbors. The volume of each region is determined by counting the connected voxels that comprise the region. Small, disconnected regions are discarded if the region volume is less than 600 voxels each. Regions with volumes greater than 0.5% of the total image voxel count are considered to be the lungs.
In the case of adults, the lungs are well separated from other low-density structures, such as the air in the bowels and the stomach; however, because of the small size of organs in children and because of the limited spatial resolution of the CT image data used in the present study, such structures may be erroneously classified as parts of the lungs. To avoid this error, we propose a method to examine the cross-sectional (2D) area of the lungs on each slice of the image volume. The lungs are cone-shaped organs with increasing area toward the mid-axial point, where there is a concave cavity to accommodate the heart.10 From this point downward, the area decreases to a minimum at the lowest portions of the lungs. Any deviation from this progression, such as an increase in area near the base of the lungs, may be attributed to regions other than the lungs.
After thresholding, labeling, and analysis of the cross-sectional area, the segmented regions for the lungs are morphologically closed in 3D, with an ellipsoidal structuring element of size 5 × 5 × 3 voxels, to remove holes present in the result; that is, regions within the segmented lungs that are not connected to the outer boundary of the image are set to the same value as the lungs.
Linear Least-squares Procedure to Model the Diaphragm
Once segmentation of the lungs is achieved, the initial diaphragm model is taken to be the set of voxels comprising the base of the lungs, where each voxel vi = (xi, yi, zi), i = 1, 2,...,N, represents the lowest point, zi, of the lung surface for a given coordinate pair (xi, yi). Each dome of the diaphragm is modeled as a quadratic surface, as  . At each coordinate (xi, yi), the error between the estimated diaphragm model and the voxels representing the inferior surface of the lungs is given by
  . The error vector is defined as r = z − z′, where
 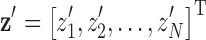 and
and 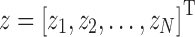 , and the squared error is given by rTr. The set of parameters
  that minimizes the squared error is defined as
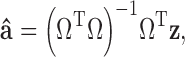 |
10 |
where
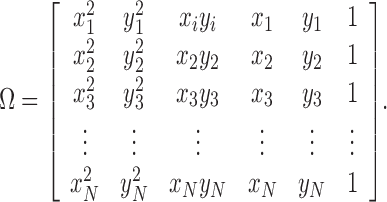 |
11 |
By solving Eq. 10, the estimated parameters are used to generate individual quadratic models for the surfaces of the left and the right domes of the diaphragm. The models are then combined to obtain a complete diaphragm model by calculating the minimum zi for every coordinate (xi, yi). The dome structures represent a good starting point for identification of the actual diaphragm. To refine the initial approximation, the deformable contour model described in “Deformable Contour Model” is used to manipulate the modeled diaphragm according to the structural information in the images. On each slice of the image volume, the contour generated by the LLS model is refined to obtain a better segmentation of the diaphragm.
Experimental Results and Discussion
CT Image Data
The CT exams used in this work are anonymous cases from the Alberta Children’s Hospital. Approval was obtained from the Conjoint Health Research Ethics Board, Office of Medical Bioethics, University of Calgary and Calgary Health Region. The nine CT exams processed are of four patients of age 2 weeks to 11 years, during the course of treatment for neuroblastoma.7,8 The exams were acquired using a GE Medical System Lightspeed QX/i or a QX/i Plus CT scanner and include contrast enhancement. The data have an interslice resolution of 5 mm, and the intraslice pixel size varies from 0.35 to 0.55 mm. The computer used to process the exams is a Dell Precision 360 Workstation with a 3.20-GHz Pentium 4 processor, with 2 MB of cache, and 2 GB of RAM.
Illustrative Examples of the Results of Segmentation
Each exam was processed according to the procedure described in “Methodology.” First, the lungs were segmented (shown in Figs. 2 and 3), and the diaphragmatic lung surface was determined automatically. The surface was then used to compute quadratic surface models for each lung, which were combined subsequently to obtain an initial model of the diaphragm. The results for the left and right domes are shown separately in Figure 4a and b, for the CT exam shown in Figures 2 and 3. The combined model, after considering the spatial extent of the diaphragm, is shown in Figure 4c. To refine the diaphragm, a deformable contour with the following parameters was used: α = 30.0, β = 10.0, C1 = 0.1, C2 = 1.0, and λ = 0.1 (see Eqs. 2, 5, 6, 7, and 8). The values of the parameters were chosen based on experimentation.
Fig 2.

Two 512 × 512 cross-sectional CT slices of a patient: a slice 19 out of 75 slices. b Result of extracting the lung region from a. c Slice 23. d Result of extracting the lung region from c. The corresponding 3D representation is shown in Figure 3.
Fig 3.

3D representation of the result of segmenting the lungs. The bone structure is shown for reference. Representative 2D slices are shown in Figure 2.
Fig 4.

Initial model of the diaphragm for the CT exam shown in Figures 2 and 3. a Model of the right dome surface. b Model of the left dome surface. c Unified model of the diaphragm obtained by combining a and b. The axes are labeled in voxels.
The results of application of deformable contours to the output of the LLS model are shown in Figures 5 and 6. Figure 5a depicts CT slice 20 out of 75 of a patient. This slice is near the top of the true diaphragm’s surface. The initial approximation of the diaphragm, which is the contour shown in white, is an overestimation of the diaphragm; it encloses the diaphragm, as well as parts of the lungs and heart. Following the refinements made by the deformable contour model, the final contour, shown in Figure 5b, represents the diaphragm more precisely. Even with increased error in the initial approximation of the diaphragm, as shown in Figure 5c for another CT slice, applying the deformable contours results in a good definition of the diaphragm (see Fig. 5d). In this case, the contour did not fully converge near the vertebral column; however, this results in only a slight overestimation of the diaphragm near the vertebrae. The segmentation of the diaphragm with parts protruding into the bone structures could result in an overestimation of the diaphragm and subsequently an overestimation of the abdominal cavity in some cases. An error as above would pose only a minor problem in applications where the spinal canal is not a source of complication.
Fig 5.

a Initial approximation of the diaphragm on CT slice 20 out of 75 slices, near the top of the true diaphragm’s surface. b Refined results from a after the application of a deformable contour model. c Initial contour to approximate the diaphragm on CT slice 25 out of 75 slices, which is toward the bottom of the true diaphragm’s surface. d Result of application of the deformable contour model to c. The CT images shown are after the removal of peripheral artifacts, skin, peripheral fat, and peripheral muscle.
Fig 6.

a 3D representation of the initial approximation of the diaphragm (top-down view) for the CT exam illustrated in Figures 2 to 5. b Final representation of the diaphragm after applying a deformable contour model to the approximation in a. This is a top-down view of the diaphragm. c Bottom-up view of the initial approximation of the diaphragm in a. d Bottom-up view of the final, refined representation of the diaphragm in b.
3D representations of the initial approximation of the diaphragm and the refined representation are shown in Figure 6. The lungs are shown for reference. As described previously, the initial model of the diaphragm is an overestimation. This is shown in Figures 6a and c as the protrusion of the diaphragm’s surface below the lungs. However, following the application of the deformable contours, the final representation of the diaphragm is more accurate and contained within the body (see Figures 6b and d). The effect of removing the thoracic cavity from the CT volume in Figure 7 is shown in Figure 8; the lungs have been shown for reference.
Fig 7.

3D depiction of a patient’s skin surface after the removal of the external air and artifacts. The body extends from just below the pelvis at the bottom, to top of the clavicle.
Fig 8.

3D depiction of the patient in Figure 7 with the thoracic cavity removed. The lungs are shown for reference.
Qualitative Analysis of the Results of Segmentation
After the segmentation of the diaphragm, the results were evaluated in 2D on a slice-by-slice basis by comparing the 2D contours with those segmented manually and independently by a radiologist (Boag). Selected CT slices are shown in Figure 9. In general, the results of the proposed procedure are in good agreement with the independent segmentation of the diaphragm by the radiologist and the related contours. The procedure for the detection of the diaphragm could produce results which differ from the manual delineation by an experienced observer. Deviations could arise because of interslice partial-volume averaging, as shown in Figure 9d. In this figure, partial-volume averaging has affected the distinction between the heart and the liver, and the proposed procedure is able to resolve the confounding situation only partially. In addition, when the initial model of the diaphragm has sections near the vertebral column, the final result could encompass the paravertebral muscle, as may be seen in Figure 9b and c. The deformable contour model attempts to converge to the nearest boundaries in the area, which are in fact the bone–muscle interface at the vertebrae in the CT slice illustrated: This has resulted in an overestimation of the diaphragm, leading to an overestimation of the abdominal cavity. For the purpose of our final application,14 which is the segmentation of abdominal tumors because of neuroblastoma,7,8 the proposed procedure for automatic detection of the diaphragm is effective in limiting the tissue volume to be processed, with low probability of excluding portions of the primary tumor.
Fig 9.

Four 512 × 512 cross-sectional CT slices of two patients with the diaphragmatic contours shown. In each case, the solid line denotes the contour of the diaphragm as drawn independently by a radiologist (Boag), and the dashed line that produced by the proposed procedure. a Exam 1.1, slice 20. b Exam 1.1, slice 22. c Exam 1.1, slice 25. d Exam 4.3, slice 32.
Quantitative Analysis of the Results of Segmentation
The Hausdorff distance16 is a useful measure to evaluate the mismatch between two contours. The Hausdorff distance determines the degree of mismatch between two sets by measuring the distance separating the points of either set. Given two finite point sets A = {a1, a2,..., aM} and B = {b1, b2,..., bN}, the Hausdorff distance H(A,B) is defined as
 |
12 |
where
 |
13 |
and  is some norm (e.g., the Euclidean norm) computed for the points of A and B.16 The function h(A,B) is known as the directed Hausdorff distance from A to B. It determines the point a ∈ A that is farthest from any point in B and measures the distance.
A measure comparable to the Hausdorff distance was proposed by Xu et al.17 to evaluate quantitatively the degree of affinity between two sets. The measure, known as the MDCP of ground truth, computes the average distance to the closest point (DCP) between two sets; see Saha et al.28 for a related measure and discussion. Given two sets A = {a1, a2,..., aM} and B = {b1, b2,..., bN}, DCP is defined as
 |
14 |
where  is some norm (e.g., the Euclidean norm) computed for the points ai and bj. MDCP is then defined as
 |
15 |
The smaller the value of MDCP is, the more similar the two sets are to each other. Although MDCP is a useful measure, it is not a metric.
In the present work, we use the Hausdorff distance and MDCP to compare the contour of the diaphragm obtained by the proposed method for each CT slice, with the corresponding contour drawn independently by a radiologist. The results are listed in Table 1. The Hausdorff distance was computed for each CT slice where a section of the diaphragm was present, for each CT exam. The minimum (min), average (mean), and standard deviation (SD) were computed for each CT exam, across all 2D slices containing a section of the diaphragm. The final Hausdorff distance for the entire diaphragm in 3D was then determined as the maximum Hausdorff distance over all individual 2D slices for each CT exam. The MDCP was calculated on each slice of the dataset, where a section of the diaphragm was present, and averaged over each CT exam. Over the nine CT exams of the four patients processed, a total of 73 CT slices contained sections of the diaphragm. The dataset processed is relatively small because of the difficult and time-consuming task of manual delineation of the contours of the diaphragm on 3D CT exams.
Table 1.
Hausdorff Distance Computed between the Contours of the Diaphragm Resulting from the Proposed Method and Those Drawn Independently by a Radiologist (Boag)
| CT exam | Number of CT slices with diaphragm | 2D Hausdorff distance section-by-section (mm) | Hausdorff distance over entire diaphragm in 3D (mm) | MDCP over entire diaphragm in 3D (mm) | ||
|---|---|---|---|---|---|---|
| Minimum | Mean | SD | ||||
| 1.1 | 9 | 5.37 | 14.46 | 5.14 | 21.63 | 3.71 |
| 1.2 | 9 | 8.56 | 15.50 | 7.79 | 34.32 | 4.05 |
| 1.3 | 9 | 9.85 | 14.57 | 3.66 | 19.60 | 4.76 |
| 2.1 | 8 | 4.69 | 17.91 | 7.93 | 26.89 | 8.01 |
| 3.1 | 7 | 4.84 | 8.65 | 3.11 | 13.46 | 3.21 |
| 3.2 | 6 | 6.49 | 10.79 | 6.23 | 22.47 | 5.02 |
| 4.1 | 8 | 13.72 | 19.62 | 2.57 | 22.52 | 9.53 |
| 4.2 | 9 | 5.09 | 18.80 | 8.86 | 32.98 | 7.61 |
| 4.3 | 8 | 3.99 | 15.50 | 7.76 | 27.50 | 6.75 |
| Total | 73 | Overall average | 24.60 | 5.85 | ||
The Hausdorff distance for an entire diaphragm in 3D is the maximum Hausdorff distance over all individual 2D slices containing a section of the diaphragm in the corresponding CT exam. The MDCP for an entire diaphragm in 3D is the average of the MDCP over the related 2D slices in the corresponding CT exam. All distances are in millimeters.
Mean Average, SD standard deviation
The average error in the results of the proposed procedure is 24.6 mm, in terms of the average Hausdorff distance in 3D. However, the overall 3D Hausdorff distance, being the maximum of the Hausdorff distances over all of the related 2D slices, is significantly larger than the corresponding mean Hausdorff distance in all cases because of isolated cases of slices in which there was an overestimation of the diaphragm. This is indicated by the large deviation in the results for a given exam, as shown in Figure 9 and Table 1. On the other hand, because an average of the distances around the contours is used to derive the MDCP, the corresponding result is robust to isolated variations: The average MDCP of 5.85 mm over the nine CT exams is, therefore, a reliable indicator of the accuracy and success of the proposed method.
Conclusion
Segmentation of the diaphragm provides an approach to restrict and constrain the scope of algorithms for segmentation of organs and tumors, and serves as a potential landmark for identifying contiguous structures. We have proposed a method to segment the diaphragm automatically, based on the spatial proximity of the muscle to the lungs. The method provided good results, with an average MDCP of 5.85 mm over a total of 73 CT slices including the diaphragm obtained from nine CT exams of four pediatric patients with neuroblastoma. Further tests are warranted to determine the effect of the spatial resolution of the CT image on the accuracy of segmentation of the diaphragm. In the present work, the proposed methods were applied to CT images with poor interslice resolution. It could be expected that the methods will provide higher accuracy with CT images possessing higher spatial resolution, lower interslice distance, and lower error because of the partial-volume effect. Further work is also required to determine optimal parameters of the deformable contour model used.
Although the overestimation of the abdominal cavity encountered in some CT slices is favorable in our application of segmenting abdominal tumor masses, it is necessary to refine the algorithm further to improve the accuracy of identification of the diaphragm near the vertebrae.
In the cases examined in the present work, there were no significant pathological abnormalities of the diaphragm. In cases affected by pathology of the diaphragm, the results of the proposed procedure may be compromised by shapes of the diaphragm that do not agree with the quadratic surface model. As part of future work, it will be necessary to test the procedure on a larger dataset and examine the results when the procedure is applied to cases with abnormalities of the diaphragm.
Acknowledgments
We thank the Kids Cancer Care Foundation of Alberta and the Natural Sciences and Engineering Research Council of Canada for their support for this work.
References
- 1.Kobashi M, Shapiro LG. Knowledge-based organ identification from CT images. Pattern Recogn. 1995;28(4):475–491. doi: 10.1016/0031-3203(94)00124-5. [DOI] [Google Scholar]
- 2.Qatarneh SM, Crafoord J, Kramer EL, Maguire GQ, Jr, Brahme A, Noz ME, Hyödynmaa S. A whole body atlas for segmentation and delineation of organs for radiation therapy planning. Nucl Instrum Methods Phys Res A. 2001;471(1):160–164. doi: 10.1016/S0168-9002(01)00984-6. [DOI] [Google Scholar]
- 3.Qatarneh SM, Noz ME, Hyödynmaa S, Maguire GQ, Kramer EL, Crafoord J. Evaluation of a segmentation procedure to delineate organs for use in construction of a radiation therapy planning atlas. Int J Med Inform. 2003;69:39–55. doi: 10.1016/S1386-5056(02)00079-5. [DOI] [PubMed] [Google Scholar]
- 4.Park H, Bland PH, Meyer CR. Construction of an abdominal probabilistic atlas and its application in segmentation. IEEE Trans Med Imag. 2003;22(4):483–492. doi: 10.1109/TMI.2003.809139. [DOI] [PubMed] [Google Scholar]
- 5.Archip N, Erard PJ, Egmont-Petersen M, Haefliger JM, Germond JF. A knowledge-based approach to automatic detection of the spinal cord in CT images. IEEE Trans Med Imag. 2002;21(12):1504–1516. doi: 10.1109/TMI.2002.806578. [DOI] [PubMed] [Google Scholar]
- 6.D’Haese P, Niermann KJ, Cmelak AJ, Joshi P, Dawant B. Automatic segmentation of the human spinal canal using an intelligent digital atlas. Int J Radiat Oncol Biol Phys. 2004;60:S579–S580. doi: 10.1016/j.ijrobp.2004.07.571. [DOI] [Google Scholar]
- 7.Deglint HJ, Rangayyan RM, Ayres FJ, Boag GS, Zuffo MK. Three-dimensional segmentation of the tumor in computed tomographic images of neuroblastoma. J Digit Imaging. 2007;20(1):72–87. doi: 10.1007/10278-006-0769-3. [DOI] [PubMed] [Google Scholar]
- 8.Vu RH, Rangayyan RM, Deglint HJ, Boag GS. Segmentation and analysis of neuroblastoma. J Franklin Inst. 2007;344(3–4):257–284. doi: 10.1016/j.jfranklin.2006.11.002. [DOI] [Google Scholar]
- 9.Rangayyan RM, Deglint HJ, Boag GS. Method for the automatic detection and segmentation of the spinal canal in computed tomographic images. J Electron Imaging. 2006;15(3):033007. doi: 10.1117/1.2234770. [DOI] [Google Scholar]
- 10.Chaffee EE, Greisheimer EM. Basic Physiology and Anatomy. 3. New York, NY: Lippincott; 1974. [Google Scholar]
- 11.Tortora GJ. Principles of Human Anatomy. 10. Hoboken, NJ: Wiley; 2005. [Google Scholar]
- 12.Keatley E, Mageras G, Ling C: Computer automated diaphragm motion quantification in a fluoroscopic movie. In: Proceedings of the 22nd Annual International Conference of the IEEE Engineering in Medicine and Biology Society, Chicago, IL, July 2000, pp. 1749–1751
- 13.Beichel R, Gotschuli G, Sorantin E, Leberl F, Sonka M: Diaphragm dome surface segmentation in CT data sets: a 3D active appearance model approach. In: Proceedings of the SPIE International Symposium on Medical Imaging: Image Processing, volume 4684, San Diego, CA, May 2002, pp 475–484
- 14.Rangayyan RM, Vu RH, Boag GS: Delineation of the diaphragm in CT images to improve segmentation of the tumor mass in neuroblastoma. In: Proceedings of CARS 2006: 20th International Congress and Exhibition—Computer Assisted Radiology and Surgery, Osaka, Japan, 2006, pp 78–80
- 15.Zhou X, Ninomiya H, Hara T, Fujita H, Yokoyama R, Chen H, Kanematsu M, Hoshi H: Automated identification of diaphragm in non-contrast torso CT images and its application to computer-aided diagnosis systems. In: Proceedings of CARS 2006: 20th International Congress and Exhibition—Computer Assisted Radiology and Surgery, Osaka, Japan, 2006, pp 366–367
- 16.Huttenlocher DP, Klanderman GA, Rucklidge WJ. Comparing images using the Hausdorff distance. IEEE Trans Pattern Anal Mach Intell. 1991;15(9):850–863. doi: 10.1109/34.232073. [DOI] [Google Scholar]
- 17.Xu J, Chutatape O, Chew P. Automated optic disk boundary detection by modified active contour model. IEEE Trans Biomed Eng. 2007;54(3):473–482. doi: 10.1109/TBME.2006.888831. [DOI] [PubMed] [Google Scholar]
- 18.Dougherty ER. An Introduction to Morphological Image Processing. Bellingham, WA: SPIE; 1992. [Google Scholar]
- 19.Giardina CR, Dougherty ER. Morphological Methods in Image and Signal Processing. Englewood Cliffs, NJ: Prentice Hall; 1988. [Google Scholar]
- 20.Xu C, Pham DL, Prince JL. Image segmentation using deformable models. In: Sonka M, Fitzpatrick JM, editors. Handbook of Medical Imaging: Medical Image Processing and Analysis. Bellingham, WA: SPIE; 2000. pp. 129–174. [Google Scholar]
- 21.Goutsias J, Batman S. Morphological methods for biomedical image analysis. In: Sonka M, Fitzpatrick JM, editors. Handbook of Medical Imaging: Medical Image Processing and Analysis. Bellingham, WA: SPIE; 2000. pp. 175–272. [Google Scholar]
- 22.Vincent L. Morphological grayscale reconstruction in image analysis: Applications and efficient algorithms. IEEE Trans Image Process. 1993;2(2):176–201. doi: 10.1109/83.217222. [DOI] [PubMed] [Google Scholar]
- 23.Xu C, Prince JL. Snakes, shapes, and gradient vector flow. IEEE Trans Image Process. 1998;7(3):359–369. doi: 10.1109/83.661186. [DOI] [PubMed] [Google Scholar]
- 24.Prasad MN, Sowmya A: Detection of bronchovascular pairs on HRCT lung images through relational learning. In: Proceedings of IEEE International Symposium on Biomedical Imaging: Nano to Macro, 2004, pp 1135–1138
- 25.Zrimec T, Busayarat S: A system for computer aided detection of diseases patterns in high resolution CT images of the lungs. In: Proceedings of 20th IEEE International Symposium on Computer-Based Medical Systems, Maribor, Slovenia, June 2007, pp 41–46
- 26.Brown MS, Goldin JG, McNitt-Gray MF, Greaser LE, Sapra A, Li K-T, Sayre JW, Martin K, Aberle DR. Knowledge-based segmentation of thoracic computed tomography images for assessment of split lung function. Med Phys. 2000;27(3):592–598. doi: 10.1118/1.598898. [DOI] [PubMed] [Google Scholar]
- 27.Hu S, Hoffman EA, Reinhardt JM. Automatic lung segmentation for accurate quantitation of volumetric X-ray CT images. IEEE Trans Med Imag. 2001;20(6):490–498. doi: 10.1109/42.929615. [DOI] [PubMed] [Google Scholar]
- 28.Saha PK, Chaudhuri BB, Majumder DD. A new shape preserving parallel thinning algorithm for 3D digital images. Pattern Recogn. 1997;30(12):1939–1955. doi: 10.1016/S0031-3203(97)00016-2. [DOI] [Google Scholar]