Abstract
This paper presents a method to provide contrast enhancement in dense breast digitized images, which are difficult cases in testing of computer-aided diagnosis (CAD) schemes. Three techniques were developed, and data from each method were combined to provide a better result in relation to detection of clustered microcalcifications. Results obtained during the tests indicated that, by combining all the developed techniques, it is possible to improve the performance of a processing scheme designed to detect microcalcification clusters. It also allows operators to distinguish some of these structures in low-contrast images, which were not detected via conventional processing before the contrast enhancement. This investigation shows the possibility of improving CAD schemes for better detection of microcalcifications in dense breast images.
Key words: Image processing, contrast enhancement, dense breasts, microcalcifications, mammography
Introduction
Computer-aided diagnosis (CAD) schemes have been developed for early detection, in which a computerized analysis is made of radiographic images with the results corresponding to a “second opinion” for the radiologist in detecting lesions and performing the diagnosis.1 Most CAD schemes are developed for X-ray mammography, still the most efficient technique for early detection of breast cancer. However, in some cases, visual inspection of a mammogram is not sufficient to detect problems. Indeed, it is estimated that mammography exams fail to detect the disease for 10–30% of the women with breast cancer.2 The main purpose of computational applications in mammography is to identify structures that may be associated with tumors, including microcalcifications. Clusters of microcalcifications are important because when more than 10 structures are noted in the same region, the probability of the lesion being a carcinoma is bigger greater than 60%.3
The main requirement for computational methods to detect microcalcifications in mammograms is to keep the shape and the size of individual image structures. The techniques used in CAD schemes are diversified. Several types of filters and techniques using region growing, thresholding, mathematical morphology, and artificial neural networks have been applied.4–6 Roehrig et al. showed the results of these techniques in a commercial system.6 Statistical methods in texture analysis designed to detect and classify clusters of microcalcifications on mammograms were described by Kim and Park,7 whereas Gavrielides et al.8 proposed a multistage CAD scheme to detect possible clustered microcalcifications on digital mammograms. Scale-space signatures9 and wavelet transforms10 have also been used for the same purpose.
In spite of these substantial efforts, an important challenge remains: detection in dense breast images. Most young women have high-density breasts due to the predominance of fibroglandular tissues. In a study made by our group aimed at composing an image database, we discovered that about 15% of women in the study (Brazilian) population had dense breasts. During X-ray exposure, absorption by fat is smaller compared to that by fibers—which appears whiter on mammograms. These structures have lower optical density rates,11 being similar to microcalcifications. The recognition of structures characteristic of cancer is made by contrast difference, which harder to carry out in dense breast images because the difference in gray levels between the background and the structures of interest is small.
Breast density has received little attention in the field of image processing. Contrast in mammograms is often investigated in a general way, with no direct attention to dense breast images. In some papers, dense breast is considered as a source of problems, because its imaging decreases the performance of CAD schemes. In recent years, we have instituted a project to develop processing techniques for mammograms to detect breast cancer at an early stage. A computational procedure embedded in a CAD scheme made it possible to detect clusters of microcalcifications in “normal” mammograms (fat predominating over fibers) with an accuracy of 94%.12 To improve images for CAD processing, we developed contrast enhancement techniques based on the physical characteristics of this kind of image.
Methods
Two factors contribute significantly to degrade the performance of a CAD scheme using mammogram as input data source: (1) the contrast resolution, which is the amount of gray levels used, and (2) the low contrast between the structures of interest and the background. The first problem was solved by using a bigger quantity of bits in the image digitization. To solve the second one, we studied the characteristics of dense breast images to compose three specific image processing techniques (as will be discussed later). Although these techniques use several known concepts of image processing, they may still be considered original because they were developed to consider aspects of breast images, their acquisition, and digitization. One of these factors was previously proposed,13 but we modified it to suit the needs of our images. The other two were created to address the necessity of contrast enhancement specifically in cases of dense breast images.
For the tests, 200 regions of interest (ROIs) were exclusively extracted from 121 dense breasts mammograms, 50% of which were positive (with clustered microcalcifications) and 50% negative (without clusters). The presence (or absence) of clusters was decided based on radiological reports for each case. Clustered microcalcifications are usually related to malignant cases. However, we did not separate cases of benign and malignant microcalcifications. The mammograms were digitized in a Lumiscan (Lumisys, Inc.) scanner, with 12 bits and 0.15 mm of contrast and spatial resolution, respectively. For the positive images, ROIs were selected visually, with the help of a physician and also using the description of their location from the medical report. The negative ROIs were extracted randomly from the mammograms corresponding to the “negative cases” described above. Prior to our study, we obtained approval from the local ethics committee to use these images.
Contrast Enhancement by Histogram Gray Levels Transformation (HTE)
For the transformation of histogram levels,13 an optimal classification of gray levels was performed in order to classify them into classes and apply a local parametric transformation in each class. Contrast enhancement is provided via a monotonic function, which maintains the same relationship regarding the original gray levels. This transformation allowed us to divide the gray levels into a given number of classes, which represent homogeneous regions. The purpose is to enhance the global contrast by increasing the homogeneity inside the image regions. Given a range of gray levels [Xmin, Xmax], a partition in N classes is performed: [Xi, Xi + 1], i = 0, ..., n − 1. Each class is then mapped into a new class [Yi, Yi + 1]. The transformation corresponds to the equation:
 |
1 |
where
 |
2 |
 |
3 |
From the number of classes chosen for the partitioning, a minimum square error criterion is used to find the best classification based on the probability density function p(x), which in practice results in the image histogram. The homogeneity is increased by a monotonic transformation which is concave at the interval [Xi, Gi] and convex at the interval [Gi, Xi + 1], with inflection at the point (Gi, Yim = (Yi + Yi + 1) / 2), where Gi is the centroid of [Xi, Xi + 1]: this point is intended to concentrate the resulting gray levels around Yim. Equation (1) defines the transformation convex part, and the concave part is obtained from the rotation and translation of this function, by using the same coefficient r.
We employed this technique for dense breast images after optimization of parameters to enhance the contrast of microcalcifications in addition to reducing the noise. In the first step of the method, the image histogram is developed to determine the original gray level interval and, thus to establish the parameters required for the definition of the final interval with the corresponding classes. From the original histogram, the interval defined at left by the gray minimum value and at right by its maximum is divided by the number of classes determined by the parameters. Then, for each subinterval obtained, the centroid is calculated. The redistribution of intensity levels is applied: each original class is mapped in its respective final class—by applying Equation (1) to the interval before the centroid, and by the same equation rotated and translated in the interval after the centroid. The result (mapping) indicates the new gray value for each original histogram level.
Contrast Enhancement by the Attenuation Coefficients (ACE)
X-rays are attenuated when they interact with matter to an extent that depends on the object composition, density, and thickness. The linear attenuation coefficient (μ) summarizes this phenomenon, and is used to determine the radiation intensity after attenuation, following the Lambert–Beer equation:
 |
4 |
where I is the radiation intensity transmitted from the object, I0 is the incident radiation intensity, μ is the linear attenuation coefficient, and x is the object thickness.
In the ACE technique, the emphasis is placed in distinguishing between signals from microcalcifications and other tissues. Figure 1 shows a scheme of breast parts with and without microcalcification. In terms of contrast, the characteristics and number of photons that will impinge on the mammographic film will be different, because in the region without microcalcification more absorption should occur, and, consequently, the final image should be clearer in this range. The final energy in the region without microcalcification is named Ism, and in the region with microcalcification, Icm. To calculate Ism, one needs to have the linear attenuation coefficients and the thickness of fat and fibroglandular tissues. For the calculation of Icm, the thickness and attenuation coefficient of the microcalcification are also required. By considering the tissues involved in the breast composition, Equation (4) is modified to:
 |
5 |
where I/I0 is the absorbed energy, μi is the linear attenuation coefficient for tissue i, and xi is the tissue i thickness.
Fig 1.
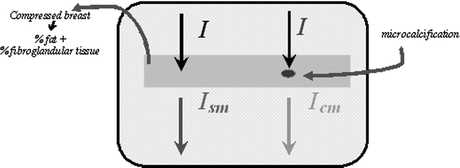
Scheme showing the resulting energy after attenuation in parts of the breast with and without microcalcification.
Equation (5) is thus used to enhance signals in the image by executing four steps: (1) absorbed energy calculation, (2) intensity levels normalization, (3) redistribution of intensity levels, and (4) final image recording. First, the parameters for enhancement processing are determined to fit a single image or an image set to be processed. This process is facilitated by using automatic procedures to estimate some of the parameters, while others were obtained from the literature or from experimental observations. The attenuation coefficients for the tissues are determined by tabulated data for the materials comprising each tissue,14 from which the transmitted intensities Ism and Icm are obtained via Equation (5). Normalized intensities are used to compare with the image pixels for the redistribution of gray levels. The ratio between intensities for tissues without or with microcalcifications is then estimated:
 |
6 |
where Ism is the final intensity in the region without microcalcification and Icm is the final intensity in the region with microcalcification.
After normalization of pixels values, they are redistributed so that the contrast among the structures present in the image is increased. Initially, an enhancement factor is calculated via Equation (7). Next, the pixel value is changed, according to the scheme presented in Figure 2. Lastly, the gray levels are converted again to the original gray scale, the largest gray level being chosen as the maximum value of the gray scale and the others converted into values proportional to this.
 |
7 |
where NC is the pixel gray level and MaxC is the gray scale maximum value.
Fig 2.
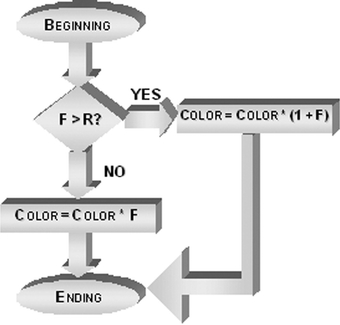
Fluxogram for redistributing the gray levels in the ACE technique.
Enhancement by Fitness of the Radiographic Film Characteristic Curve (CCE)
The characteristic curve of a radiographic film provides the relationship between the exposure and the optical density recorded. Two ranges are critical: the base and the shoulder of the curve, located respectively at the beginning and at the end of it. Indeed, they represent a contrast reduction because the respective exposure values correspond practically to only one value of optical density in each range. Therefore, we propose to perform a transformation on the digitized image to account for the influence of film sensitometric characteristics on the image contrast. This transformation basically consists of making a linear distribution in the final histogram range—corresponding to the base of the film characteristic curve. We have chosen a linear function because our aim is to distribute the gray levels in the most equal manner possible along the interval of the final part of histogram. Thus, a stretching is performed for the histogram range corresponding to the curve base.
First, the image histogram is built to identify the gray level interval to be made linear. The second step consists of stretching the histogram considering only the interval determined in the previous step. For linearization, the line equation (Equation 8) was used. In practice, an interval of gray levels [xa, xb] is transformed into an interval [ya, yb], so that the gray levels are uniformly distributed inside the final interval. The value xa should then correspond to ya, whereas xb is related to yb. The transformation is given by a segment passing through the points A(xa, ya) and B(xb, yb), with xa ≠ xb and ya ≠ yb. Once the line equation defining the transformation to be performed is found, the image is scanned and the gray levels of the original interval are changed to the final interval. The purpose is to obtain a spread relative to the last part of the histogram corresponding to the characteristic curve basis.
 |
8 |
where m = −a/b (general line equation, Equation 9) and q = −c/b (general line equation, Equation 9).
 |
9 |
where a = ya − yb, b = xb − xa, c = (xa·yb) − (xb·ya).
Reducing the False Positive Rates
A common and important concern in contrast enhancement is the simultaneous increase in noise in most cases, particularly when small structures are being considered as in the present research. To minimize the increase in false positives due to the increase in noise, we developed a rule-base method where the heuristics were established by a close, systematic inspection of images with visible microcalcifications. Threshold values were estimated for parameters such as area, contrast, compactness, and irregularity of the microcalcification structures. In the first step of this procedure, each structure is located on the segmented image using area-point transformation (APT).12,15 From this identification, the signal is located on the original image, as shown in Figure 3. The pixel values found on the original image are used for calculating the gray level average of the signal, its neighborhood, and its perimeter, which will be used as factors in deciding whether the structure under investigation will be kept or eliminated from the image.
Fig 3.
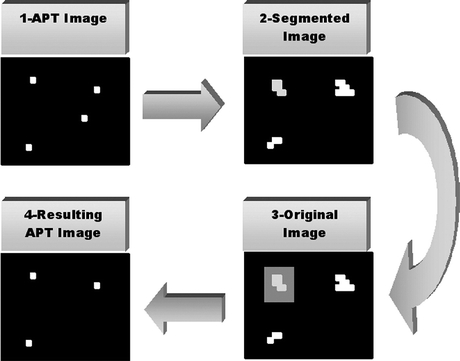
Scheme representing the procedure FPR.
After determining the characteristic measures for each signal, the threshold values are used for eliminating the signals probably corresponding to noise. This elimination consists of blacking the corresponding pixel on the image resulting from the APT.
Results and Discussions
Some of the techniques described for handling dense breast images did not present the expected results when used separately. However, they presented interesting results when applied in combination with others. To check the usefulness, advantages, and concerns of each procedure, the test results for each technique are presented, leading to the final scheme presented in this study (combining the procedures described in the previous sections). For each method, the results were obtained with the processing of an image set in its original form and after the respective technique is applied, as well as the detection rates before and after the procedures were run. To analyze each method, we constructed the ROC curve with the false positive and true positive results. A result was considered true positive when a microcalcification cluster was indicated in a positive image, and false positive when a cluster was identified in a negative image. The same parameters were used for all tests with individual and grouped techniques in the final scheme.
The parameter standard deviation (SD), used during segmentation process, featured some variation to allow for the varying sensitivity of the scheme. This parameter is used as a measure for a local adaptive threshold procedure that defines the final value of a pixel in a binary image. First, the global gray average of the image is computed. Then, for each region with 5 × 5 pixels, the standard deviation is computed and multiplied by the value provided by this parameter. This result is summed to the global gray average previously obtained. If the pixel value is greater than this last result, it will be white in the binary image; otherwise, it will be black. Subsequently, this parameter allows the user to increase or to decrease the scheme sensitivity.
HTE Results
After several parameters were tried, the best results were finally obtained with histograms for three classes and power 2 for the fitness function. Figure 4 shows the data for true and false positive cases, respectively. The number of detected clusters in Figure 4(a) did not depend on SD. The performance of the HTE technique was slightly better than the original set, as indicated in the first and latter parts of the curve. In the range 4.0–6.5, the original set is slightly better. Upon analyzing the resulting images, we noted that even with these SD values, microcalcifications were detected on the enhanced images, but were insufficient in number to be classified as a cluster. At the end of the curve the HTE set performance also decreased. Image analysis showed that some microcalcifications were combined, and were consequently counted only as one after the APT step. Two features should be stressed: (1) the images of the HTE set were not so sensitive to variations in the SD value, and (2) it is not possible to have accurate comparisons because the number of microcalcifications is not known, for even biopsy reports fail to provide such information. The tests thus compared the correct or incorrect number of detected clusters relative to the information provided by medical reports.
Fig 4.
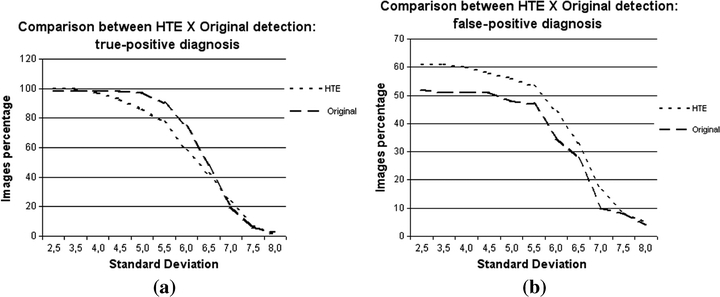
Graphics comparing the detections in original images and in images enhanced by the HTE technique: (a) percentage of true-positive detections, (b) percentage of false-positive detections.
Clusters detected in the HTE set were generally formed by a larger amount of signals in comparison to the same clusters in the original set. If, on one hand, this evidence can lead to an increase in the number of false positive detections, it is also possible that some signals could be masked or missed on the original image and identified only on the enhanced image. This feature is important because the number of signals inside a cluster is one of the factors influencing medical decisions during the diagnostic process. If the true positive results obtained by the HTE set are close to the original set results, the same does not happen for the false positive results, which can be seen in Figure 4(b). The curves are almost parallel to each other, which means that the performances of both sets were practically constant, but with different results. Indeed, except for a few points, both curves were similar: the false positive rate increased for the same SD values in both sets, whereas its decrease was also similar for the same SD values. For almost all SD values, the number of false positives was larger in the HTE set, as expected. The curves are no longer parallel in their final part, with the number of false positives being similar in both image sets for SD = 7.5. Therefore, the application of HTE increased the number of false positives, but had no significant influence when segmentation was stricter, i.e., with higher SD values.
ACE Results
In the detection of true positives (Figure 5a), for lower SDs—which provide a greater amount of remaining signals on the image—the behaviors of both image sets were similar, with the ACE set showing a slight improvement in terms of performance. The results are progressively distant as the SD value increases with the maximum difference at approximately 5.0. The curves then approximate to each other up to SD 7.0, when the results are identical. From this value onward, the ACE set performs better than the original set. As expected, contrast enhancement improves detection when the segmentation is less strict, but also increased the amount of noise. It means that in this range (low SDs), there could be also a large number of false positives, as it will be discussed later. In the next interval of SD, images from the ACE set are more sensitive to parameter variation, because the curve corresponding to the original image set decreases smoothly, more than the curve related to the ACE set. This sensitivity hampers ACE's performance, because detection of true positives is less effective for some SD values. The ACE technique enhances the image by considering the attenuation coefficients of the tissues with emphasis on a possible microcalcification on the final image. The segmentation process limits the number of white pixels remaining on the final image. Thus, pixels can be eliminated during segmentation, although they were enhanced in the previous process. In some cases, we observed remaining signals on the image after segmentation, but their quantity was not enough to be considered as belonging to a cluster (three or more signals in 1 cm2).
Fig 5.
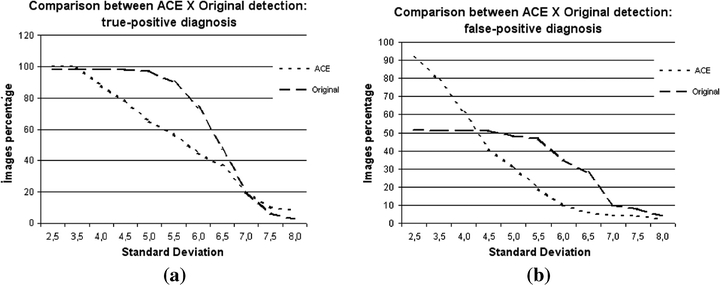
Graphics comparing the detections in original images and in images enhanced by the ACE technique: (a) percentage of true-positive detections, (b) percentage of false-positive detections.
As for the false positives, Figure 5(b) shows a large distance between the curves for small values of SD, but with the curves approaching each other for higher SDs (up to SD = 5.5). The ACE set showed a high false positive detection rate for low SDs, which decreased significantly with increasing SD, confirming a previous report that the ACE set is very sensitive to this parameter. This is attributable to the image enhancement, which creates a larger difference in the gray level between a particular signal and its neighborhood. The larger this difference becomes, the larger is the probability of this pixel being recognized as a valid signal, remaining clear in the segmented image.
The enhancement often leads to a signal composed by more pixels after segmentation. Depending on the final shape, this signal can be converted into more than 1 pixel during APT and, thus, it will be counted as more than one microcalcification during the procedure for grouping signals. After applying the ACE technique, this feature could also be noted, which corresponds to one of the causes of false positive rates for small SD values. The high false positive rate is expected because an image is enhanced: as the microcalcifications contrast increases, the noise contrast increases yielding false positive detections. Analysis of the data shows that in this same interval (low SDs), the original set has less true positives, which remain constant with SD variation. It appears that with a small contrast variation, true and wrong detections are always the same for this set. In the next part of the curve, corresponding to SD values between 6.0 and 7.0, the ACE set performed better, because a smaller number of false detections was recorded. In the last section, the ACE set again showed a larger false positive detection rate. In this range, enhancement has negative effects: some microcalcifications could be noted in the original images, which were not sufficient to form a cluster; however, the segmented images in the ACE set show more signals, forming the false cluster detected.
CCE Results
CCE technique had the smallest effect on the final results of cluster detection when applied individually on the image set. After determining the H&D curves for the mammographic films used to obtain the original mammograms, we decided to use 20% for the original histogram interval that should be made linear. This means that once the maximum gray level was determined (referred to here as maxgray), the minimum gray level, referred to as mingray, was set as 80% of maxgray. The levels inside the interval [mingray, maxgray] are redistributed to optimize the interval [mingray, 4095]. The initial interval of the histogram was not changed because microcalcifications remain clearer on the image and therefore their gray levels are in the final portion of the histogram (beginning of radiographic film characteristic curve).
The small influence of this technique is confirmed in Figure 6(a), with very similar curves for the true positive rates for both sets and across the whole interval of SD values. As with techniques discussed earlier, with small SD values better detection rates were observed for the CCE set. This was true up to the SD 4.0. However, the difference relative to the original set results is minimum, at only 1%. For SD exceeding 4.0, better results were obtained for the original set, except at SD 7.0 when the correct detections were the same for both images sets. The discussion above indicates that CCE preprocessing could be a smoothing procedure that might be useful for minimizing false positive cases. Nevertheless, in some cases, the signal resulting from the segmentation is composed by more pixels. This causes no influence on cluster identification, but it can affect the classification of detected signals, because the shape is one of the main features used by CAD schemes when addressing a signal as malignant or benign.
Fig 6.
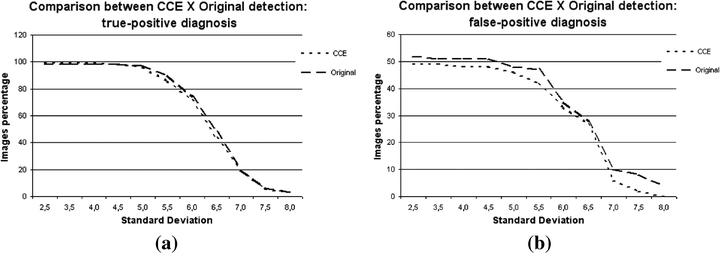
Graphics comparing the detections in original images and in images enhanced by the CCE technique: (a) percentage of true-positive detections, (b) percentage of false-positive detections.
The comparison for false positive detection rates is shown in Figure 6(b). Along the whole interval of SD variation, there were more false positive detections in the original set than in the CCE set. The curves were close to each other only at SD = 6.5, with only 1% of difference. For low SD values, the percentage difference is constant up to SD = 5.0. At the final part of the curve, for high SD values, the CCE set again shows a decrease in the number of false positives. The difference in this interval reaches 6%. This last portion of the figure deserves special attention, because the analysis of the two graphics (true positive and false positive rates) allows one to conclude that in the same range the false positive cases have decreased, but without reducing the true positive ones. This confirms the prediction that in some cases the CCE preprocessing technique may reduce the false positive detection rate without hampering the scheme sensitivity. In conclusion, although the CCE technique does not enhance the images significantly, it may be useful if combined with the other techniques, because itcan cause the number of false positives to decrease.
Final Scheme: Combining All the Techniques for Contrast Enhancement
Figure 7 presents the ROC curves corresponding to HTE, ACE, and CCE techniques. They were obtained from SD values variation, during the segmentation process. The area under the ROC curve (AZ) for the HTE technique was calculated as 0.70, showing a practically identical performance compared to the ACE technique, with AZ = 0.71. Nevertheless, the HTE did not have a uniform behavior according to the ROC curve: the relationship between true positive (TP) and false positive (FP) is good in some ranges and poor in others. There is a significant decrease in sensitivity (TP detection rates) as we try to reduce the FP rates, shown in the initial part of the curve.
Fig 7.
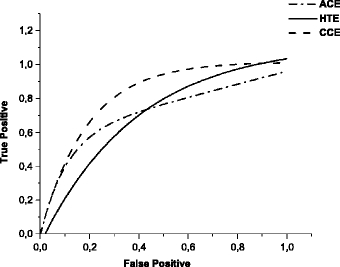
ROC curves relative to the techniques HTE, ACE, and CCE, applied individually to the images set.
We also note that the HTE technique is not so sensitive to variations in gray levels in large image regions because of radiation intensity variations. However, the disadvantage is that sometimes signals can be missed because the gray level difference between them and their neighborhood is not enough to enhance them inside their class. The signals enhanced by this technique tend to be smaller on the segmented image (when compared to signals resulting from processing with other techniques), mainly because of the subtraction performed during segmentation to separate the signal from the background. In addition, clusters detected by this technique generally have more microcalcifications than those detected via the ACE technique. In some cases, there are signals identified via the ACE technique but not detected by the HTE method. The opposite was also true: for some images, the HTE technique detected signals that are not enhanced via the ACE procedures.
The AZ value for the ACE technique is approximately 0.71. The area under the curve is smaller than for the CCE technique, and practically the same for the HTE technique. In principle, this indicates a worse performance for the ACE technique. However, ACE provided the highest rates of true positives for high SD values during segmentation, where a stricter detection occurs with low contrast signals being disregarded. This means that the technique offers great sensitivity to the processing scheme, even when a more effective reduction of signals during segmentation is required.
The analysis of processed images shows that ACE method is very efficient when applied to homogeneous images. In addition, signals enhanced by this technique normally remain larger (with more pixels). This is attributable to the nature of the technique, which compares the pixel value with a factor calculated relatively to the attenuation coefficients: this leads to a complete enhancement of the signal, if it actually exists. Other enhancement techniques (such as HTE) take into account gray levels ranges, often yielding different enhancements for the signal central region relative to the signal borders. However, some signals are smoothed in images with large variations in gray levels, because the pixel gray levels are smaller than the clearest image regions.
The ROC curve for the CCE technique shows AZ = 0.81. The area under the curve is the largest among the ROC curves, which may indicate a more adequate scheme performance. Nevertheless, other points should be also considered. The initial part of the curve is similar to the others, denoting that reducing FP detections leads to a significant reduction in TP detection. The next parts of that curve show a better relationship between FP and TP rates. The images resulting from this technique were very similar to the original ones, with few exceptions. Its effect is negligible when higher gray levels values are already distributed uniformly in the histogram, because the process performed by CCE has already been carried out. The detection results are thus close to the results obtained with the original images for which there was no contrast enhancement.
Based on the results, the following statements can be drawn: (1) none of the techniques provides an optimal TP/FP ratio when used separately; (2) processing the original dense breast images, without contrast enhancement, does not provide the required TP/FP ratio either; (3) the excessive number of false positive detections is a constraint to be solved, because it reduces the CAD scheme reliability. Two procedures were adopted to improve the scheme performance for dense breast images: (1) combining all the techniques described together and (2) developing a new procedure to eliminate false positive signals from the structures characteristics.
Effects from the Procedure to Reduce False Positive Cases
The solution proposed here for minimizing the false positive rates was the development of a technique named false positive rates (FPR), described in Reducing the Fase Positive Rates. By considering some characteristics of detected signals, this procedure excludes the pixels probably associated with noise from the image resulting from the APT. Figure 8 shows the effect of this technique. For illustration purposes, these results were obtained with one enhanced images set submitted to our processing scheme with different SD values in the segmentation. The TP and FP results were determined before and after using the procedure for eliminating FP signals. A large reduction in FP was achieved with the application of the FPR procedure, in addition to the expected reduction in TP cases. The latter reduction was significantly smaller, being 13% in comparison to 34% for FP. The tests showed that the FP cases decrease was not proportional to the number of detected clusters before applying the procedure. This can be explained by the clusters composition: many times several signals were eliminated from an image, but the number of remaining structures was sufficient to form a cluster. At any rate, the number of signals forming the clusters decreased drastically after the procedure.
Fig 8.
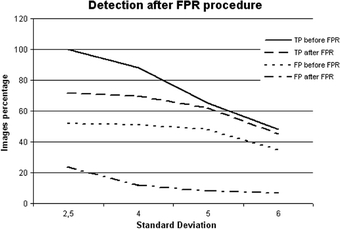
Graphic showing the effect of the FPR procedure on the processed images.
Contrast and area were the factors that had greater influence on the distinguishing power between true and false signals. Two other parameters were also important: compactness and irregularity. Compactness is a measure insensitive to scale and orientation changes, with minimum values for disk-shaped regions. The smaller influence of these two parameters is due mainly to the characteristics of the microcalcifications: as they are very small, normally they do not comprise many pixels (the amount is obviously dependent on the digitization spatial resolution). Without many pixels, there is little change in area and perimeter and consequently, compactness and irregularity only yield different values for larger structures, formed by more pixels. Small signals have similar values and thus true and false signals are difficult to distinguish via these parameters.
We emphasize that this technique does not eliminate the contrast enhancement from preprocessing. Enhancement techniques amplify signal detection and, when processing is over, the FPR procedure eliminates most of them. The FPR method, however, only eliminates the false positive signals. Without FPR, the FP detection rate would be very high. In addition, without applying enhancement techniques, many true positive signals are not detected, which reduces the right TP detection rate. Therefore, applying enhancement techniques is necessary, even if it increases FP detection. Hence the FPR procedure excludes FP signals without discarding the rightly detected structures (TP).
Outline of the Final Processing Scheme
After several tests were run, the scheme shown in Figure 9 provided the best results. Some features are noteworthy: (1) the CCE technique was applied to the original image because it enhances some images in a manner that other techniques cannot do; (2) the same images were also enhanced by ACE and HTE. The resulting images from each technique were segmented and then put together using a procedure referred to as Images Union. It was adopted because some signals were only detected by one of the techniques. Thus, the addition was used to preserve all the detected signals, and (3) the image resulting from the addition of segmented images was submitted to the area-point transformation (APT), which converts each identified structure into a unique pixel. Obviously, the image resulting from the APT presents a larger number of false positive signals, which is reduced after application of the FPR technique.
Fig 9.
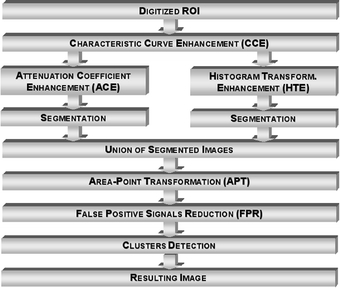
Diagram corresponding to the final configuration for the processing scheme intended to detect clustered microcalcifications in dense breast images.
Figure 10 shows the ROC curve for the tests with the image set. The area under the curve (AZ) was estimated as approximately 0.93, showing better performance for this configuration compared to the previous tests. The range considered for the values was different from that used previously because of the small difference observed in some intervals, mainly for low standard deviation values. The beginning of the ROC curve, corresponding to higher standard deviation values, has the sharpest variations. This means that the higher the standard deviation becomes, the larger is the variation in the scheme sensitivity. As a consequence, even with a more rigid criterion for sensitivity, the results are interesting for dense breast images. A higher sensitivity implies an increase in TP and FP rates. Nevertheless, we could note that TP detection rates were kept high, without significant increase in FP rates. This can be illustrated by the curve close to the ordinates axis in the figure, leading to an area under the ROC curve close to unity. With this final configuration of our scheme, a better relationship between TP and FP rates was obtained in comparison to the previous tests. For example, for a right detection of approximately 90% for TP, the FP rate is approximately 20%. A complete detection example is presented in Figure 11.
Fig 10.

ROC curve relative to the final configuration of the CAD scheme for the first images set.
Fig 11.
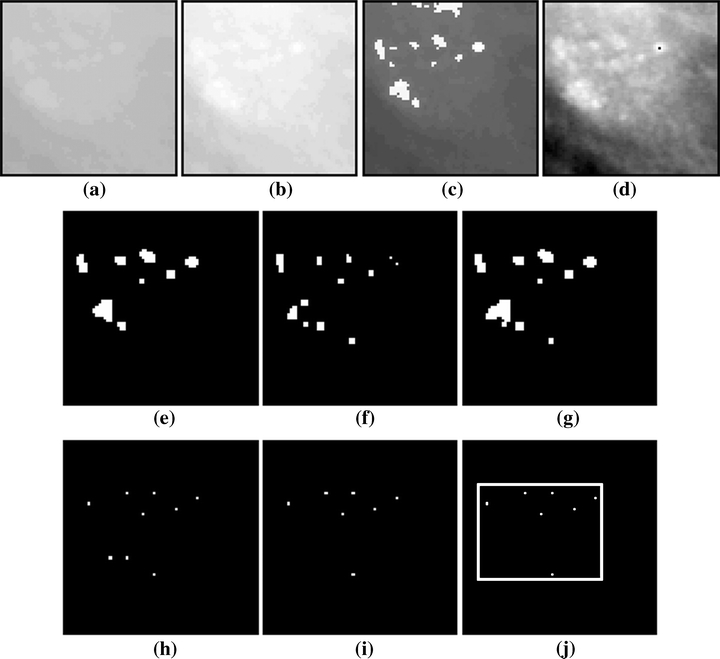
Example of processing of the first images set with the final scheme configuration: (a) original image, (b) image after CCE, (c) image b after ACE, (d) image b after HTE, (e) image c after segmentation, (f) image d after segmentation, (g) image resulting from the union between e and f, (h) image g after APT, (i) image h after FPR, (j) resulting image after cluster detection.
In a large number of cases during the processing, the resulting image from the HTE technique presented smaller signals after segmentation compared to the same image when enhanced by ACE. On the other hand, some signals were identified only in images processed after applying HTE. This can be observed in images e and f of Figure 11, which confirms the importance of combining segmented images resulting from enhancement via both techniques (ACE and HTE). For all the images and all the standard deviation values, a large reduction in signals was observed after the FPR procedure. The eliminated signals were verified as really false, because in the “positive” images the clusters were still detected, whereas in the “negative” images, the FPR procedure was useful in preventing false clusters from being detected.
Conclusions
The first conclusion drawn is that for dense breast digital images a large range of gray levels is required. The results shown in this work indicate that 4,096 gray levels give good contrast resolution for this type of image. Furthermore, the low contrast among tissues in dense breasts demands a combination of techniques for distinguishing microcalcifications from the background. It is true that the preprocessing techniques developed here [contrast enhancement by histogram transformation (HTE), contrast enhancement by the attenuation coefficients (ACE), and contrast enhancement by film characteristic curve (CCE)] yield better results than the generic techniques tested previously.16 However, the ACE technique did not accent some single structures enhanced by the HTE technique (and vice versa). The CCE technique presented an additional enhancement for whiter images, but its effect was not detected on the other images from the set. The individual application of each technique has also shown that the number of false positives is significantly increased by them all. This was the motivation for developing the CAD scheme with a combination of methods, which led to a 96% accuracy rate for true positives detection, AZ = 0.93 for the corresponding ROC curve and the right detection rate of 85%.
We have also shown that the characteristics of the treated images affect several stages of image processing—from the acquisition process in a mammography equipment and digitization, up to the preprocessing and image processing itself. This calls for the establishment of standardization of CAD schemes, which, however, is difficult to do for several reasons: (1) each CAD scheme works with images from different locations and hence with different characteristics; (2) consequently, there is no uniformity regarding the characteristics related to the imaging process (mammography equipment, exposure techniques, films, development, among others) or to the digitization process; (3) normally, the CAD schemes are developed in order to process one or some single image formats; the conversion to other formats can also produce changes in the image characteristics; (4) the software and hardware specifications of a CAD scheme are also variable, so that a scheme developed, for example, to be operated in graphical workstations, usually cannot be applied to PCs; this would demand an effort for systems conversion which could lead even to implementation incompatibility. To minimize these problems, some suggestions could be feasible. For example, image databases could be compiled and made available with detailed information and storage format that are easily converted to other formats used in CAD schemes. Furthermore, objective evaluation criteria could be established such as the ROC curves suggested by Nishikawa et al.4 The optimization of parameters for the techniques used is an important step and represents a barrier for the success of a CAD scheme—in particular, because some parameters may not be available, mainly those associated with the acquisition process. (Recording these values is not part of the imaging routine.) In some equipment, the operational parameters are fitted automatically, according to the breast characteristics, and even the operator may not know these values. In our tests, some parameters were defined experimentally and others were defined automatically through procedures developed with this purpose. They are appropriate for our image database. Although obtaining these values is not an easy task, the use of parameters has the advantage of allowing the user to adjust various techniques to accommodate any image set. A project that our team is currently developing is aiming to suggest values for the parameters relevant to processing by a mammographic image analysis.
An additional observation about the other techniques presented in literature and image sets used in tests must be emphasized here. The composition of the image set is a challenge in CAD schemes, as stated in the Introduction. Techniques can perform at various levels when applied to different images. Most techniques presented in the literature are applied to general mammograms without specifications about their density. Our methods were applied exclusively in dense breast images. Thus, it is almost impossible to compare results from both. A comparison might be possible if a similar set of images would be used, which is a proposal of our previous work.17
Finally, we consider that by improving the correct detection rates of clustered microcalcifications, the CAD scheme presented here contributes to the diagnosis of breast cancer at an early stage, which is particularly important for dense breast images characteristic of young women and those who are undergoing hormonal reposition therapy.
Acknowledgments
The authors are grateful to Hospital das Clínicas at Ribeirão Preto (SP), Brazil, which allowed us to use the mammograms in the tests, with special thanks to the personnel from the section of X-ray image archives in that hospital. They are also grateful to FAPESP, which provided financial support to this research, and to Prof. Oswaldo N. Oliveira Jr. for his critical reading of the manuscript and suggestions.
References
- 1.Giger ML. Computer-aided diagnosis of breast lesions in medical images. Comput Sci Eng. 2000;2(5):39–45. doi: 10.1109/5992.877391. [DOI] [Google Scholar]
- 2.Giger ML, MacMahon H. Image processing and computer-aided diagnosis. Radiol Clin North Am. 1996;34(3):565–595. [PubMed] [Google Scholar]
- 3.LeGal M, Chavanne G, Pellier D. Valeur diagnostique des microcalcifications groupées découvertes par mammographies. Bull Cancer. 1984;71:57–64. [PubMed] [Google Scholar]
- 4.Nishikawa RM, Jiang Y, Giger ML, Schimdt RA, Vyborny CJ, Zhang W, Papaionnou J, Bick U, Nagel R, Doi K, et al. Performance of automated CAD schemes for the detection and classification of clustered microcalcifications. In: Gale AG, et al., editors. Digital Mammography. Amsterdam: Elsevier; 1994. pp. 13–20. [Google Scholar]
- 5.Roerih J, et al.: Clinical results with R2 imagechecker system. In: Karssemeijer N, et al. (Eds). Digital Mammography. Kluwer Academic Publishing, Dordrecht, The Netherlands, 1998, pp 395–400
- 6.Schmidt F, Sorantin E, Szepesvari C, Graif E, Becker M, Mayer H, Hartwagner K. An automatic method for the identification and interpretation of clustered microcalcifications in mammograms. Phys Med Biol. 1999;44:1231–1243. doi: 10.1088/0031-9155/44/5/011. [DOI] [PubMed] [Google Scholar]
- 7.Kim JK, Park HW. Statistical textural features for detection of microcalcifications in digitized mammograms. IEEE Trans Med Imag. 1999;18(3):231–237. doi: 10.1109/42.764896. [DOI] [PubMed] [Google Scholar]
- 8.Gavrielides MA, Lo JY, Vargas-Voracek R R, Floyd CE. Segmentation of suspicious clustered microcalcifications in mammograms. Med Phys. 1999;27(1):13–22. doi: 10.1118/1.598852. [DOI] [PubMed] [Google Scholar]
- 9.Netsch T, Peitgen H-O. Scale-space signatures for the detection of clustered microcalcifications in digital mammograms. IEEE Trans Med Imag. 1999;18(9):774–786. doi: 10.1109/42.802755. [DOI] [PubMed] [Google Scholar]
- 10.Yu S, Guan L. A CAD system for the automatic detection of clustered microcalcifications in digitized mammogram films. IEEE Trans Med Imag. 2000;19(2):115–126. doi: 10.1109/42.836371. [DOI] [PubMed] [Google Scholar]
- 11.Boyd NF, Byng JW, Jong RA, Fishell EK, Little LE, Miller AB, Lockwood GA, Tritchler DL, Yaffe MJ. Quantitative classification of mammographic densities and breast cancer risk: results from the Canadian National Breast Screening study. J Natl Cancer Inst. 1995;87:670–675. doi: 10.1093/jnci/87.9.670. [DOI] [PubMed] [Google Scholar]
- 12.Schiabel H, Nunes FLS, Azevedo Marques PM, Frere AF. A computerized scheme for detection of clusters of microcalcifications by mammograms image processing. Med Biol Eng Comput. 1997;35(suppl 2):705. [Google Scholar]
- 13.Raji A, Thaibaoui A, Petit E, Bunel V, Mimoun G. A gray-level transformation-based method for image enhancement. Pattern Recogn Lett. 1998;19:1207–1212. doi: 10.1016/S0167-8655(98)00109-3. [DOI] [Google Scholar]
- 14.Nunes FLS, Schiabel H, Benatti RH, Stamato RC, Escarpinati MC, Goes CE: A method to contrast enhancement of digital dense breast images aimed to detect clustered microcalcifications. In: 2001 International Conference on Image Processing, Thessaloniki, Greece, October 7–10, 2001
- 15.Nishikawa RM, Giger ML, Doi K, Vyborny CJ, Schmidt RA. Computer-aided detection of clustered microcalcifications: an improved method for grouping detected signals. Med Phys. 1993;20(6):1661–1666. doi: 10.1118/1.596952. [DOI] [PubMed] [Google Scholar]
- 16.Nunes FLS, Schiabel H, Benatti R: Application of image processing techniques for enhancement in dense breasts digital mammograms. In: Medical Imaging 1999 of The International Society for Optical Engineering—SPIE: 1105–1116 San Diego, CA, USA, February 20–26, 1999
- 17.Schiabel H, Nunes FLS, Escarpinati M, Benatti R: Performance of a processing scheme for clustered microcalcifications: detection with different images database. In: World Congress on Med Phys and Biomedical Engineering, 2000 Chicago (USA), July 23–28, 2000


