Abstract
An acceptable mammography film digitizer must provide high-quality images at a level of diagnostic accuracy comparable to reading conventional film examinations. The purpose of this study was to determine if there are significant differences between the interpretations of conventional film-screen mammography examinations and soft copy readings of the images produced by a mammography film digitizer. Eight radiologists interpreted 120 mammography examinations, half as original films and the other half as digital images on a soft copy work station. No radiologist read the same examination twice. The interpretations were recorded in accordance with the Breast Imaging Reporting and Data System and included other variables such as perceived image quality and diagnostic difficulty and confidence. The results provide support for the hypothesis that there are no significant differences between the interpretations of conventional film-screen mammography examinations and soft copy examinations produced by a mammography film digitizer.
Key words: Digitized mammography, interpreting digitized mammography images, transition to digital imaging, ROC-based analysis
Introduction
Digital imaging is rapidly becoming the basis of modern radiology practice, resulting in the gradual replacement of conventional radiographs. Many health care institutions plan to install, or already have, implemented digital imaging systems or filmless radiology departments. In mammography, several studies have evaluated digital mammography systems and found no significant differences between film and soft copy interpretations in terms of accuracy, sensitivity, specificity, image quality, recall rates, and other parameters.1
Film digitizers serve an important role in the transition from conventional radiography by providing images that can be compared directly with new digital examinations for soft copy display. With a wide variety of clinical applications in picture archiving and communications systems and teleradiology, film digitizers must be able to bridge the transition between hard copy and soft copy display without sacrificing accuracy, sensitivity, or specificity. An acceptable film digitization system must provide high-quality digital images to achieve levels of diagnostic accuracy that are accepted as essential to interpretation of hard copy films.
A variety of studies were conducted comparing the performance of film digitizers with conventional hard copy films. Findings from some previous studies showed significant differences between readings of radiographic film and soft copy reading in terms of diagnostic accuracy, sensitivity, specificity, and/or image quality.2–5 However, findings from other studies have suggested that improvements in the film digitization and soft copy display process may produce radiographs that can be interpreted with comparable levels of accuracy, sensitivity, specificity, and image quality.6–9
In this study, we make an effort to assess the clinical performance of digitizers by testing the hypothesis that there are no significant differences between the interpretations of mammography images resulting from digitizing films using a charge-coupled device (CCD) film digitizer and the readings of the original films as measured by accuracy, sensitivity, specificity, and receiver operating characteristic (ROC) analysis. The study is intended to provide rigorous tests of the hypothesis in an environment in which the transition from conventional film practice to digital imaging is underway and where there is substantial interest in determining the efficacy of film digitization and soft copy interpretation of medical images.
Materials and Methods
To determine the clinical efficacy of digitized film readings and their perceived image quality on an electronic work station, 120 mammography film examinations with a range of negative and positive ratings were selected to ensure an adequate degree of statistical power (80%) and a type I error rate of 5%. Based upon Obuchowski’s10 article, a sample of 120 examinations was selected to be read by eight qualified readers to meet the desired statistical power and error rate. The study design allowed for the detection of moderate differences in diagnostic accuracy (10%), a moderate degree of interobserver variability (0.05), and a 2:1 ratio of negative/positive cases. Two additional readers were added as alternates for two naval officers who were subject to active duty deployment.
The 120 cases were selected from the mammography film library at the Johns Hopkins Medical Institutions. The examinations included a range of diagnostic and screening examinations using a variety of criteria, including patient age and the Breast Imaging Reporting and Data System (BI-RADS) assessment categories.11 “Positive” examinations were confirmed by pathology reports in which there was a tissue diagnosis of cancer within 1 year of a positive examination. “Negative” examinations were confirmed if there were no known tissue diagnoses of cancer within 1 year of a negative examination. Using the above criteria, 44 positive examinations and 76 negative examinations were selected to provide a negative/positive case ratio of 1.7:1. Prior films and reports were included in the study when they were available.
The digitizer (Fig. 1) used to scan the films was a CAD PRO™ Advantage film digitizer developed by VIDAR Systems Corporation, Herndon, VA, USA. Depending on film size, digitized image files ranged from 40 to 70 MB. The selected film mammography examinations and their digitized counterparts included only the two standard views (craniocaudal and mediolateral) of each breast.
Fig 1.
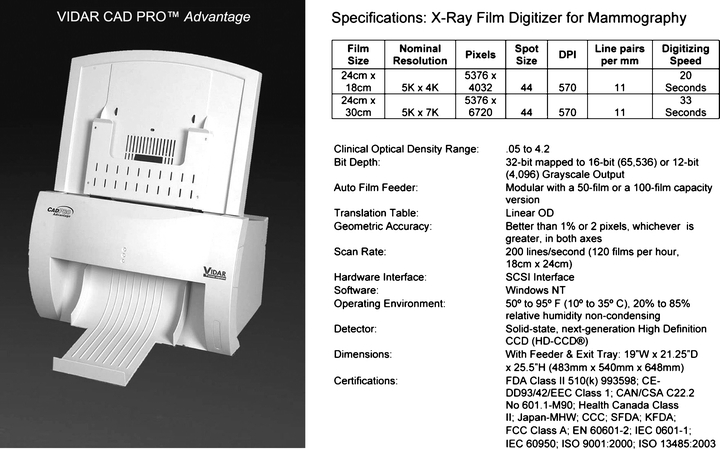
VIDAR CAD PRO advantage.
The scanned images were transmitted from the digitizer unit to an acquisition station connected via a SCSI interface. The acquisition work station was a Dell Precision Work Station 450 (Dell Computer Corporation, Round Rock, TX, USA) with Dual Xeon 2.4 GHz processors, equipped with two 20 GB SCSI drives and 1.25 GB of RAM. It included an Adaptec 2930 PCI SCSI card (Adaptec, Inc., Milpitas, CA, USA) used to interface with the VIDAR film digitizer. Clinical Express 2.0 (VIDAR Systems Corporation) was the viewing application that was installed on the acquisition work station. The computer acquired images from the VIDAR digitizer and “pushed” them to a twin work station that created Digital Imaging and Communication in Medicine (DICOM) files for network transmission to the display work station for viewing and interpretation.
The diagnostic viewing work station was a Gateway S5600D (Gateway Incorporated, Irvine, CA, USA). The work station application ran on an 800-MHz Pentium III processor with 1 GB of RAM. Two Simomed (Siemens, Arlington, TX, USA) portrait style monitors were attached to the work station to support high resolution (2,500 by 2,000 pixels) and 8-bit grayscale contrast for image display. So as to simulate optimal clinical conditions for reading mammography, as indicated by the American College of Radiology,12 the ambient lighting was observed at levels well below 50 lux (the observed measurements were approximately 6 lux). The mammography film viewboxes met the minimum American College of Radiology (ACR) standard of 3,000 cd/m2 (the observed measurements were above 4,300 cd/m2).
All of the readers were board-certified radiologists with experience in soft copy interpretations. Each of the readers read 120 cases, 60 on film and 60 on soft copy. No radiologist read the same examination twice. Actual dates of current and prior examinations were not made available to the readers to comply with the Health Insurance Portability and Accountability Act (HIPAA) regulations. Instead, the time interval between the two examinations was recorded and made available to the study participants. The readers were also provided with access to reports from previous mammography examinations, when prior films were available. The prior films were also digitized and were made available in the appropriate mode, i.e., film or soft copy, for each reading session.
To ensure compliance with HIPAA regulations, all Protected Health Information on the films was concealed before digitization and was not available to the readers on the films, images, or reports during the reading sessions. The age of the patient (not date of birth) was available for all mammography examinations. The protocol was approved by the Johns Hopkins Medicine Institutional Review Board (IRB) before the study was begun.
The interpretations of the examinations were recorded on a Microsoft (MS) Access 2000 (Microsoft Corporation, Redmond, WA, USA) data entry form on a laptop. The form provided for the readers’ ratings of the study parameters, including breast composition, BI-RADS assessment, diagnostic confidence, diagnostic difficulty, and image quality. The readers were also able to comment on the functions of the digital work station and on the quality of the images. The resultant data in this paper for each of the five specified parameters are presented in the same sequence as they appeared on the data entry form.
The data entry form was linked to an MS Access database where the data were stored. After the 16 reading sessions were completed, the resultant data were tabulated and analyzed to determine the extent of the differences between film and soft copy interpretations. There were no constraints placed on the time needed by the radiologists for the reading sessions. The length of reading sessions varied from 125 to 205 min for soft copy sessions and 103 to 180 min for film sessions. Based upon the recorded starting and ending times, on average, readers took more time to complete soft copy sessions than film interpretation sessions (169 vs 130 min). This is probably because of the greater familiarity of the readers with film than with soft copy interpretations.
Comparable data were tested for statistical significance at the 95% confidence level using the Wilcoxon signed-rank test and the chi-square test.13 Measures of sensitivity and specificity were calculated to compare film interpretations with readings of digitized images.14 Receiver operator characteristic analysis was performed using the computer program ROCKIT. Diagnostic accuracy of the readers’ interpretations was assessed by determining the areas under the ROC curves.15 This was developed by C.E. Metz at the University of Chicago, which is a combination of three previous algorithms that can be used to analyze both discrete and continuously distributed data.16
Agreement analysis was also performed to supplement the statistical analysis of the distribution of readers’ ratings of film and soft copy interpretations.17,18 The agreement was assessed between film and soft copy readers by comparing their ratings given for breast composition, BI-RADS, diagnostic confidence, diagnostic difficulty, and image quality. Tests of statistical significance were performed on the data resulting from the interpretations of the eight initial readers and from the group of ten readers. Apart from image quality, there were no statistically significant differences between film and soft copy interpretations. The results shown in this paper are based primarily upon the data provided by the eight original readers. In addition, a comparison of the results of the eight original readers’ interpretations with those for all ten participants is shown in Appendix A.
Results
The 120 selected examinations viewed by the eight original readers to compare film and soft copy interpretations are shown for each of the study parameters as percent distributions in the bar charts, and as counts in the agreement tables that follow.
Breast Composition
For breast composition, the readers categorized each of the examinations in accordance with the ACR BI-RADS Atlas. The categories shown in Figure 2. included “almost entirely fat”, “scattered fibroglandular densities”, “heterogeneously dense”, and “extremely dense.” The results indicate that “almost entirely fat” was reported as 11.0% for film and 8.8% for soft copy interpretations. For “scattered fibroglandular densities”, 40.8% were reported for film compared to 38.3% for soft copy. The description “heterogeneously dense” was reported for 39.4% of film readings and 45.2% for soft copy display, and ”extremely dense” breast composition was reported for 8.3% of film readings and 7.1% of softcopy interpretations. The distribution of breast composition ratings on film examinations was compared with that the distribution on soft copy examinations using the chi-square test. The results were calculated and were found not to be significant (p ≤ 0.508).
Fig 2.
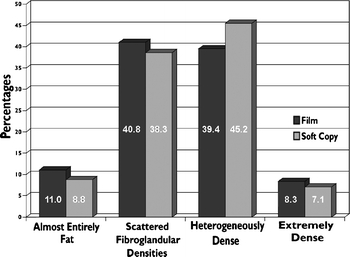
Readers’ description of breast composition by display mode.
The overall agreement shown in Table 1 for breast composition was 73.8%. The highest agreement, 81.5%, was recorded for heterogeneously dense, and the lowest, 54.8%, was for extremely dense.
Table 1.
Readers’ Agreement Between Breast Composition Ratings
| Soft Copy Readings | Film Readings | |||||
|---|---|---|---|---|---|---|
| Almost Entirely Fat | Scattered Fibroglandular Densities | Heterogeneously Dense | Extremely Dense | Not Determined | Total Readings | |
| Almost entirely fat | 34 | 7 | 0 | 1 | 0 | 42 |
| Scattered fibroglandular densities | 17 | 142 | 24 | 0 | 1 | 184 |
| Heterogeneously dense | 0 | 45 | 154 | 17 | 1 | 217 |
| Extremely dense | 1 | 0 | 10 | 23 | 0 | 34 |
| Not determined | 0 | 1 | 1 | 1 | 0 | 3 |
| Total readings | 52 | 195 | 189 | 42 | 2 | 480 |
| Percent agreement | 65.4 | 72.8 | 81.5 | 54.8 | 73.8 | |
BI-RADS Assessment
BI-RADS ratings are shown in Figure 3 for each examination interpreted by the readers in accordance with the ACR BI-RADS protocol. The readers chose a BI-RADS category based upon their interpretation of each examination. They assigned a rating from 1 to 5, defined by the ACR as follows: 1 negative, 2 benign findings, 3 probably benign, 4 suspicious abnormality, and highly suggestive of malignancy.
Fig 3.
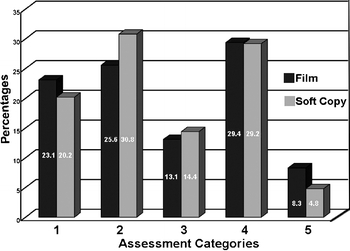
Readers’ BI-RADS assessment categories by display mode.
The percentages shown on Figure 3 indicate that the lowest values reported for both film, 8.3%, and soft copy, 4.8%, were for category 5, “highly suggestive of malignancy.” The highest percentage shown for film is for category 4, “suspicious abnormalities”, where 29.4% was reported. The highest percent for soft copy is for category 2, “benign findings”, where 30.8 was reported.
Average BI-RADS ratings for the four readers who interpreted a particular case on film were compared with the average BI-RADS ratings for the four readers who read the same case on soft copy. The Wilcoxon signed-rank test was used to determine the statistical significance of the differences between the 480 film readings and the 480 soft copy interpretations. The results were not found to be significant (p ≤ 0.601). The distribution of BI-RADS ratings on film were compared with those on soft copy and the differences were tested using chi-square and found not to be significant (p ≤ 0.175).
The overall agreement shown in Table 2 for BI-RADS ratings was 64.1%. The highest agreement, 73.3%, was recorded for category “2” rating, benign findings, and the lowest, 47.0%, was for the category “1” rating, negative.
Table 2.
Readers’ Agreement Between BI-RADS Ratings
| Soft Copy Readings | Film Readings | ||||||
|---|---|---|---|---|---|---|---|
| 1 | 2 | 3 | 4 | 5 | Not Determined | Total Readings | |
| 1 | 47 | 21 | 8 | 15 | 0 | 0 | 91 |
| 2 | 27 | 85 | 8 | 11 | 0 | 0 | 131 |
| 3 | 15 | 4 | 34 | 6 | 1 | 0 | 60 |
| 4 | 11 | 6 | 5 | 94 | 16 | 0 | 132 |
| 5 | 0 | 0 | 0 | 3 | 20 | 0 | 23 |
| Not determined | 0 | 0 | 0 | 0 | 0 | 43 | 43 |
| Total readings | 100 | 116 | 55 | 129 | 37 | 43 | 480 |
| Percent agreement | 47.0 | 73.3 | 61.8 | 72.9 | 54.1 | 64.1 | |
There were 480 film readings and 480 digitized image interpretations produced by the eight radiologists who participated in the study. Each of the readings was compared with the original clinical interpretation of the examination and rated as “true positive (TP)”, “true negative (TN)”, “false positive (FP)”, or “false negative (FN)” as shown in Table 3. For example, the 241 TN cases are those that the study film readers rated as 1, 2, or 3, when the original clinical interpretation was negative. These ratings were used to compute sensitivity and specificity values for film and soft copy readings. Sensitivity refers to the proportion of positive cases correctly interpreted as abnormal. Specificity refers to the proportion of negative cases correctly interpreted as normal. Accuracy refers to the proportion of cases (TPs and TNs) correctly identified by a radiologist.
Table 3.
BI-RADS Ratings by Study Readers Compared with the Original Clinical Interpretations
| BI-RADS Ratings | Film Mode | Soft Copy Mode | ||||
|---|---|---|---|---|---|---|
| Negative | Positive | Total | Negative | Positive | Total | |
| 1, 2, 3 | 241 (TN) | 56 (FN) | 297 | 248 (TN) | 66 (FN) | 314 |
| 4, 5 | 62 (FP) | 119 (TP) | 181 | 53 (FP) | 110 (TP) | 163 |
| Not reported | 2 | 3 | ||||
| Total | 303 | 175 | 480 | 301 | 176 | 480 |
The percentages related to the reported BI-RADS ratings by the readers for each display mode regarding sensitivity and specificity are shown in Table 4. The percent distributions shown for each of the display modes, both sensitivity and specificity, are quite similar. For sensitivity calculations, the proportion of TP cases that were given BI-RADS ratings of “4” or “5” on film was compared with the corresponding proportion for soft copy. Film interpretations were found to have a sensitivity rating of 66.3% compared with a sensitivity rate of 62.5% for soft copy interpretations. These differences were assessed using the chi-square test and were not found to be significant (p ≤ 0.559). For specificity calculations, the proportion of TN cases that were given BI-RADS ratings of 1, 2, or 3 on film was compared with the corresponding proportion on soft copy. Film readings were found to have a specificity of 79.5% compared with soft copy readings of 82.4%. These differences were assessed using the chi-square test and were not found to be significant (p ≤ 0.743).
Table 4.
Percent Distributions of Readers’ BI-RADS Ratings Related to Sensitivity and Specificity
| Readers’ BI-RADS Ratings | Sensitivity | Specificity | ||
|---|---|---|---|---|
| Film | Soft Copy | Film | Soft Copy | |
| 1, 2, 3 | 33.7 | 37.5 | 79.5 | 82.4 |
| 4, 5 | 66.3 | 62.5 | 20.5 | 17.6 |
Receiver operating characteristic analysis of the data recorded in the study summarizes the differences between the relative accuracy of readings in each display mode (Fig. 4). The areas under the ROC curve for film and soft copy were determined using the ROCKIT program and were compared. The area under the ROC curve for film examinations was found to be 0.78 and the area under the ROC curve for soft copy examinations was found to be 0.77. The difference between the areas under these two curves was tested and found not to be statistically significant (p = 0.56).
Fig 4.
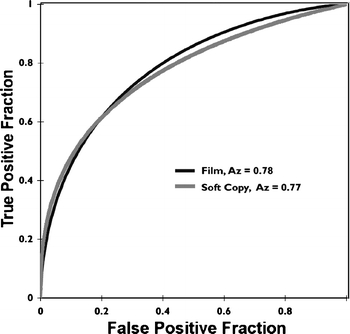
Receiver operating characteristic by display mode.
Diagnostic Confidence
Diagnostic confidence refers to the extent to which readers are assured of their interpretations. Readers rated their diagnostic confidence as “low”, “moderate”, or “high” (Fig. 5).
Fig 5.
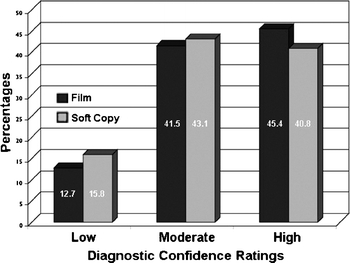
Readers’ ratings of diagnostic confidence by display mode.
The readers commonly reported moderate and high confidence levels in approximate equal frequencies. Low diagnostic confidence for film was reported 12.7% of the time and 15.8% of the time for soft copy. Average diagnostic confidence ratings of the readers who read a particular case on film were compared with the average diagnostic confidence ratings of the readers who read a particular case on soft copy using the Wilcoxon signed-rank test. The results were calculated and were found to be not significant (p ≤ 0.078). The distributions of diagnostic confidence ratings on film and the distribution of diagnostic confidence ratings on soft copy were tested and found to be not significant (p ≤ 0.453).
The overall agreement shown in Table 5 for diagnostic confidence was 67.2%. The highest agreement, 72.2%, was recorded for the “medium” confidence level, and the lowest, 46.9%, was for the low confidence level.
Table 5.
Readers’ Agreement Between Diagnostic Confidence Ratings
| Soft Copy Readings | Film Readings | ||||
|---|---|---|---|---|---|
| Low | Medium | High | Not Determined | Total Readings | |
| Low | 30 | 20 | 24 | 0 | 74 |
| Medium | 23 | 140 | 45 | 2 | 210 |
| High | 11 | 34 | 151 | 0 | 196 |
| Not determined | 0 | 0 | 0 | 0 | 0 |
| Total readings | 64 | 194 | 220 | 2 | 480 |
| Percent agreement | 46.9 | 72.2 | 68.6 | 67.2 | |
Diagnostic Difficulty
Diagnostic difficulty is an important factor in readers’ impressions related to accuracy of interpretation. Each of the eight readers rated the diagnostic difficulty of the examinations as low, moderate, or high when they interpreted the cases in film or screen modes (Fig. 6).
Fig 6.
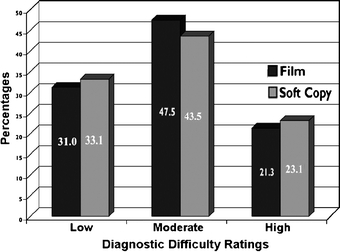
Readers’ ratings of diagnostic difficulty by display mode.
The examinations that were rated high difficulty were 21.3% and 23.1% for the film and soft copy cases, respectively, and 47.3% and 43.5% for film and soft copy in the moderate category, respectively. Readers rated low quality as 31.0 on film and 33.1% on soft copy. Average diagnostic difficulty ratings of the readers who read a particular case on film were compared with the average diagnostic difficulty ratings of the readers who read a particular case on soft copy using the Wilcoxon signed-rank test. The results were calculated and were not found to be significant (p ≤ 0.971). The distributions of diagnostic difficulty ratings on film and the distribution of diagnostic difficulty ratings on soft copy were tested with the chi-square test and found not to be significant (p ≤ 0.970).
The overall agreement shown in Table 6 for diagnostic difficulty was 67.6%. The highest agreement, 70.5%, was recorded for the low difficulty rating, and the lowest, 64.4%, was for the high rating.
Table 6.
Readers’ Agreement Between Diagnostic Difficulty Ratings
| Soft Copy Readings | Film Readings | ||||
|---|---|---|---|---|---|
| Low | Medium | High | Not Determined | Total Readings | |
| Low | 105 | 45 | 10 | 0 | 160 |
| Medium | 28 | 152 | 26 | 1 | 207 |
| High | 16 | 29 | 65 | 1 | 111 |
| Not determined | 0 | 0 | 0 | 2 | 2 |
| Total readings | 149 | 226 | 101 | 4 | 480 |
| Percent agreement | 70.5 | 67.3 | 64.4 | 67.6 | |
Image Quality
The perceived image quality of the examinations affects the radiologists’ ability to make accurate interpretations of film and soft copy images. In this study, each of the 8 readers interpreted 60 examinations on film and 60 as digitized images on the electronic work station screen. The readers assigned each examination an image quality rating of “adequate”, “good”, or “excellent” based on their perceptions (Fig. 7).
Fig 7.
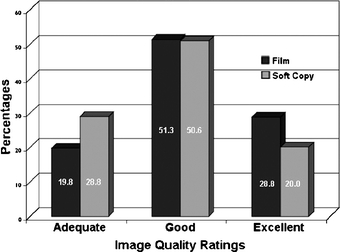
Readers’ ratings of image quality by display mode.
The rating most frequently recorded by the readers was good with 51.3% for film examinations and 50.6% for images viewed as soft copy. Average image quality ratings of the readers who read a particular case on film were compared with the average image quality ratings of the readers who read a particular case on soft copy using the Wilcoxon signed-rank test. The results were calculated and found to be significant (p ≤ 0.0001). The distributions of image quality ratings on film and the distributions of image quality ratings on soft copy were tested using the chi-square test and found to be significant (p ≤ 0.001).
The overall agreement shown in Table 7 for image quality was 66.0%. The highest agreement, 75.2%, was recorded for the good quality rating, and the lowest, 47.1%, was for the excellent rating.
Table 7.
Readers’ Agreement Between Image Quality Ratings
| Soft Copy Readings | Film Readings | Total Readings | |||
|---|---|---|---|---|---|
| Adequate | Good | Excellent | Not Determined | ||
| Adequate | 66 | 37 | 36 | 0 | 139 |
| Good | 20 | 185 | 35 | 1 | 241 |
| Excellent | 9 | 23 | 65 | 0 | 97 |
| Not determined | 0 | 1 | 2 | 0 | 3 |
| Total readings | 95 | 246 | 138 | 1 | 480 |
| Percent agreement | 69.5 | 75.2 | 47.1 | 66.0 | |
Discussion
Recent advances in film digitization and high-resolution display technology provide important opportunities to improve the delivery of radiology services. The physical and economic benefits associated with digital archiving of radiographic examinations provide incentives to consider implementing such technology. Of paramount importance to the application of such technology in the clinical environment is the ability of radiologists to interpret soft copy images with accuracy equivalent to that of conventional films.
This study was undertaken to determine whether there are any significant differences between the interpretations of mammograms on plain film versus digitized film. Although several other studies have evaluated the ability of digitizers to produce images in other fields of radiology, this study is only the second one to evaluate the performance of film digitizers in mammography. A previous study by Smathers et al7 superimposed pulverized bone specks and aluminum oxide particles on a breast phantom and determined the particle size that corresponded to a mean detectability level of 50% on screen-film and digitized mammograms. The results found that smaller particles could be detected on the digitized mammogram compared with the screen-film mammogram (p<0.01). Smathers et al surmised that the edge enhancement and high spatial and contrast resolution of the digitized display provided additional advantages in terms of detecting microcalcifications.
Other studies have evaluated the extent to which computer-aided diagnosis can improve the image quality of digitized examinations.19 These studies suggest that a variety of techniques, including mass detection algorithms, wavelet transform, pixel gray level corrections, and tissue thickness corrections, can improve the ability of radiologists to detect lesions on digital displays.
Another factor relevant to this study is the size of the digitized images. Each of the images in our study ranged from 40 to 70 MB per image, meaning that an entire study with or without comparison films may range from 160 to 560 MB. Several studies have looked at the degree to which images can be compressed without sacrificing diagnostic accuracy. These studies indicate that under certain conditions, mammography images can be compressed at ratios as high as 80:1 without sacrificing diagnostic accuracy.20 Additional studies will be conducted to clarify the extent to which images can be compressed without losing diagnostic accuracy.
The results of this study offer promise for the future of film digitizers and electronic work stations in showing that the accuracy of interpretations of films and images produced by a CCD mammography film digitizer are not significantly different. In addition, this study provides evidence that film digitizers can be used in conjunction with high-resolution display monitors, digital storage media, and high-speed telecommunications to provide high-quality medical imaging services to underserved populations. With innovations and advances in technical fields occurring at a rapid pace and practitioners becoming computer literate, the acceptance of film digitizers and work stations should increase while the costs of adopting such technical applications is expected to decline.
Acknowledgements
Partial funding and equipment was provided by the VIDAR Systems Corporation. The authors would like to thank the participants who made major contributions to the design and conduct of the study, and to the interpretation of study findings. These include:
Board Certified Radiologists with MQSA Certification:
Bruce Copeland, M.D.
Judy Destouet, M.D.
David Eisner, M.D.
Julian Kassner, M.D.
Nagi Khouri, M.D.
Adeline Louie, M.D.
Kevin McCarthy, M.D.
David Sill, M.D.
Rosy Singh, M.D.
Jean Warner, M.D.
Uniformed Services University of the Health Sciences
Jerry Thomas, Capt. (Ret.), M.S.C.
USN Alexander V. Maslennikov, B.S.
Karen Richman, R.T.M.
Image Smiths
Jerry Gaskill, M.Ph.
Neil Goldstein, M.A.
William Pakenas, M.S.
Case Acquisition and Technical Support
Linda J. Wilkins, Johns Hopkins Department of Radiology
Pennie Drinkard, Consultant, VIDAR Systems Corporation
Appendix
The results shown in this paper are based primarily on the data provided by the original eight readers. This appendix contains additional comparisons of the findings for the original eight readers with the data for all ten who participated in the study. A summary of the Wilcoxon and chi-square tests for both eight and ten readers is seen in Table 8. No Wilcoxon test results are shown for “breast composition” because the test applies only to parameters that can produce a mean value for the readers’ ratings. The Wilcoxon test remained consistent between eight and ten readers for the four parameters shown. The summary of the results for the chi-square test indicates that the statistical significance for image quality and BI-RADS assessment differed for the eight and ten readers. The results of the chi-square test were consistent for the other three parameters.
Table 8.
Statistical Test Results for Eight Readers Compared to Ten Readers
| Wilcoxon Signed-rank Test | Chi-square Test | |||
|---|---|---|---|---|
| 8 Readers | 10 Readers | 8 Readers | 10 Readers | |
| Breast composition | N/A | N/A | p ≤ 0.508 | p ≤ 0.401 |
| Image quality | p ≤ 0.0001* | p ≤ 0.0002* | p ≤ 0.001* | p ≤ 0.107 |
| Diagnostic difficulty | p ≤ 0.460 | p ≤ 0.971 | p ≤ 0.970 | p ≤ 0.953 |
| Diagnostic confidence | p ≤ 0.078 | p ≤ 0.056 | p ≤ 0.453 | p ≤ 0.230 |
| BI-RADS assessment | p ≤ 0.911 | p ≤ 0.601 | p ≤ 0.175 | p ≤ 0.026* |
*Statistically significant
The statistically significant difference in BI-RADS assessment categories found when comparing the reports of eight readers with those of ten readers is due primarily to the relatively large number of BI-RADS categories 4 and 5 reported by the additional two readers. The initial group of eight readers rated 37.9% of their film interpretations and 34.2% of their soft copy readings as BI-RADS 4 or 5, compared to the two additional readers who rated 48.3% of their film interpretations and 52.1% of their soft copy readings as BI-RADS 4 or 5.
For the original eight readers, the area under the ROC curve (Table 9) for film examinations was found to be 0.78, and for soft copy examinations, was found to be 0.77. The difference between the areas under these two curves was tested and found not to be statistically significant (p = 0.56). For ten readers, the area under the ROC curve for film examinations was found to be 0.79 and the area under the ROC curve for soft copy examinations was found to be 0.75. The difference between the areas under these two curves was tested and found not to be statistically significant (p = 0.12).
Table 9.
ROC Results for Eight Readers to Ten Readers
| Comparing Areas Under the Curves | |||||
|---|---|---|---|---|---|
| 8 Readers | 10 Readers | ||||
| Film | Soft Copy | Difference | Film | Soft Copy | Difference |
| 0.78 | 0.77 | p = 0.56a | 0.79 | 0.75 | p = 0.12* |
*Not significant
Footnotes
The study was conducted primarily at the Johns Hopkins Medical Institutions in Baltimore, MD where all of the authors except Dr. Chad Mitchell are located. He is a Naval Officer at the Uniformed Services University of the Health Sciences in Bethesda, MD.
References
- 1.Pisano ED, Gatsonis C, Hendrick E, Yaffe M, Baum JK, Acharyya S, Conant EF, Fajardo LL, Bassett L, D’Orsi C, Jong R, Rebner R. Digital Mammographic Imaging Screening Trial (DMIST) Investigators Group. Diagnostic performance of digital versus film mammography for breast-cancer screening. N Engl J Med. 2005;353(17):1773–1783. doi: 10.1056/NEJMoa052911. [DOI] [PubMed] [Google Scholar]
- 2.Ackerman SJ, Gitlin JN, Gayler RW, Flagle CD, Bryan RN. Receiver operating characteristic analysis of fracture and pneumonia detection: comparison of laser-digitized workstation images and conventional analog radiographs. Radiology. 1993;186(1):263–268. doi: 10.1148/radiology.186.1.8416576. [DOI] [PubMed] [Google Scholar]
- 3.Eng J, Mysko WK, Weller GE, Renard R, Gitlin JN, Bluemke DA, Magid D, Kelen GD, Scott WW., Jr. Interpretation of Emergency Department radiographs: a comparison of emergency medicine physicians with radiologists, residents with faculty, and film with digital display. AJR Am J Roentgenol. 2000;175(5):1233–1238. doi: 10.2214/ajr.175.5.1751233. [DOI] [PubMed] [Google Scholar]
- 4.Curtis DJ, Gayler BW, Gitlin JN, Harrington MB. Teleradiology: results of a field trial. Radiology. 1983;149(2):415–418. doi: 10.1148/radiology.149.2.6622684. [DOI] [PubMed] [Google Scholar]
- 5.Scott WW, Jr., Rosenbaum JE, Ackerman SJ, Reichle RL, Magid D, Weller JC, Gitlin JN. Subtle orthopedic fractures: teleradiology workstation versus film interpretation. Radiology. 1993;187(3):811–815. doi: 10.1148/radiology.187.3.8497636. [DOI] [PubMed] [Google Scholar]
- 6.Krupinski E, Gonzales M, Gonzales C, Weinstein RS. Evaluation of a digital camera for acquiring radiographic images for telemedicine applications. Telemed J E Health. 2000;6(3):297–302. doi: 10.1089/153056200750040156. [DOI] [PubMed] [Google Scholar]
- 7.Smathers RL, Bush E, Drace J, Stevens M, Sommer FG, Brown BW, Jr., Karras B. Mammographic microcalcifications: detection with xerography, screen-film, and digitized film display. Radiology. 1986;159(3):673–677. doi: 10.1148/radiology.159.3.3704149. [DOI] [PubMed] [Google Scholar]
- 8.Mannino DM, Kennedy RD, Hodous TK. Pneumoconiosis: comparison of digitized and conventional radiographs. Radiology. 1993;187(3):791–796. doi: 10.1148/radiology.187.3.8497632. [DOI] [PubMed] [Google Scholar]
- 9.Gitlin JN, Scott WW, Bell K, Narayan A. Interpretation accuracy of a CCD film digitizer. J Digit Imaging. 2002;15(Suppl):57–63. doi: 10.1007/s10278-002-5099-5. [DOI] [PMC free article] [PubMed] [Google Scholar]
- 10.Obuchowski NA. Sample size tables for receiver operating characteristic studies. AJR Am J Roentgenol. 2000;175(3):603–608. doi: 10.2214/ajr.175.3.1750603. [DOI] [PubMed] [Google Scholar]
- 11.American College of Radiology (ACR) Breast Imaging Reporting and Data System Atlas (BI-RADS® Atlas) Reston, VA: ACR; 2003. [Google Scholar]
- 12.ACR Practice Guideline for the Performance of Screening Mammography, ACR Practice Guidelines—Screening Mammography. Reston, VA: ACR; 2004. pp. 317–328. [Google Scholar]
- 13.Applegate KE, Tello R, Ying J. Hypothesis testing III: counts and medians. Radiology. 2003;228(3):603–608. doi: 10.1148/radiol.2283021330. [DOI] [PubMed] [Google Scholar]
- 14.Langlotz CP. Fundamental measures of diagnostic examination performance: usefulness for clinical decision making and research. Radiology. 2003;228(1):3–9. doi: 10.1148/radiol.2281011106. [DOI] [PubMed] [Google Scholar]
- 15.Obuchowski NA. Receiver operating characteristic curves and their use in radiology. Radiology. 2003;229(1):3–8. doi: 10.1148/radiol.2291010898. [DOI] [PubMed] [Google Scholar]
- 16.Metz CE, Herman BA, Roe CA. Statistical comparison of two ROC estimates obtained from partially-paired datasets. Med Decis Making. 1998;18:110. doi: 10.1177/0272989X9801800118. [DOI] [PubMed] [Google Scholar]
- 17.Kundel H, Polansky M. Measurement of observer agreement. Radiology. 2003;228:303–308. doi: 10.1148/radiol.2282011860. [DOI] [PubMed] [Google Scholar]
- 18.Gitlin JN, Cook LL, Linton OW, Garrett-Mayer E. Comparison of “B” readers’ interpretations of chest radiographs for asbestos related changes. Acad Radiol. 2004;11:843–856. doi: 10.1016/j.acra.2004.04.012. [DOI] [PubMed] [Google Scholar]
- 19.Morton MJ, Whaley DH, Brandt KR, Amrami KK. Screening mammograms: interpretation with computer-aided detection—prospective evaluation. Radiology. 2006;239:375. doi: 10.1148/radiol.2392042121. [DOI] [PubMed] [Google Scholar]
- 20.Kallergi M, Lucier BJ, Berman CG, Hersh MR, Kim JJ, Szabunio MS, Clark RA. High-performance wavelet compression for mammography: localization response operating characteristic evaluation. Radiology. 2006;238(1):62–73. doi: 10.1148/radiol.2381040896. [DOI] [PubMed] [Google Scholar]


