Abstract
The echogenicity, echotexture, shape, and contour of a lesion are revealed to be effective sonographic features for physicians to identify a tumor as either benign or malignant. Automatic contouring for breast tumors in sonography may assist physicians without relevant experience, in making correct diagnoses. This study develops an efficient method for automatically detecting contours of breast tumors in sonography. First, a sophisticated preprocessing filter reduces the noise, but preserves the shape and contrast of the breast tumor. An adaptive initial contouring method is then performed to obtain an approximate circular contour of the tumor. Finally, the deformation-based level set segmentation automatically extracts the precise contours of breast tumors from ultrasound (US) images. The proposed contouring method evaluates US images from 118 patients with breast tumors. The contouring results, obtained with computer simulation, reveal that the proposed method always identifies similar contours to those obtained with manual sketching. The proposed method provides robust and fast automatic contouring for breast US images. The potential role of this approach might save much of the time required to sketch a precise contour with very high stability.
Key words: Ultrasonography, breast neoplasm, computer-aided diagnosis (CAD), image segmentation, radiographic image interpretation, level set method
Introduction
The American Cancer Society (ACS) has observed that accurate and reliable diagnostic procedures are the most significant factor in early diagnosis.1 Early detection and treatment is undoubtedly the most effective way to lower the mortality rate from breast cancer. Mammography and sonography are frequently applied in clinical practices, and such modalities can help physicians differentiate between benign breast tumors from malignant lesions. Mammography can visualize nonpalpable and minimal tumors, but always has a high false-positive value.2 By contrast, breast sonography has been shown to be an effective adjunct to mammography in lowering the number of negative biopsy results.3–5 Although breast sonography acts as an auxiliary to mammography, an ultrasound (US) examination is more convenient and safe than mammography for patients during a regular physical examination, especially for palpable tumors.
Physicians diagnose breast tumors by analyzing the characteristics of the lesion in US images. Experienced physicians can identify a breast tumor in an US image from the tumor’s shape and the contrast of internal echoes. Shape data, provided by a tumor contour, is important to physicians in making diagnostic decisions. A previously proposed computer-aided diagnosis (CAD) algorithm6 has been shown to distinguish effectively and reliably between benign and malignant lesions based on the tumor’s shape. The appearance of the proposed shape features was almost independent of the sonographic gain setting, and could tolerate reasonable variation in boundary delineation associated with the different machines employed. However, a digital sonography always includes speckle noise and tissue-related textures. In practice, contouring tumors in a digitized ultrasonic image is difficult and time-consuming.7 As ultrasonic imaging becomes increasingly widespread, the clinical application of an effective automatic contouring technique is becoming urgent. A precise US image segmentation method can facilitate accurate diagnosis of a breast tumor.
Most traditional edge-based segmentation methods depend on the gradient of an image to determine the object’s boundary. Such methods were not designed to detect discontinuities of image intensity, so edge-based methods do not perform well when applied to sonography. Region-based segmentation methods,8 such as split-and-merge,9 region-growing10 and morphological watershed transformation,11 are sensitive to noise and contrast in images. The speckles, weak edges, and tissue-related textures in US images undoubtedly prevent most split-and-merge and region-growing models from satisfactorily determining the desired boundary of a tumor. The watershed transformation, which is a reliable unsupervised model, was applied to solve diverse image segmentation problems. Various approaches12–14 presented preprocessing procedures to enhance the segmentation effectiveness of watersheds. However, a breast US image has many varieties of tissues, and boundary discontinuities often lead to difficulties in obtaining accurate tumor contours.
The snake deformation method, ie, active contour model (ACM), is extensively employed to determine the boundary of an object of interest in an ultrasonic image.15–17 Obtaining the real boundary of a region by applying the ACM-deformation depends on an initial estimate of contours. However, automatically generating a fitted initial contour is an arduous task; moreover, the ACM-deformation procedure is very time-consuming. Therefore, this work developed an adaptive contour initializing procedure, as part of the proposed contouring algorithm, to generate formal initial contours for tumors in breast US images. The level set method,18 a newly developed deformable model that surpassed ACM in segmentation performance, was utilized to conserve the time needed to sketch a precise contour. The level set method is based on an active contour energy minimization that solves the computation of minimal distance curves. The curvature-dependent speeds of moving curves determine the deformation directions. The proposed approach integrates the advantages of an adaptive initial contouring procedure and the level set segmentation methods to extract breast tumor contours from US images with very high stability. Reliable contouring systems improve the accuracy of diagnostic decisions in CAD applications.
Materials and Methods
Data Acquisition
An ultrasonic image database included 118 US images of pathologically proven benign breast tumors from 84 patients and carcinomas from 34 patients. The database included only one image from each patient. The US images were captured at the largest diameter of each tumor (the largest diameter of tumor >1 cm in all cases). The patients’ ages ranged from 22 to 67 years. All digital US images were obtained using Philips HDI 5000 system (Advanced Technology Laboratories, Bothell, WA) with a L12-5 small part transducer, which is a linear-array transducer with a frequency of 5–12 MHz and a scan width of 38 mm. Breast nodules were scanned by real-time compound imaging (SonoCT) in the survey mode, but without the use of the harmonic techniques. No acoustic stand-off pad was used. The capturing resolution of US images was 640 × 476 pixels. The sonographic gain setting remained unchanged throughout the entire period of study, except for small changes made to obtain a better view in a few cases. Each monochrome ultrasonic image was quantized into eight bits with 256 gray levels. The entire database was supplied by the coauthor, an experienced radiologist, Dr. Moon from the Department of Diagnostic Radiology Seoul National University Hospital, Seoul, South Korea. Another coauthor, Dr. Chen, a breast surgeon who is familiar with breast US interpretations, manually determined the contours of the tumor and then saved them in files for comparison with the automatically generated contours.
Preprocessing
Medical US images include considerable noise, speckles, and tissue textures, making segmentation difficult. Preprocessing must be performed before segmentation. The effective preprocessing method for contouring should aim to decrease noises and preserve valuable information, such as the edge and boundary of the mass lesions. The anisotropic diffusion method, which is based on a partial differential equation,19,20 is very practical not only in image de-noising but also in preserving the important boundary information. However, the anisotropic diffusion equation is not widely adopted, since it has not been widely analyzed, and lacks a stable, accurate numerical implementation. A sophisticated filter performing modified curvature diffusion equation (MCDE) has been demonstrated to be more aggressive than anisotropic diffusion at enhancing and preserving edges for low-contrast image.21 The MCDE de-nosing approach modifies the anisotropic diffusion equation, and employs a variable conductance to enhance the contrast of image edges (see Appendix 1).
This study performed the MCDE filter with k = 5 to enhance the breast US images. Figure 1 depict the de-noised results from applying the MCDE preprocessing method and two practical filters, ie, the arithmetic average filter and Gaussian low-pass filter. Figure 1(a) is an original magnified monochrome breast US image that includes a tumor with various contrast levels and noises. The processed images obtained using arithmetic average filter, Gaussian low-pass filter, and the MCDE filter are shown in Figure 1(b)–(d), respectively. These results clearly indicate that MCDE is superior to the other two filters in removing noise and preserving edges for the US image. The proposed method, using MCDE preprocessing, not only reduced the number of speckles, the amount of noises, and the number of tissue-related textures in ultrasonic images, but also preserved the shape and contrast of the breast tumor. After the US images are preprocessed, the suspected masses are extracted based on the following segmentation steps.
Fig 1.
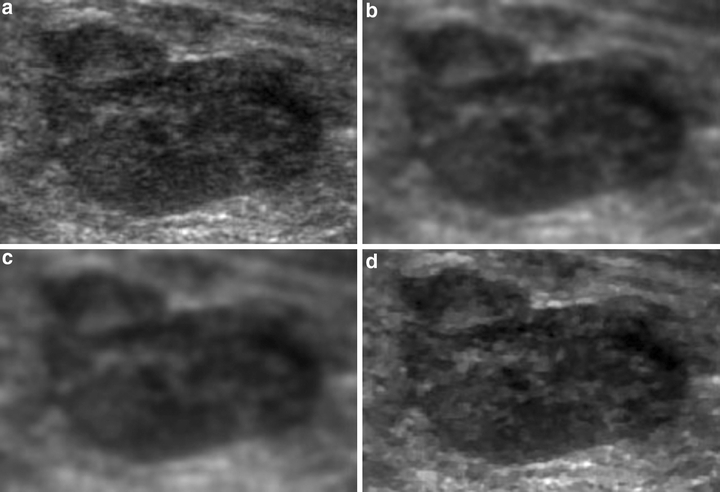
Results of the distinct preprocessing: (a) the original magnified US subimage, (b) through with 3× 3 arithmetic average filtering, (c) through with Gaussian low-pass filtering, (d) by the MCDE method
Initial Contouring
After the image preprocessing, an automatic thresholding method22 was conducted to transform a gray-level image into a binary image to locate the tumor position. Otsu’s method can specify the threshold to minimize the intraclass variance of the black and white pixels automatically. In this work, this automatic method always obtained a satisfactory coarse region of breast tumor. Therefore, the threshold-segmented area was applied to identify the largest connected region as a reference to define a rectangular region of interest (ROI) for the tumor. The automated ROI cannot only be employed to obtain the initial contour in the proposed method, but also in various ROI-based CAD systems.23–26
Since the tumor shape is nearly ellipsoid, a circular contour with adaptive parameters (the center and radius of a circle) was adopted as the initial contour. Let points p1 and p2 with coordinates (x1, y1) and (x2, y2) be the upper-left corner and lower-right corner, respectively, of the identified ROI rectangle. The center of the circular contour is positioned at the midpoint of p1 and p2, ie,  . Besides, the radius of the circular is determined as
  , where γ is an adaptive proportion parameter that prevents the circular contour out of the identified ROI compass. Figure 2 illustrates the processing results from adaptive initial contouring method. The proposed method always obtains a satisfactory initial contour for the following level set segmentation to extract a precise breast tumor contour from US images. Furthermore, the proposed system also applies an additional control scheme to change the positions of p1 and p2 manually when the physician is not satisfied with the ROI assigned by automatic thresholding.
Fig 2.
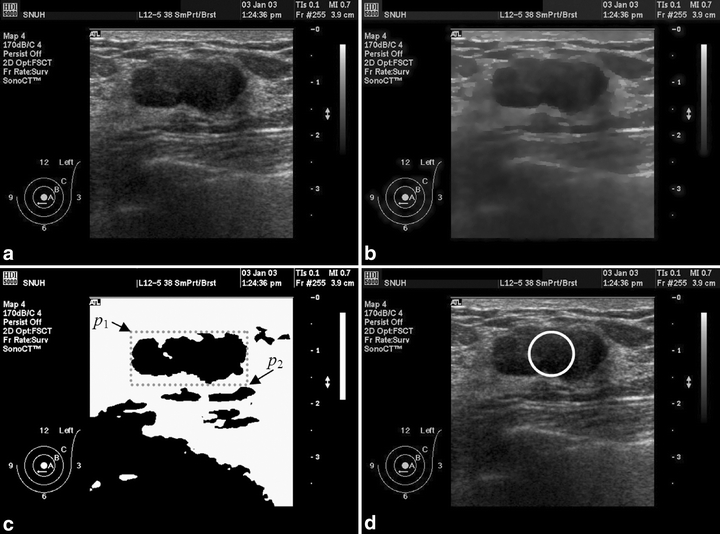
Ultrasonic image is processed with the adaptive initial contouring method: (a) an original 640 × 476 digital image was captured from the sonographic scanner, (b) after the MCDE filter, (c) after automatic thresholding method and then obtains the ROI rectangle, (d) result of the circular initial contour.
Level Set Contouring
The level set method, which is a numerical technique for calculating and analyzing the curve propagation, has been applied successfully to solve a wide range of difficult image segmentation problems. It offers a highly robust and accurate model for tracking interfaces with complex motions. The concept of level set method was introduced in Appendix 2. In the proposed contouring method, the original US image was first processed using the MCDE filtering. A closed circle contour was obtained as the initial contour function after the adaptive initial contouring. Finally, the level set method was performed to segment the tumor in the US image. Figure 3 presents a flowchart of the proposed approach, in a form that includes the preprocessing, initial contouring and segmentation phases.
Fig 3.
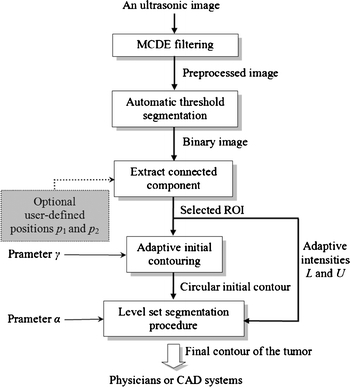
The flowchart of the proposed method.
Contour Evaluation
Three practical similarity measures,27 the similarity index (SI), overlap fraction (OF) and extra fraction (EF) between the manually determined contours and the automatically detected contours were calculated for quantitative analysis of the contouring result. The SI is defined as
 |
1 |
where REF and SEG denote the areas covered by the manually sketched contours (by an experienced physician) and that covered by the contours generated by the proposed method, respectively. Figure 4 illustrates the relationship between the REF and SEG. The term REF ∩ SEG denotes the area of the intersection of the reference and the automated segmentation (overlap). The SI expresses the similar degree between SEG area and REF area. The OF and EF are defined as
 |
2 |
 |
3 |
Fig 4.
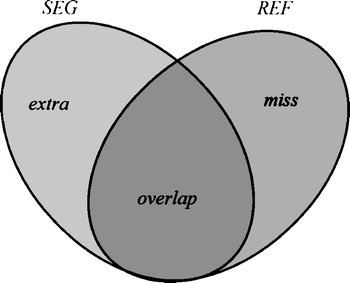
Comparison of an automated segmentation area (SEG) with the manual contouring area (REF), with (overlap) the correctly segmented pixels, (extra) the false positives and (miss) the false negatives.
The OF measures the correctly segmented area relative to the reference area. The EF measures the area that is falsely segmented as lesion relative to the area in the reference. The area of  corresponds to the extra area in Figure 4. If SI and OF are close to 1 and EF computation is close to 0, then the contours generated by automatic segmentation are similar to the manual contours obtained by a physician. The similarity measures thus allow evaluation of the segmentations in a quantitative and objective way.
Results
This section presents the evaluation of contours to analyze the effectiveness of the proposed method. This work experimented on a total of 118 pathology-proven cases (including 84 benign breast tumors and 34 malignant ones) with manual-sketched contours to test the accuracy of the proposed contouring method. These simulations were made on a single CPU Intel Pentium-VI 2.4 GHz personal computer with Microsoft Windows XP operating system. The MCDE preprocessing and the automatic thresholding methods were first performed to yield the ROI area of the tumor in an ultrasonic image. The selected ROI was applied to generate the initial contour, where the adaptive proportion parameter γ = 0.85. The level set method was then employed to achieve a precise segmentation for the tumor. With the curvature parameter α ranging from 0.15 to 0.25, the proposed level set method obtained a stable and the highest accuracy.
Figures 5 and 6 show the contour evaluations (curvature parameter α = 0.20) for benign and malignant cases, respectively. Figure 7(a)–(c) shows the original magnified monochrome breast ultrasound images with benign masses (benign case nos. 11, 55, and 71). Figure 7(d)–(f) shows the contours manually sketched with reference to the corresponding US images, Figure 7(g)–(i) plots the contours determined by the proposed system and the results of measures (SI, OF, EF) are (0.95, 0.93, 0.02), (0.86 0.85 0.13), and (0.95 0.94 0.05), respectively. Figure 8(a)–(c) show the original magnified monochrome breast US images with malignant tumors (malignant case nos. 4, 5, and 8). Figure 8(d)–(f) show the manually sketched contours, Figure 8(g)–(i) illustrate the corresponding contours using the proposed method and the results of measures (SI, OF, EF) are (0.95, 0.93, 0.03), (0.94, 0.90, 0.02) and (0.91, 0.90, 0.02), respectively. Table 1 presents the results of the SI, OF, and EF measurements categorized by pathology-proven results for the 118 US images. The segmentation results reveal that only a small number of cases (less than 5%) might generate an undesired segmentation. Such cases include the benign case no. 74 and malignant case no. 29, as depicted in Figure 9(a) and (b), respectively. Figure 9(c)–(d) and (e)–(f) illustrates the manually sketched contours and the corresponding contours using the proposed method. Because the boundaries are extremely unclear, the proposed method obtained unfavorable results (0.78, 0.91, 0.43) and (0.75, 0.78, 0.30), respectively. In terms of image segmentation, automatic contouring for these cases is unattainable; the tumor contour needs further manual adjustment to attain a satisfactory result.
Fig 5.
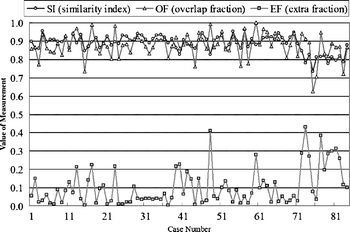
Contouring performance (84 benign cases) of the proposed method for the US images.
Fig 6.
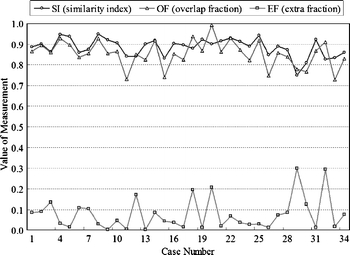
Contouring performance (34 malignant cases) of the proposed method for the US images.
Fig 7.
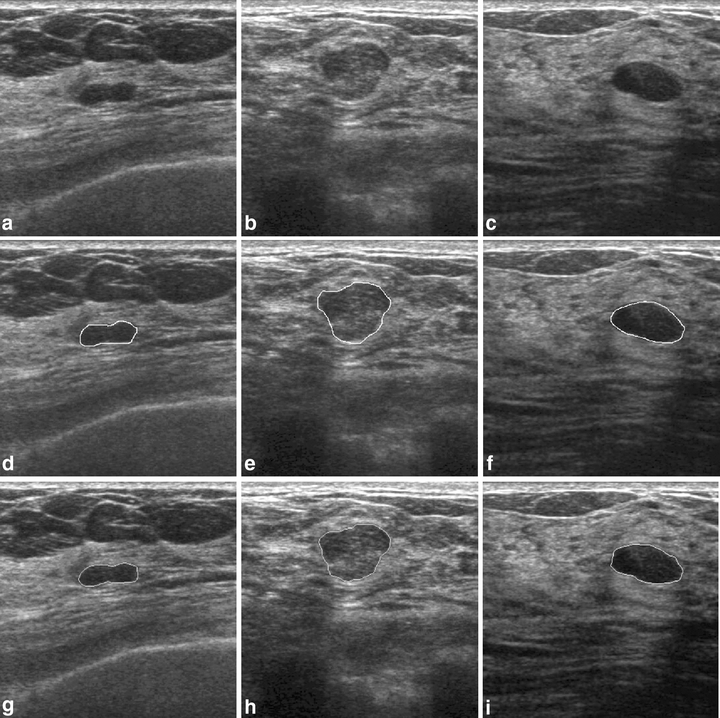
Results of contour segmentation (benign cases): (a)–(c) original magnified monochrome breast US images, (d)–(f) manual-sketched contours, and (g)–(i) the corresponding automatic-sketched contours.
Fig 8.
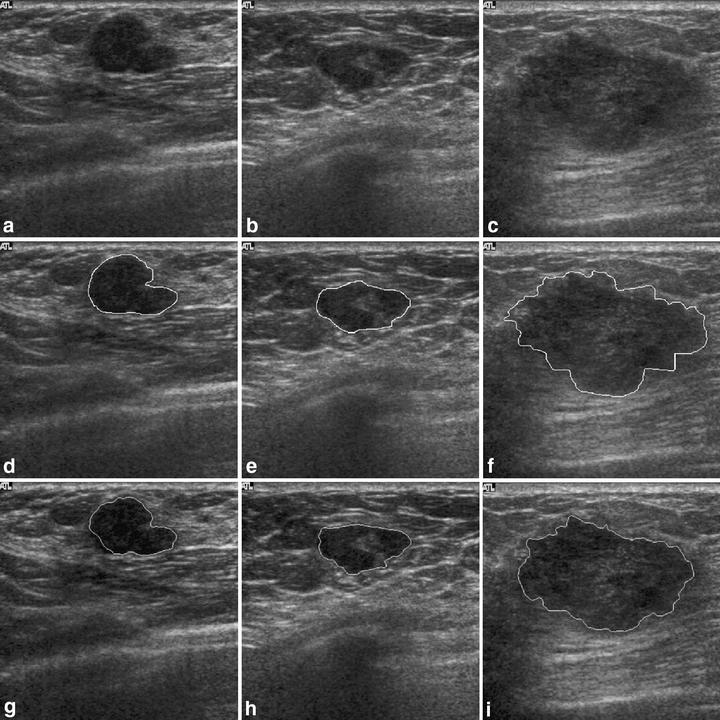
Results of contour segmentation: (a)–(c) original magnified monochrome breast US images (malignant cases), (d)–(f) manual sketched contours, and (g)–(i) the corresponding automatic-sketched contours.
Table 1.
The Contouring Evaluations Using the Measurements for US Images
| Pathology-proven Result | Average SI | Average OF | Average EF |
|---|---|---|---|
| Benignancy (84 cases) | 0.8826 | 0.8710 | 0.1037 |
| Malignancy (34 cases) | 0.8610 | 0.8222 | 0.0761 |
| Whole database (118 cases) | 0.8764 | 0.8570 | 0.0957 |
SI: similarity index, OF: overlap fraction, EF: extra fraction
Fig 9.
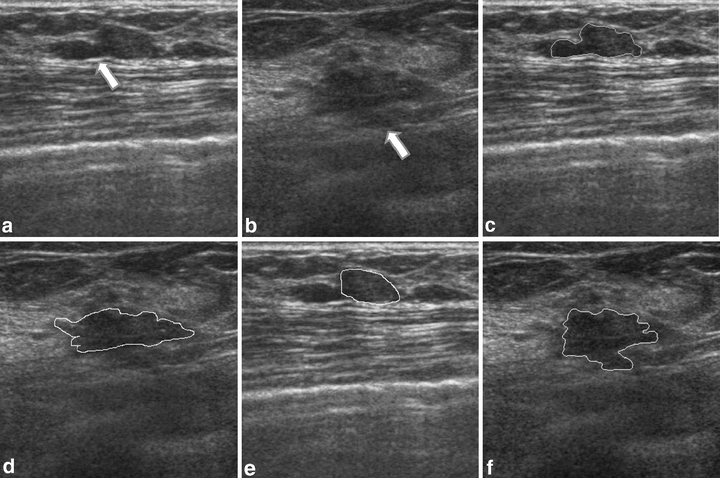
Examples of the undesired segmentation: (a)–(b) original magnified US tumor images with extremely unapparent boundaries (the arrows), (c)–(d) manual-sketched contours, and (e)–(f) the corresponding automatic sketched contours.
Discussion
This study has presented an efficient method for automatically detecting contours of breast tumors in sonography. The preprocessing of the proposed method applied an MCDE filter to reduce the any amount of noises, but preserved the shape and contrast of breast tumor. An adaptive initial contouring method was utilized to generate the circular contour using the chosen ROI within the US image, and then the deformation-based level set segmentation automatically produced an exact contour of the tumor. A US image database consisting of 118 cases was employed for evaluation in this study. The proposed method was found to determine the breast tumor contours that are very similar to manual-sketched contours. The experimental results reveal that the proposed method can practically determine the contours of a breast tumor from US images.
Superficial measure and shape information from tumor’s contours is thought to be usable in clinical diagnosis. Shape-based breast tumor diagnosis has the benefit of being nearly independent of the different US machines. Chen et al.6 have presented a CAD based on the shape analysis with good system performance. However, it relies on physicians to manually segment tumors. This study proposes an automatic tumor segmentation method for shape analysis of a CAD system. Moreover, the deformation time of the ACM28 is about 100 times as long as that of the proposed level set contouring method. The proposed method obtained better segmentation precision and faster computation than the ACM method.
The main point of this study is not that the automatic contouring technique is superior to the one undertaken manually, as the automatic and manual contours do not necessarily follow the same factual pathological border. However, in CAD applications, automatic segmentation can save much of the time required when sketching a highly stable precise contour. Future work should apply the proposed approach to derive the precise shapes of tumors in three-dimension (3-D) US images. Information about the shape and volume of a tumor may be significant to physicians in making diagnoses. A physician cannot manually sketch the contours of tumors in a 3-dimensional sonography of many hundreds of 2-dimensional (2-D) images. The morphological features obtained using the proposed method, describing the shape and contour of the lesion from other organs such as liver, kidneys, and thyroid glands, are also useful in assisting radiologists in their interpretations and increasing diagnostic accuracy. Developing this automatic contouring method is of priority concern, and its medical application is urgent.
Acknowledgement
The authors would like to thank the National Science Council of the Republic of China (Taiwan) for financially supporting this research under Contract No. NSC94-2213-E- 029-016.
Appendix 1
Let I(x, y) denote an input image. The MCDE equation is given as
 |
4 |
where f = f(x,y,t) and  . Progressively smoothed versions of the image are obtained by choosing progressively greater values of t from the solution. The conductance function c(·) is monotonically decreasing and
  , where k is a constant parameter used to determine the contrast of edges.
Appendix 2
The basic concept of level set approach is to express a closed curve as a set of 2-dimension planar curve function ΓΓ(t), which consists of the zero level set point at time t.18 Let Γ(t = 0) be a closed initial planar curve; instead of propagating the curve directly, it embeds the curve as the zero level set of a higher order function ϕ called the level set function. The function ϕ is defined by
 |
5 |
where x is a point in Euclidean plane R2 and d is the distance from x to the initial contour Γ(0). The sign is chosen if the point x is outside (+) or inside (−) the initial contour. Thus, the initial function ϕ(x,t = 0) has the property of
 |
6 |
The objective is to produce an equation for the evolving function ϕ(x,t), which contains the embedded motion of Γ(t) as the level set {ϕ = 0}. Because the evolving function ϕ is always zero on the propagating hypersurface, no matter how much time t is, ϕ(x(t),t) is zero. Now, Γ(t) can be expressed as ϕ(x,t) = 0, by the chain rule, the equation can be expressed as
 |
7 |
Suppose F is a speed function in direction of normal vector in planar curve, then  where
where  represents the absolute gradient value of level set function. Thus, the level set evolution equation can be defined as
 |
8 |
with a given value of the initial function ϕ(x,t = 0). The speed function F at any one point is based solely on the input intensity u0 at that point:29
 |
9 |
and
 |
10 |
where α is a free curvature parameter that controls the degree of smoothness, and U and L denote the adaptive maximal and minimal intensities in the identified ROI subimage, respectively. Figure 10 shows the surface propagation of an initial curve and the accompany movement of the level set function ϕ.
Fig 10.
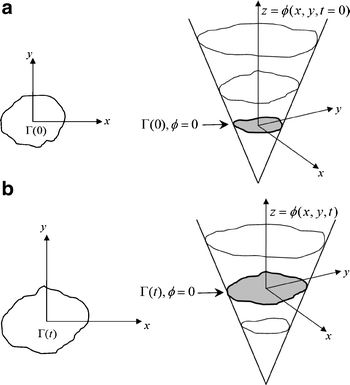
Level set curve propagation: (a) the initial curve and the corresponding surface, (b) the curve and the corresponding surface at time t.
References
- 1.ACS: Breast cancer facts and figures 2003–2004. American Cancer Society, 2005
- 2.Zheng Y, Greenleaf JF, Gisvold JJ. Reduction of breast biopsies with a modified self-organizing map. IEEE Trans Neural Netw. 1997;8(6):1386–1396. doi: 10.1109/72.641462. [DOI] [PubMed] [Google Scholar]
- 3.Jackson VP, Bassett LW. Breast sonography. Breast Dis. 1998;10(3-4):55–66. doi: 10.3233/bd-1998-103-408. [DOI] [PubMed] [Google Scholar]
- 4.Rahbar G, et al. Benign versus malignant solid breast masses: US differentiation. Radiology. 1999;213(3):889–894. doi: 10.1148/radiology.213.3.r99dc20889. [DOI] [PubMed] [Google Scholar]
- 5.Skaane P, Engedal K. Analysis of sonographic features in the differentiation of fibroadenoma and invasive ductal carcinoma. AJR Am J Roentgenol. 1998;170(1):109–114. doi: 10.2214/ajr.170.1.9423610. [DOI] [PubMed] [Google Scholar]
- 6.Chen CM, et al. Breast lesions on sonograms: computer-aided diagnosis with nearly setting-independent features and artificial neural networks. Radiology. 2003;226(2):504–514. doi: 10.1148/radiol.2262011843. [DOI] [PubMed] [Google Scholar]
- 7.York G, Kim Y. Ultrasound processing and computing: Review and future directions. Annu Rev Biomed Eng. 1999;1:559–588. doi: 10.1146/annurev.bioeng.1.1.559. [DOI] [PubMed] [Google Scholar]
- 8.McElhaney RM. Algorithms for graphics and image processing. Proc IEEE. 1983;71(9):1116–1117. doi: 10.1109/PROC.1983.12734. [DOI] [Google Scholar]
- 9.Ladak HM, et al. Prostate boundary segmentation from 2D ultrasound images. Med Phys. 2000;27(8):1777–1788. doi: 10.1118/1.1286722. [DOI] [PubMed] [Google Scholar]
- 10.Horsch K, et al. Automatic segmentation of breast lesions on ultrasound. Med Phys. 2001;28(8):1652–1659. doi: 10.1118/1.1386426. [DOI] [PubMed] [Google Scholar]
- 11.Overhoff HM, et al. Visualization of anatomical structures of epigastric organs by use of automatically segmented 3-D ultrasound image volumes-first results. Biomed Tech (Berl) 2002;47(Suppl 1 Pt 2):633–635. doi: 10.1515/bmte.2002.47.s1b.633. [DOI] [PubMed] [Google Scholar]
- 12.Huang YL, Chen DR. Watershed segmentation for breast tumor in 2-D sonography. Ultrasound Med Biol. 2004;30(5):625–632. doi: 10.1016/j.ultrasmedbio.2003.12.001. [DOI] [PubMed] [Google Scholar]
- 13.Grau V, et al. Improved watershed transform for medical image segmentation using prior information. IEEE Trans Med Imag. 2004;23(4):447–458. doi: 10.1109/TMI.2004.824224. [DOI] [PubMed] [Google Scholar]
- 14.O’Callaghan RJ, Bull DR. Combined morphological-spectral unsupervised image segmentation. IEEE Trans Image Process. 2005;14(1):49–62. doi: 10.1109/TIP.2004.838695. [DOI] [PubMed] [Google Scholar]
- 15.Lobregt S, Viergever MA. A discrete dynamic contour model. IEEE Trans Med Imag. 1995;14(1):12–24. doi: 10.1109/42.370398. [DOI] [PubMed] [Google Scholar]
- 16.Kass M, Witkin A, Terzopoulos D: Snakes-active contour models. Int J Comput Vis 321–331, 1987
- 17.Cohen LD, Cohen I. Finite-element methods for active contour models and balloons for 2-D and 3-D images. IEEE Trans Pattern Anal Mach Intell. 1993;15(11):1131–1147. doi: 10.1109/34.244675. [DOI] [Google Scholar]
- 18.Osher S, Sethian J. Fronts propagating with curvature dependent speed: Algorithms based on Hamilton–Jacobi formulations. J Comput Phys. 1988;79:12–49. doi: 10.1016/0021-9991(88)90002-2. [DOI] [Google Scholar]
- 19.Black MJ, et al. Robust anisotropic diffusion. IEEE Trans Image Process. 1998;7(3):421–432. doi: 10.1109/83.661192. [DOI] [PubMed] [Google Scholar]
- 20.Perona P, Malik J. Scale-space and edge detection using anisotropic diffusion. IEEE Trans Pattern Anal Mach Intell. 1990;12(7):629–639. doi: 10.1109/34.56205. [DOI] [Google Scholar]
- 21.Whitaker RT, Xinwei X: Variable-conductance, level-set curvature for image denoising. 2001
- 22.Otsu N. Threshold selection method from gray-level histograms. IEEE Trans Syst Man Cybern. 1979;9(1):62–66. doi: 10.1109/TSMC.1979.4310076. [DOI] [Google Scholar]
- 23.Huang YL, et al. Image retrieval with principal component analysis for breast cancer diagnosis on various ultrasonic systems. Ultrasound Obstet Gynecol. 2005;26(5):558–566. doi: 10.1002/uog.1951. [DOI] [PubMed] [Google Scholar]
- 24.Chang RF, et al. Computer-aided diagnosis for surgical office-based breast ultrasound. Arch Surg. 2000;135(6):696–699. doi: 10.1001/archsurg.135.6.696. [DOI] [PubMed] [Google Scholar]
- 25.Chen DR, et al. Texture analysis of breast tumors on sonograms. Semin Ultrasound CT MR. 2000;21(4):308–316. doi: 10.1016/S0887-2171(00)90025-8. [DOI] [PubMed] [Google Scholar]
- 26.Chen DR, Chang RF, Huang YL. Computer-aided diagnosis applied to US of solid breast nodules by using neural networks. Radiology. 1999;213(2):407–412. doi: 10.1148/radiology.213.2.r99nv13407. [DOI] [PubMed] [Google Scholar]
- 27.Anbeek P, et al. Probabilistic segmentation of white matter lesions in MR imaging. NeuroImage. 2004;21(3):1037–1044. doi: 10.1016/j.neuroimage.2003.10.012. [DOI] [PubMed] [Google Scholar]
- 28.Chen CM, Lu HH. An adaptive snake model for ultrasound image segmentation: Modified trimmed mean filter, ramp integration and adaptive weighting parameters. Ultrason Imag. 2000;22(4):214–236. doi: 10.1177/016173460002200403. [DOI] [PubMed] [Google Scholar]
- 29.Cates JE, Lefohn AE, Whitaker RT. GIST: An interactive, GPU-based level set segmentation tool for 3D medical images. Med Image Anal. 2004;8(3):217–231. doi: 10.1016/j.media.2004.06.022. [DOI] [PubMed] [Google Scholar]


