Abstract
This work presents the usefulness of texture features in the classification of breast lesions in 5518 images of regions of interest, which were obtained from the Digital Database for Screening Mammography that included microcalcifications, masses, and normal cases. Sixteen texture features were used, i.e., 13 were based on the spatial gray-level dependence matrix and 3 on the wavelet transform. The nonparametric K-NN classifier was used in the classification stage. The results obtained from receiver operating characteristic analysis indicated that the texture features can be used for separating normal regions and lesions with masses and microcalcifications, yielding the area under the curve (AUC) values of 0.957 and 0.859, respectively. However, the texture features were not very effective for distinguishing between malignant and benign lesions because the AUC was 0.617 for masses and 0.607 for microcalcifications. The study showed that the texture features can be used for the detection of suspicious regions in mammograms.
Key Words: Mammography, computer-aided diagnosis, texture analysis
Introduction
The early detection of breast cancer is important for reducing the mortality rate due to this illness. Mammography is currently the most effective method for early detection of breast cancer.1,2 Thurfjell et al have shown that double reading by two radiologists can increase the detection rate of cancer by up to 15%.3 It has also been shown that computer-aided diagnosis (CAD) systems can be used to indicate potential sites of lesions in mammograms.4
Many CAD systems described in the literature included texture features for finding structures of mammographic interest. Kegelmeyer et al.5 presented a method for detection of spiculated mammographic lesions. In their study, the histogram for the edge orientations and measures of texture energy in local windows were used for investigations of vectors of image characteristics. Based on these vectors, a binary decision tree was used for determining the probability of the lesions. The method was tested in a set of five images, yielding a sensitivity of 83% with 0.6 false positive per image. The wavelet transform was applied for analysis of masses,6,7 and texture features based on the matrices of spatial gray-level dependence (SGLD) were used for each region of interest (ROI) at different scales. The best features were selected by the stepwise method and by minimization of the Mahalanobis distance. Petrick et al.6 have shown a sensitivity of 90% with 4.4 false positives per image for the first combination of training/testing cases, and 80% with 2.3 false positives per image for the second combination. Miller and Ramsey8 published a study on detection of malignant masses in mammograms based on a nonlinear analysis method for multiscales. The algorithm was divided into three steps: (1) determination of resolution level by use of maximum entropy, (2) use of an adaptative method of thresholding for detection of hardwired structures, and (3) use of measures for form, opacity, and texture to classify the structures as malignant and benign. For training of the algorithm, 67 pairs of mammograms in the mediolateral oblique (MLO) projections were used. The leave-one-out technique was used for testing of the algorithm. According to the authors, it was possible to detect about 85% of malignant masses. Petrick et al.9 developed an algorithm for detection of masses by use of a region-growing technique on the objects. The system used a filter for distinction of contrast, which they used in their previous work7 to enhance structures of mammographic interest. The region-growing-based technique was then applied to each of the identified structures, with gray scales and the gradient used to reduce the overlapping of structures. Each object was then classified as a mass or normal tissue based on morphologic and multiresolution texture features. According to the authors, the system was able to detect 97% of the masses in a database of 253 mammograms.
Kim and Park10 presented a comparative study of texture-analysis methods that was performed by use of a surrounding region-dependence method, which included conventional texture-analysis methods, such as the SGLD method, the gray-level run-length method, and the gray-level difference method. Textural features extracted by these methods were exploited for classification of ROIs into positive ROIs containing clustered microcalcifications and negative ROIs containing normal tissues. A three-layer backpropagation neural network was used as a classifier. The results of the use of the neural network for the texture-analysis methods were evaluated by use of a receiver operating characteristic (ROC) analysis. The surrounding region-dependence method was shown to be superior to the conventional texture-analysis method with respect to the classification accuracy and computational complexity.
Our objective in this work was to demonstrate the usefulness of texture features for the classification of breast lesions and their potential use for the automated detection of these lesions in a CAD system. For this purpose, we used Haralick features, which were established in the SGLD matrix, and features based on the wavelet transform.
Materials and Methods
Database
The database used was the Digital Database of Screening Mammography (DDSM), which was developed by a joint effort involving researchers at the Massachusetts General Hospital (D. Kopans, R. Moore), the University of South Florida (K. Bowyer), and the Sandia National Laboratories (P. Kegelmeyer).11 With this database, researchers at the University of Chicago separated the existing lesions in mammograms into 5 × 5cm ROIs, which were placed in the center of mass lesions. Lesions that were larger than 5 × 5 cm were excluded. Our database contained 2818 ROIs with lesions, of which 1447 were benign lesions with masses and/or microcalcifications and 1371 were malignant lesions with masses and/or microcalcifications. All of the lesions had been classified using the Breast Imaging Reporting and Data System (BI-RADS) lexicon by an expert mammography radiologist.12 Additional 2700 ROIs of 5 × 5cm normal areas were extracted from the DDSM by researchers at the Hospital das Clinicas de Ribeirão Preto at the University of São Paulo. These images were stored in the same format, with the same contrast resolution (12 bits) and the same pixel size (50 μm) as those of the DDSM images processed at the Kurt Rossmann Laboratories at the University of Chicago. The 2700 normal images were extracted in order to be balanced for breast density for the BI-RADS standard; 675 ROIs belonged to the category of density I, 675 of density II, 675 of density III, and 675 of density IV. Thus, the database of normal images was well balanced in mammographic density.
Normalization of the Database
In order to normalize the values of gray levels of the images digitized with different scanners, we converted the values of gray levels to values of optical density. Thus, the variability of the gray levels for digitized images obtained with different scanners was removed. The database at the University of South Florida was produced by use of four different scanners. For each scanner, the value of optical density at each pixel produced a gray level. This conversion was not uniform for all scanners. Therefore, the researchers at the University of South Florida obtained straight lines for regression of conversion from gray level to optical density in each scanner by digitization of a phantom representing 21 different levels of optical density (Fig. 1). Thus, for each optical density of the scanner, there was a respective value of the gray level. The straight line of regression (Fig. 2) for estimation of optical density was determined for all of the 4096 gray levels.
Fig 1.
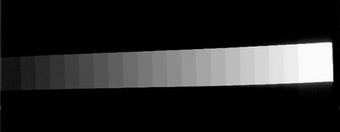
Digitized image of a calibration phantom with 21 different optical density levels used.
Fig 2.

Relationship between optical density and gray-level values for a Howtek scanner obtained with 21 different levels shown in Figure 1. Straight line of regression for data generated by Equation (1).
Thus, the straight lines of regression for the different scanners used were determined as summarized in the following equations:
 |
1 |
 |
2 |
 |
3 |
 |
4 |
where OD = optical density and GL = gray level value.
Characterization Scheme for the DDSM Images
In order to develop a detection system for breast lesions, one needs to characterize the ROIs extracted from the DDSM database containing lesions and normal areas. For texture analysis of the images, 13 statistical texture features were determined, i.e., energy, contrast, difference moment, correlation, inverse difference moment, entropy, sum entropy, difference entropy, sum average, sum variance, difference average, difference variance, and information measure of correlation (type I), and 6 spectral features based on the energy of the wavelet transform.13–15 The best features were selected by use of the Jeffries-Matusita distance,16 and the classification of the ROIs was carried out. The goal of the classification scheme was to verify whether the texture features would be able to separate the ROIs into the following four categories: (1) normals and abnormals, (2) microcalcifications and masses, (3) malignant and benign microcalcifications, and (4) malignant and benign masses. The classification scheme was also applied to the analysis of ROIs previously classified by radiologists as indeterminate (BI-RADS category 0) to differentiate between a normal class and an abnormal class. The intention in this analysis was to verify the possibility, in the use of texture features, for computerized detection of ROIs in mammograms.
Extraction of Features
The texture features were calculated from the average values for each co-occurrence matrix of gray levels p(i, j) with orientations θ at 0°, 45°, 90°, and 135°, as shown in Figure 3. The calculated features did not show any significant variations for distances d between 1 and 5. Therefore, the distance d was fixed at 1. The matrix p(i, j) is symmetrical because the occurrence of the pairs of pixels (i, j) and (j, i) is equal. The final matrix is normalized by the division of each element for the total number of pairs of gray levels, as described in Haralick et al.13
Fig 3.
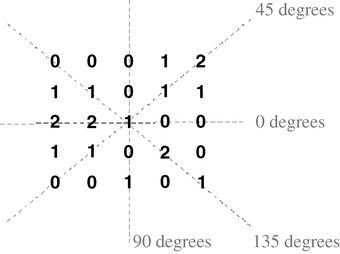
Orientations used in the co-occurrence matrix calculation.
All of the features used were normalized between 0 and 1 by use of Equation (5) below. Moreover, for simplification of the methods used for selection and classification, a Gaussian distribution was assumed for the probability distribution functions of the features.
 |
5 |
A spectral texture feature was also used, i.e., the energy of the wavelet transform.15 The L2 norm was used for the energy given by Equation (6):
 |
6 |
where N is the number of pixels in the image or subimage and xi is the ith pixel of the image or subimage.
The energy was calculated by use of the Haar wavelet transform at levels 2 and 3 of its decomposition, i.e., the extracted energy of the components at high frequencies in the horizontal, vertical, and diagonal directions. As described in Chang and Kuo,15 only the components at high frequencies were considered as more representative for texture analysis. In addition, levels 2 and 3 of the wavelet transform were included because these were considered more representative of mammographic structures.17,18
Feature Selection
For the selection of the best statistical texture features, we used the Jeffries‐Matusita (JM) distance.16 In the JM distance, a technique was used for measuring how much the two probability distribution functions are separated, where the value of better discrimination between the classes is close to  .
.
The JM distance, for the case of two classes, w1 and w2, is calculated by the following equation:
 |
7 |
In the case where p(x/w1) and p(x/w2) are described by Gaussian functions, the equation above becomes
 |
8 |
where
 |
9 |
and x represents a feature vector, p(x/w1) and p(x/w2) are the probability density functions for classes i and j, and μi, μj, ∑i, ∑j are the vector averages and covariance matrices for classes i and j, respectively.
When the two classes are completely separated, α tends to be infinite, and therefore Jij tends to be  . On the other hand, when the two classes are completely overlapped, α = 0, and therefore Jij = 0.
The feature selection was performed for each classification task. The best features were first selected for separation between normal and abnormal ROIs; second, for separation between masses and microcalcifications; third, between malignant and benign microcalcifications; and finally, between malignant and benign masses. Only the combination of the features yielding a value close to  was considered.
ROI Classification
The classification of the ROIs was made by use of the nonparametric classifier K-NN. The method of K-NN classification is an extension of the nearest-neighbor (NN) rule and carries through the classification of a feature vector x, extracted from an unknown case belonging to the group tested, associating it with the class having a larger number of representatives among the k neighboring samples of the group of training, or the decision is carried through the verification of the neighboring points of the next k.19 We assume a Euclidean distance to express the distance between two points in feature space. Thus, the distance between the points a and b in the feature space is given by
 |
10 |
where a and b are the feature vectors of the object that we desire to classify and of the known object in the training group, respectively, and d is the number of features.
Evaluation of the Classification Performance
Training and Testing Protocol
A jackknife test method was used for training and testing of the K-NN classifier. In this test method, one half of the images were used for training and the other half for testing. We examined this separation 200 times in order to verify the convergence of the classification results.
ROC Curves
The ROC curve was used for evaluation of the classification performance. The different points of the ROC curve were obtained by varying of the thresholds used. For each group of images to be classified, we used two thresholds to adjust the sensitivity of the classification system. Thus, in the case of the classification of the normal and abnormal images, the thresholds Tn and Ta were used. The Tn threshold is the minimum number of normal points among the K neighbors such that a given sample is classified as normal. Ta is the minimum number of abnormal points among the K neighbors such that a given sample is classified as abnormal. The thresholds Tbm and Tmm were used for the group of benign and malignant microcalcifications. For the group of benign and malignant masses, the thresholds Tbma and Tmma, respectively, were employed.
Results
Feature Selection
To facilitate the analysis of the separation results between the classes, the features were enumerated in the following way: (1) energy, (2) contrast, (3) difference moment, (4) correlation, (5) inverse difference moment, (6) entropy, (7) sum entropy, (8) difference entropy, (9) sum average, (10) sum variance, (11) difference average, (12) difference variance, (13) information measure of correlation (type I), (14) wavelet transform energy at level 2 in horizontal direction, (15) wavelet transform energy at level 2 in vertical direction, and (16) wavelet transform energy at level 2 in diagonal direction. The results of the selection of the best features for each group of images are presented below.
Normal and Abnormal ROIs
In this study, we selected several combinations of texture features that provided good discrimination between normal and abnormal regions. As shown in Figure 4, the JM distance value of 1.414 was obtained from the combination of four features. This indicates that, by using only four texture features, we can distinguish between suspicious regions of abnormality and normal regions.
Fig 4.
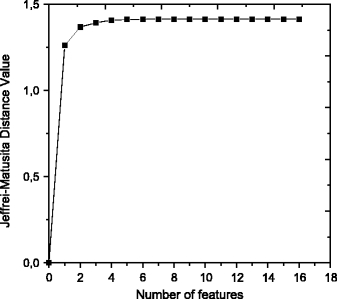
Jeffries–Matusita distance value for each number of features used in the case of classification between normal and abnormal regions.
ROIs with Microcalcifications and Masses
In the selection of features for the separation of regions with microcalcifications and regions with masses, we tested the combinations of up to 16 texture features, as shown in Figure 5. In this case, which was different from the result in the normal and abnormal regions, it was necessary to increase the number of features so that good discrimination between masses and microcalcifications could be achieved. From combinations of 8 features, a JM distance of 1.372 was obtained.
Fig 5.
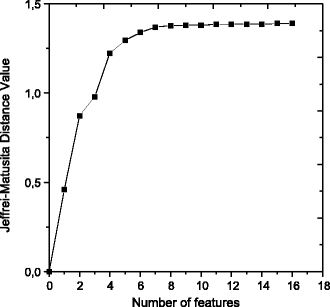
Jeffries–Matusita distance value for each number of features used in the case of classification between regions with masses and microcalcifications.
Malignant and Benign Lesions
The feature selection for classification of benign and malignant lesions showed that the texture features were not adequate for discrimination between benign and malignant lesions. For masses as well as for microcalcifications, the values of the JM distance were very low, indicating that the texture features would not be useful for the classification of these structures. The largest JM distance was 0.75 for lesions with masses and 0.69 for lesions with microcalcifications, both by use of 16 features.
Classification
Classification of Normal and Abnormal ROIs
The classification of 5518 ROIs, with normal regions (2700 ROIs) and regions with some abnormalities (2818 ROIs with microcalcifications and/or masses) were carried out by use of four selected texture features: three features of energy atlevel 2 of the wavelet transform in the vertical, horizontal, and diagonal directions and the extracted entropy of the co-occurrence matrix of gray levels. These features provided a JM distance of 1.41 that guarantees a good discrimination between normal and abnormal regions. The results of the classification provided a 99% sensitivity and a 65% specificity with the area under the ROC curve (AUC) = 0.973, as shown in Figure 6.
Fig 6.

ROC curve for classification between normal and abnormal regions.
Classification of ROIs with Microcalcifications and Masses
The classification of the ROIs with microcalcifications and masses was also carried out after the feature selection. However, the selection stage indicated that eight features would have to be used, in order to give good results, such as a sensitivity of 98% and a specificity of 44%, by use of features 1, 7, 8, 9, 10, 11, 12, and 13, with the AUC of 0.859, as shown in Figure 7.
Fig 7.
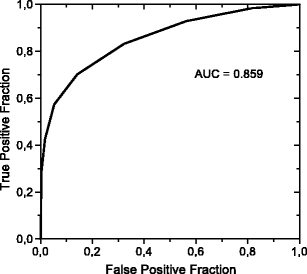
ROC curve for classification between masses and microcalcifications.
Classification of ROIs with Malignant and Benign Lesions
The classification of malignant and benign lesions did not give good results, as already indicated for the feature selection. Using all of the 16 texture features, we obtained a sensitivity of 98% and a specificity of 3% for microcalcifications, whereas a sensitivity of 99% with a specificity of 2% was obtained for masses. The area under the ROC curve for the classification between malignant and benign microcalcifications was 0.607 (Fig. 8), and for classification into malignant and benign masses was 0.617 (Fig. 9).
Fig 8.
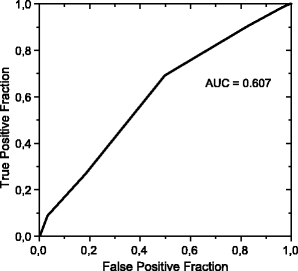
ROC curve for classification between benign and malignant microcalcifications.
Fig 9.
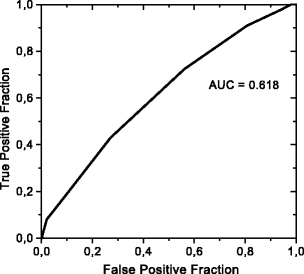
ROC curve for classification between benign and malignant masses.
Discussion and Conclusions
In this study, we investigated the potential usefulness of texture features for classification of different types of breast lesions and also for detection of breast lesions as presented in our previous work.20 The results showed the usefulness of texture analysis in the classification of mammographic lesions. We found that texture features were very efficient for classification of normal and abnormal images, for some types of lesions, and also for classification of masses and microcalcifications. However, the present texture features could not distinguish well between malignant and benign lesions for both masses and microcalcifications. These results were consistent with the results presented in the feature selection stage.
Acknowledgments
This work was supported by FAPESP—The State of São Paulo Foundation Research. We thank all researchers of the Kurt Rossmann Laboratories for Radiologic Image Research at the University of Chicago who contributed to this work, Mr. L. F. Oliveira for improving the algorithms, and Mrs. E. Lanzl for improving the manuscript.
References
- 1.Zuckerman HC. The role of mammogaphy in the diagnosis of breast cancer. In: Ariel IM, Cleary JB, editors. Breast Cancer: Diagnosis and Treatment. New York: McGraw-Hill; 1987. pp. 152–172. [Google Scholar]
- 2.Tabar L, Dean PB. The control of breast cancer through mammography screening. Radiol Clin North Am. 1987;25:961. [PubMed] [Google Scholar]
- 3.Thurfjell E, Lervenall K, Taube A. Benefit of independent double reading in a population-based mammography screening program. Radiology. 1994;191:241–244. doi: 10.1148/radiology.191.1.8134580. [DOI] [PubMed] [Google Scholar]
- 4.Birdwell R, Ikeda D, O'Shaughnessy K, Sickles E. Mammographic characteristics of 115 missed cancers later detected with screening mammography and the potential utility of computer-aided detection. Radiology. 2000;219:192–202. doi: 10.1148/radiology.219.1.r01ap16192. [DOI] [PubMed] [Google Scholar]
- 5.Kegelmeyer WP, Pruneda JM, Bourland PD, Hillis A, Riggs MW, Nipper ML. Computer aided mammographic screening for spiculated lesions. Radiology. 1994;191:331–337. doi: 10.1148/radiology.191.2.8153302. [DOI] [PubMed] [Google Scholar]
- 6.Petrick N, Chan HP, Wei D. An adaptive density-weighted contrast enhancement filter for mammographic breast mass detection. IEEE Trans Med Imag. 1996;15:59–67. doi: 10.1109/42.481441. [DOI] [PubMed] [Google Scholar]
- 7.Petrick N, Chan HP, Wei D, Sahiner B, Helvie MA, Adler DD: Automated detection of breast masses on mammograms using adaptive contrast enhancement and texture classification. Med Phys 23(10), 1996 [DOI] [PubMed]
- 8.Miller L, Ramsey N: The detection of malignant masses by non linear multiscale analysis. In: Doi K (ed). Digital Mammography, Proceedings of the 3rd International Workshop on Digital Mammography, Chicago, 1996, pp 335–340
- 9.Petrick N, Chan HP, Sahiner B, Helvie M. Combined adaptive enhancement and region growing segmentation of breast masses on digitized mammograms. Med Phys. 1999;26(8):1642–1654. doi: 10.1118/1.598658. [DOI] [PubMed] [Google Scholar]
- 10.Kim JK, Park HW. Statistical textural features for detection of microcalcifications in digitized mammograms. IEEE Trans Med Imag. 1999;18(3):231–238. doi: 10.1109/42.764896. [DOI] [PubMed] [Google Scholar]
- 11.Heath M, Bowyer K, Kopans D, Moore R, Kagelmeyer P: The digital database for screening mammography. In: Yaffe M (ed). 5th International Workshop on Digital Mammography, Toronto, Canada, 2000, pp 212–218
- 12.Breast Imaging Reporting and Data System (BI-RADS) 3rd edition. . Reston, VA: American College of Radiology (ACR); 1998. [Google Scholar]
- 13.Halarick RM, Shanmugam K, Dinstein I. Textural features for image classification. IEEE Trans Syst Man Cybern. 1973;3(6):610–621. [Google Scholar]
- 14.Chan HP, Wei D. Computer-aided classification of mammographic masses and normal tissue: Linear discriminant analysis in texture feature space. Phys Med Biol. 1997;40(5):857–876. doi: 10.1088/0031-9155/40/5/010. [DOI] [PubMed] [Google Scholar]
- 15.Chang T, Kuo CCJ. Texture analysis and classification with tree-structured wavelet/transform. IEEE Trans Image Process. 1993;2(4):429–441. doi: 10.1109/83.242353. [DOI] [PubMed] [Google Scholar]
- 16.Young TY, Calvert TW. Classification, Estimation and Pattern Recognition. New York: Elsevier; 1974. [Google Scholar]
- 17.Yoshida H, Doi K, Nishikawa RM. Automated detection of clustered microcalcifications in digital mammograms using wavelet transform techniques. Proc SPIE. 1994;2167:868–886. doi: 10.1117/12.175126. [DOI] [Google Scholar]
- 18.Yoshida H, Doi K, Nishikawa RM, Giger ML, Schmidt RA. An improved computer assisted diagnostic scheme using wavelet transform for detecting clustered microcalcifications in digital mammograms. Acad Radiol. 1996;3:621–627. doi: 10.1016/S1076-6332(96)80186-3. [DOI] [PubMed] [Google Scholar]
- 19.Duda RO, Hart PE. Pattern Classification and Scene Analysis. New York: John Wiley and Sons; 1973. [Google Scholar]
- 20.Pereira RR Jr, Honda MO, Rodrigues JAH, Azevedo-Marques PM: Detection of nonpalpable breast lesions using texture features. In: Etta Pisano (ed). 7th International Workshop on Digital Mammography, Durham, NC, 2004


