Abstract
Fractal analysis has been shown to be useful in image processing for characterizing shape and gray-scale complexity. Breast masses present shape and gray-scale characteristics that vary between benign masses and malignant tumors in mammograms. Limited studies have been conducted on the application of fractal analysis specifically for classifying breast masses based on shape. The fractal dimension of the contour of a mass may be computed either directly from the 2-dimensional (2D) contour or from a 1-dimensional (1D) signature derived from the contour. We present a study of four methods to compute the fractal dimension of the contours of breast masses, including the ruler method and the box counting method applied to 1D and 2D representations of the contours. The methods were applied to a data set of 111 contours of breast masses. Receiver operating characteristics (ROC) analysis was performed to assess and compare the performance of fractal dimension and four previously developed shape factors in the classification of breast masses as benign or malignant. Fractal dimension was observed to complement the other shape factors, in particular fractional concavity, in the representation of the complexity of the contours. The combination of fractal dimension with fractional concavity yielded the highest area (Az) under the ROC curve of 0.93; the two measures, on their own, resulted in Az values of 0.89 and 0.88, respectively.
Key Words: Box counting method, breast cancer, breast masses, breast tumors, contour analysis, fractal analysis, fractal dimension, ruler method, shape analysis, signatures of contours
Introduction: Breast Masses and Fractals
Mammography is the best method available for early detection of breast cancer. Large populations of asymptomatic women are participating in regular mammographic screening programs.1 With the aim of improving the accuracy and efficiency of screening programs for the detection of early signs of breast cancer, a number of research projects are focusing on developing methods for computer-aided diagnosis (CAD) to assist radiologists in diagnosing breast cancer.2 A key requirement in reducing the mortality rate due to breast cancer is to identify and remove malignant tumors at an early stage before they metastasize and spread to neighboring regions.
Evidence of a breast tumor is usually indicated by the presence of a dense mass and/or a change in the texture or distortion in the mammogram. Consequently, the focus during diagnosis is on identifying such abnormal regions, as well as on classifying the type of mass or tumor that caused the abnormality. A typical benign mass is round and smooth with a well-defined (well-circumscribed) boundary, whereas a typical malignant tumor is spiculated and rough with a blurry boundary.3,4 There could also be some unusual cases of macrolobulated or slightly spiculated benign (SB) masses, as well as nearly round, microlobulated, or well-circumscribed malignant (CM) tumors; such atypical cases cause difficulties in pattern classification studies.5,6
On the basis of the notable shape differences between benign masses and malignant tumors, shape features such as compactness (C), fractional concavity (Fcc), spiculation index (SI), and a Fourier-descriptor-based factor (FF) have been proposed for their classification.5,6 Subtle textural differences have also been observed between benign masses and malignant tumors, with the former being mostly homogeneous and the latter showing heterogeneous texture. Several studies have proposed measures of texture and edge sharpness to discriminate between benign masses and malignant tumors.5,7–10 Sahiner et al8 and Alto et al10 explored several combinations of morphological and texture measures to classify breast masses.
The notion of fractal analysis11–17 is useful in studying the complexity of 1-dimensional (1D) functions, 2-dimensional (2D) contours, as well as gray-scale images. A few studies have examined the application of fractals to classify breast masses based on the irregularity exhibited in their contours. A study by Matsubara et al18 reported 100% accuracy in the classification of 13 benign masses and malignant tumors using fractal dimension (FD). The method employed by Matsubara et al18 involved the computation of a series of FD values for several contours of a given mass obtained by thresholding the mass at many levels; the change in FD of the given mass was used to categorize the mass as benign or malignant. A study by Pohlman et al19 obtained greater than 80% classification accuracy with fractal analysis of signatures of contours of breast masses. However, the signature of a contour was derived as a function of the radial distance from the centroid to the contour vs. the angle of the radial line over the range [0°, 360°], which could lead to a multivalued function in the case of an irregular or spiculated contour; the signature computed in this manner would also have ranges of undefined values in the case of a contour for which the centroid falls outside the region enclosed by the contour. Dey and Mohanty20 employed fractal geometry to study breast lesions on cytology smears and found that FD may be useful in discriminating between benign and malignant cells
Fractal analysis can also be used to characterize the complexity of gray-scale associated with texture. Zheng and Chan21 used fractals in a preprocessing step to select abnormal regions in mammograms. Guo et al22 computed the fractal dimension to characterize the complexity of regions of interest (ROIs) in mammograms, and used a support vector machine for the detection of abnormal regions related to breast masses. Caldwell et al23 and Byng et al24 computed FD of breast tumors by applying a modified box counting method that represents gray-scale values of the surfaces of the tumors as boxes of variable height. Such a fractal measure can be used to represent the complexity of density variations and texture in breast tissue. Byng et al24 showed that a gray-scale-based fractal measure may be used to complement histogram skewness to relate breast density to the risk of development of breast cancer. Other works have reported on the use of FD as a feature for the classification of tumors in magnetic resonance (MR) images of the brain,25 ultrasonic images of the liver,26 and images related to colonic cancer.27
In other biomedical applications of fractal analysis, Lee et al28 compared several shape factors, including FD, in a study on the irregularity of the borders of melanocytic lesions. Kikuchi et al29 investigated the change in FD at different stages of ovarian tumor growth. Nam and Choi30 computed the FD of regions in mammograms by using the box counting method, and found that regions with higher FD indicated the presence of calcification.
The aim of the present study is to employ fractal analysis for the classification of breast masses by using only their contours.31–33 Even though fractal analysis has been widely used in the analysis of biomedical images, only a few studies have specifically applied the method to study and classify mammographic masses (as reviewed above). FD may be used as a quantitative measure of the complexity of the contour or boundary of an object. Benign masses and malignant tumors differ significantly in shape complexity, and therefore, it should be possible to differentiate between them by using FD. In the present work, we obtain estimates of FD from 1D signatures of contours of breast masses as well as the contours in their usual 2D forms, by using the ruler method and the box counting method. The concept of fractals, the derivation of FD, the representation of 2D contours by their 1D signatures, the computational methods employed, and the results obtained are described in the following sections.
Fractal Analysis
A fractal is a function or pattern that possesses self-similarity at all (or several) scales or levels of magnification.11–17 This means that fractals are irregular geometric objects with infinite nesting of structure at all scales. The Koch curve, the Cantor bar, and the Sierpinski triangle are three commonly recognized fractals13; these patterns can be generated by repeating a basic pattern in a recursive or iterative process. Fractals may also be described in terms of their space-filling nature (for example, the Peano–Hilbert curve12,34). However, a combination of simple shapes cannot describe the true nature of a fractal image. Consider the example of the leaf of a fern, which exhibits fractal characteristics; it is clearly inadequate to describe the shape of such a leaf as being composed of triangular or oval sections. To facilitate the objective or quantitative analysis of the shape of an object, a measure known as the fractal dimension can be used to characterize self-similarity, nested complexity, or space-filling properties; the measure may be extended to characterize the complexity of a pattern in general.
Cancerous tumors exhibit a certain degree of randomness associated with their growth, and are typically irregular and complex in shape; therefore, fractal analysis can provide a better measure of their complex patterns than conventional Euclidean geometry. Gazit et al35 showed that the vascular architecture of tumors during growth displays fractal characteristics that significantly differ from those of normal vascular networks of healthy tissues. It was observed that the FD of the vascular architecture of growing tumors is significantly less than that of normal vascular architecture, with the latter demonstrating a clear space-filling nature. It was also observed that, during tumor regression, the FD values of the vasculature are in between those of growing tumors and healthy tissues. It is not known if a direct relationship exists between the internal vascular architecture and the external shape or border characteristics of a tumor. Regardless, we surmise that the complex and rough patterns of the contours of malignant tumors can be characterized by FD, and that they may be expected to have higher FD values than the relatively smooth contours of benign masses.
The self-similarity dimension D is defined as follows.12 Consider a self-similar pattern that exhibits a number of self-similar pieces at the reduction factor 1/s (the latter is related to the measurement scale). The power law expected to be satisfied is
 |
1 |
Then, we have
 |
2 |
Therefore, the slope (of the straight-line approximation) of a plot of log(a) vs. log(1/s) can provide an estimate of D. Due to practical limitations, it is important to limit the range of the reduction factor or measurement scale to a viable range.12,36
Several methods for estimating FD have been described in the literature. The most commonly used method is the box counting method.12,36–39 The box counting method consists of partitioning the pattern or image space into square boxes of equal size, and counting the number of boxes that contain a part (at least one pixel) of the image. The process is repeated with partitioning of the image space into smaller and smaller squares. The log of the number of boxes counted is plotted against the log of the magnification index for each stage of partitioning, yielding a set of points on a line. The slope of the best-fitting straight line to the plot as above gives the FD of the pattern.
Another popular method for calculating FD is the ruler method (also known as the compass or divider method).12 With different lengths of rulers, the total length of a contour or pattern can be estimated to different levels of accuracy. When using a large ruler, the small details in a given contour would be skipped, whereas when using a small ruler, the finer details would get measured. The estimate of the length improves as the size of the ruler decreases. Similar to the box counting method, FD is obtained from the linear slope of a plot of the log of the measured length vs. the log of the measuring unit.
The formulation of the ruler method is as follows. Let u be the length measured with the compass setting or ruler size s. The value 1/s is used to represent the precision of measurement. The power law expected to be satisfied in this case is
 |
3 |
where c is a constant of proportionality, and the power d is related to the fractal dimension D as 12
 |
4 |
Applying the log transformation to Eq. 3, we obtain
 |
5 |
Thus, the slope (of the straight-line approximation) of a plot of log(u) vs. log(1/s) can provide an estimate of FD as D = 1 + d.
If we were to denote u = ns, where n is the number of times the ruler is used to measure the length u with the ruler of size s, we get
 |
6 |
Then, the slope (of the straight-line approximation) of a plot of log(n) vs. log(1/s) provides an estimate of D directly.
The self-similarity dimension, the box counting dimension, and the ruler dimension are all considered to be special forms of Mandelbrot's fractal dimension.11,12
Experiments with Contours and Signatures of Breast Masses
Data sets of Contours of Breast Masses
Three data sets of contours of breast masses were used in this study. The first data set was obtained from Screen Test: the Alberta Program for the Early Detection of Breast Cancer.1,10,40 Approval was obtained from the Conjoint Health Research Ethics Board, Office of Medical Bioethics, University of Calgary and Calgary Health Region, as well as from the Alberta Cancer Board. The mammograms in this data set are from 20 cases. The mammograms were digitized using the Lumiscan 85 scanner at a resolution of 50 μm with 12 bits/pixel. The data set includes 57 ROIs, 37 of which are related to benign masses and 20 are related to malignant tumors.10 The sizes of the benign masses vary in the range 39–423 mm2, with an average of 163 mm2 and a standard deviation of 87 mm2. The sizes of the malignant tumors vary in the range 34–1,122 mm2, with an average of 265 mm2 and a standard deviation of 283 mm2. The diagnostic classification of the masses was based upon biopsy. The contour of each mass was manually drawn by an expert radiologist specialized in mammography and verified independently by another radiologist. Most of the benign masses in this data set are well-circumscribed (circumscribed benign or CB), whereas most of the malignant tumors are spiculated (spiculated malignant or SM), as typically encountered in mammographic images.
The second data set was obtained by using images containing masses from the Mammographic Image Analysis Society (MIAS, UK) database41,42 and the teaching library of the Foothills Hospital in Calgary.5,6 The MIAS images were digitized at a resolution of 50 μm, whereas the Foothills Hospital images were digitized at a resolution of 62 μm. The diagnostic classification of the masses was based on biopsy. The contour of each mass was manually drawn by an expert radiologist specialized in mammography. This data set includes circumscribed and spiculated cases in both the benign and malignant categories. SB masses and CM tumors are unusual, and tend to cause difficulties in pattern classification studies.5,6 The second data set has a total of 54 contours, including 16 CB, 12 SB, 19 SM, and 7 CM types. The sizes of the benign masses vary in the range 32–1,207 mm2, with an average of 281 mm2 and a standard deviation of 288 mm2. The sizes of the malignant tumors vary in the range 46–1,244 mm2, with an average of 286 mm2 and a standard deviation of 292 mm2.
The third (combined) data set was prepared by combining all cases in the first and the second data sets. The combined set has 111 contours, including both typical and atypical shapes of benign masses (65) and malignant tumors (46). The sizes of the benign masses vary in the range 32–1,207 mm2, with an average of 214 mm2 and a standard deviation of 206 mm2. The sizes of the malignant tumors vary in the range 34–1,244 mm2, with an average of 277 mm2 and a standard deviation of 285 mm2. The results obtained are presented for the three data sets (first and second data sets separately and combined) in order to analyze and demonstrate the strengths and weaknesses of the features used in characterizing breast masses and tumors of various types.
Fractal Analysis of Contours and Signatures of Masses
The ruler method was chosen for its simplicity and efficiency; however, none of the works reported in the literature has used this method to compute the FD of breast tumors. The ruler method, as well as the more popular box counting method, described in the preceding section, can be directly applied to a 1D signature or to a 2D contour.
The 2D contours were transformed into 1D signatures, defined as the radial distance from each contour point to the centroid of the contour as a function of the index of the contour point. A benign mass is generally round in shape, being well circumscribed or macrolobulated, and would have a smooth signature, as shown in Figure 1. On the other hand, a malignant tumor is usually rough in shape, being spiculated or microlobulated, and therefore, would have a rough and complex signature, as shown in Figure 2.
Fig 1.
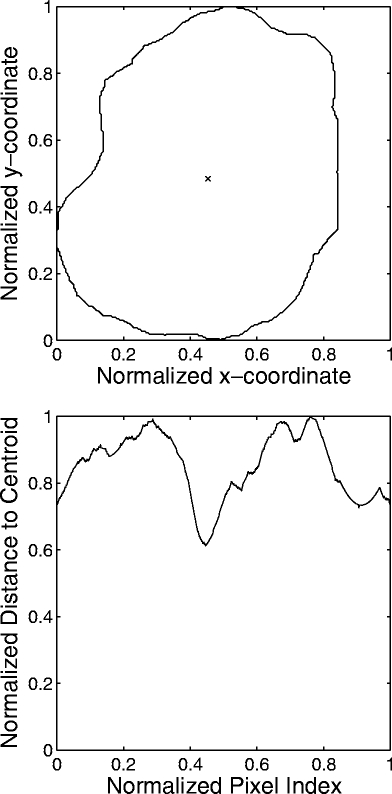
Example of the contour of a benign breast mass and the corresponding signature. The × mark indicates the centroid of the contour. The contour and signature have been normalized. FD = 1.16 by the 1D ruler method. FD = 1.02 by the 2D ruler method.
Fig 2.
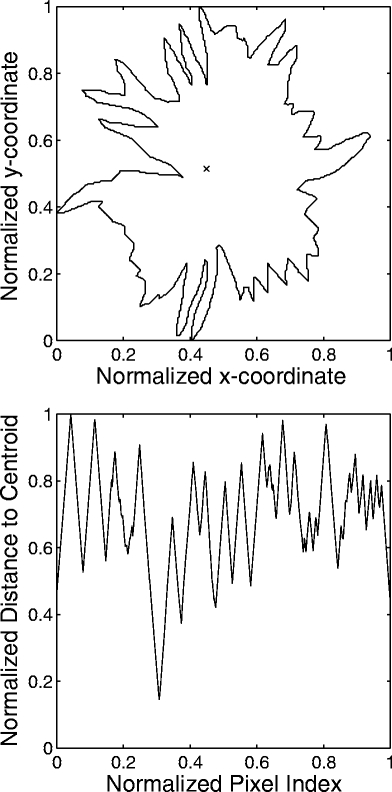
Example of the contour of a malignant breast tumor and the corresponding signature. The × mark indicates the centroid of the contour. The contour and signature have been normalized. FD = 1.42 by the 1D ruler method. FD = 1.45 by the 2D ruler method.
Each 2D contour was normalized as follows: the wider axis (horizontal or vertical) of the contour was determined and all the values along that axis were normalized to the range [0, 1]; next, the values along the other axis were normalized based on the length of the wider axis. This method of normalization preserves the ratio of the width to the height of the contours in the data set. The 1D signatures were normalized to the range [0, 1] along both axes. With normalization as described above, the FD values of the 111 contours in our combined data set, which differ widely in true size, can be computed by the ruler method without having to change the range of the ruler size for each contour.
Coelho et al36 reported on the need to determine carefully the approximate linear region of the log–log curve in which the slope is to be computed to obtain the correct value of FD. The log–log curve (log of the number of self-similar pieces vs. the log of the magnification factor) was observed to exhibit two distinct regions: one where FD was incorrectly represented because the magnification factor was too small, and the other a linear region where FD was correctly represented. The ruler size in the ruler method is analogous to the box partitioning size in the box counting method; it is important to determine a suitable range of the ruler size to estimate FD accurately.12 This step also accommodates limitations in the fractal characteristics of a given pattern due to image size and sampling considerations.
Two simulated test patterns of known FD, the 2D Koch curve43 (FD = 1.2618) and the 1D test pattern defined by Dubuc et al37 (FD = 1.5), were used to validate the programs developed to estimate FD. The 2D Koch curve and the 1D test pattern were normalized in the same manner as the 2D contours and the 1D signatures, respectively. The range of the box length that yielded the most accurate estimate of the FD of the Koch curve was determined to be [1/4, 1/8, 1/16, 1/32, 1/64, 1/128] as a fraction of the size of the original curve. For the ruler method, by using the 1D test pattern, the most appropriate range of the normalized ruler size was determined to be [0.050, 0.075, 0.1, ..., 0.2], as a fraction of the size of the original pattern. Note that, although the test curves are ideally expected to demonstrate fractal characteristics at all scales, practical limitations in their representation and analysis using finite data sets lead to limitations as described above.
Shape Factors
To perform a comparative analysis of FD as a feature for pattern classification of breast masses, four previously proposed shape factors (specifically for the analysis of breast masses in mammograms) were computed from the contours. The four shape factors are briefly described below.
Compactness (C) is a measure of how efficiently a contour encloses a given area. A normalized measure of compactness is given by44
 |
7 |
where P and A are the contour perimeter and area enclosed, respectively. A high compactness value indicates a large perimeter enclosing a small area. Therefore, typical benign masses would have lower values of compactness compared to typical malignant tumors.5,6,10
Spiculation index (SI) is a measure derived by combining the ratio of the length to the base width of each possible spicule in the contour of the given mass.6 Let Sn and θn, n = 1, 2, ..., N, be the length and angle of N sets of polygonal model segments corresponding to the N spicule candidates of a mass contour. Then, SI is computed as
 |
8 |
The factor (1 + cos θn) modulates the length of each segment (possible spicule) according to its narrowness. Spicules with narrow angles between 0° and 30° get high weighting, as compared to macrolobulations that usually form obtuse angles, and hence get low weighting. The degree of narrowness of the spicules is an important characteristic in differentiating between benign masses and malignant tumors. Benign masses are usually smooth or macrolobulated, and thus have lower values of SI as compared to malignant tumors, which are typically microlobulated or spiculated.6,10
Fractional concavity (Fcc) is a measure of the portion of the indented length to the total contour length; it is computed by taking the cumulative length of the concave segments and dividing it by the total length of the contour.6 Benign masses have fewer, if any, concave segments than malignant tumors; thus, benign masses would have lower Fcc values than malignant tumors.6,10
Fourier factor (FF) is a measure related to the presence of roughness or high-frequency components in the contours.44,45 The measure is derived by taking the sum of the normalized Fourier descriptors of the coordinates of the contour pixels divided by the corresponding indices, dividing it by the sum of the normalized Fourier descriptors, and subtracting the result from unity, as follows 44:
 |
9 |
Here, Z0(k) are the normalized Fourier descriptors, defined as
 |
The Fourier descriptors themselves are defined as
 |
10 |
k = −N/2, ..., −1, 0, 1, 2, ..., N/2 − 1, where z(n) = x(n) + jy(n), n = 0, 1, ..., N − 1 represents the sequence of contour pixel coordinates. The advantage of FF is that it is limited to the range [0, 1], and is not sensitive to noise, which would not be the case if weights increasing with frequency were used. The shape factor FF is invariant to translation, rotation, starting point, and contour size, and increases in value as the object shape becomes more complex and rough. Contours of malignant tumors are expected to be more rough, in general, than the contours of benign masses; hence, the FF value is expected to be higher for the former than the latter.5,6,8
Results and Discussion
Rank-Ordering of Contours of Breast Masses by Fractal Dimension
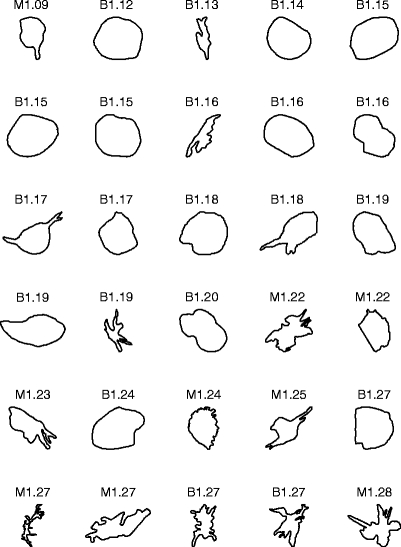
Figure 3 shows the contours of the 57 masses in the first data set, ranked in the order of increasing FD obtained by the 1D ruler method. Malignant tumors generally have higher FD because they are more ragged and spiculated than benign masses. The average FD of the 37 benign masses is 1.13 ± 0.05 (mean ± standard deviation). The average FD of the 20 malignant tumors is 1.41 ± 0.15.
Fig 3.
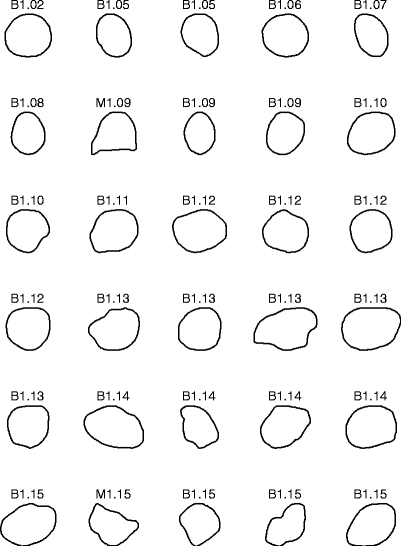
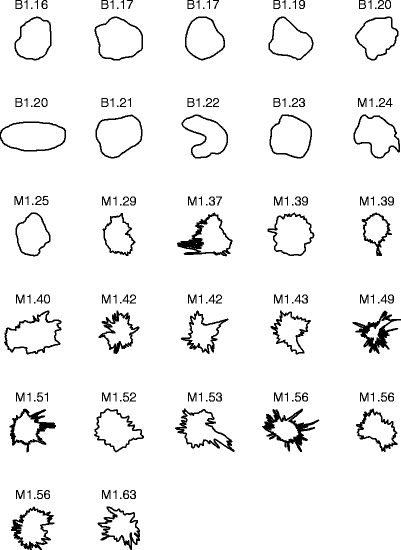
Contours of 37 benign masses and 20 malignant tumors in the first data set, ranked by their FD estimated by the 1D ruler method. The contours are of widely differing size, but have been scaled to the same bounding box in the plots. B: benign; M: malignant.
Figure 4 shows the contours of the 54 masses in the second data set, ranked in the order of increasing FD obtained by the 1D ruler method. The average FD of the 28 benign masses is 1.22 ± 0.09. The average FD of the 26 malignant tumors is 1.35 ± 0.11.
Fig 4.
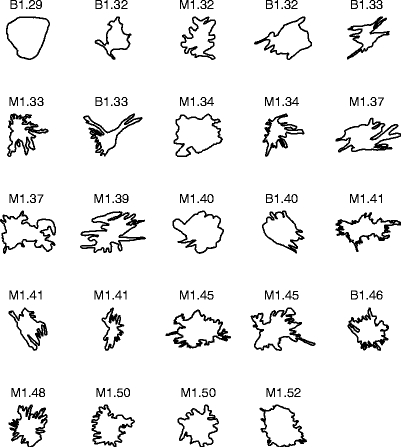
Contours of 28 benign masses and 26 malignant tumors in the second data set, ranked by their FD estimated by the 1D ruler method. The contours are of widely differing size, but have been scaled to the same bounding box in the plots. B: benign; M: malignant.
Pattern Classification Experiments
Several feature vectors were formed by using various combinations of the shape factors described above and FD. The conditional probability density functions of the feature vectors, assumed to be Gaussian, were estimated for the two classes of benign masses and malignant tumors. Using Bayes formula, a discriminant function was composed. The leave-one-out method was used in estimating the classification accuracy. A sliding threshold was applied to classify the feature vectors, and the sensitivity [ie, the true-positive fraction (TPF)] and the specificity [ie, the true-negative fraction (TNF) = 1 − FPF, where FPF is the false-positive fraction] were derived. Receiver operating characteristics (ROC) curves were generated as plots of sensitivity vs. FPF.46 The area Az under each ROC curve was computed to serve as a measure of the classification performance of the corresponding feature vector. The pattern classification procedures were applied to the first data set, the second data set, and the combined data set for various combinations of the shape factors.
Across the first, second, and combined data sets, no single method for estimating FD (among the 2D ruler, 2D box counting, 1D ruler, and 1D box counting methods) emerged as the consistently best-performing method, although each method gave good results with Az in the range (0.75, 0.94). Considering the combined data set, the values of Az for the four methods were as follows: 2D ruler, 0.88; 2D box counting, 0.84; 1D ruler, 0.89; 1D box counting, 0.88. Table 1 lists all Az values for the various tests conducted with the different methods for estimating FD and the various data sets. Figure 5 shows the ROC curves indicating the classification performance of FD obtained using the 1D ruler method with the first, second, and combined data sets. The results of further pattern classification studies, as described below, were obtained by using the FD values estimated with the 1D ruler method.
Table 1.
Comparison of the box-counting and ruler methods applied to 2D contours and 1D signatures of breast masses to obtain the fractal dimension, in terms of the area Az under the ROC curve
| Method | Data Set 1 | Data Set 2 | Combined |
|---|---|---|---|
| 1D ruler | 0.91 | 0.80 | 0.89 |
| 2D ruler | 0.94 | 0.81 | 0.88 |
| 1D box counting | 0.89 | 0.80 | 0.88 |
| 2D box counting | 0.90 | 0.75 | 0.84 |
Fig 5.
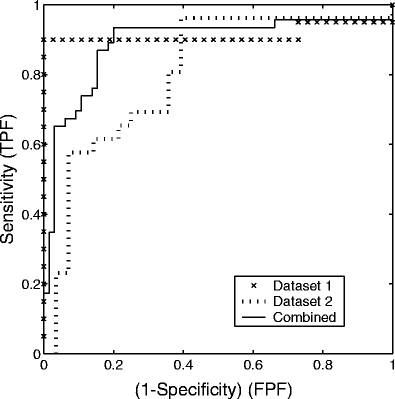
ROC curves indicating the classification performance of FD obtained by using the 1D ruler method with the first (×), second (dotted line), and combined (solid line) data sets. The area Az under the ROC curves are 0.91, 0.80, and 0.89, respectively. TPF: true-positive fraction; FPF: false-positive fraction.
In general, the use of multiple shape features led to more accurate pattern classification, as indicated by higher Az values, than the use of a single shape feature. By combining different shape features, the weaknesses of one shape feature were observed to be compensated by the strengths of the other shape features.
First Data Set
Considering the use of a single shape feature, Fcc achieved the highest classification accuracy with Az = 0.99. The other four shape features (C, SI, FF, and FD) also achieved high Az values in the range of 0.91–0.98. Recall that the first data set contains mostly typical benign masses and malignant tumors, which do not generally cause difficulties in pattern classification studies. The results indicate that all of the five shape features used in the present study can accurately differentiate between typical benign masses and malignant tumors. The use of combinations of multiple shape factors did not lead to any higher accuracy than that with Fcc alone. This indicates that Fcc is an effective shape feature for classification of typical benign masses and malignant tumors.
Second Data Set
The Az values in all experiments conducted with single-feature and multiple-feature classification were lower for the second data set, as compared to those with the first data set. Recall that the second data set contains unusually large numbers of atypical masses and tumors. In the case of single-feature classification, FD achieved the highest Az of 0.80, indicating that it is, on the average, better at classifying atypical cases such as SB masses and CM tumors than the other shape factors tested. The features SI and Fcc provided a lower Az value of 0.77. When FD was combined with the other shape features, higher Az values were obtained as follows: 0.82 with [FD, Fcc] or [FD, SI]; 0.81 with [C, FD, Fcc]; and 0.80 with [FD, SI, Fcc] or [FD, C]. Other combinations of the features provided lower values of Az.
Combined Data Set
The combined data set gives a good representation of the combinations of common and atypical breast mass contours that are encountered in a clinical setting. In single-feature classification, SI provided the highest Az of 0.90, followed by FD (0.89), Fcc (0.88), and C (0.87). However, in multiple-feature classification, the combination [FD, Fcc] yielded the highest Az of 0.93. Other feature combinations that yielded high Az values were as follows: [FD, Fcc, SI] (0.92); [SI, Fcc] (0.92); [FD, FF, SI, Fcc, C] (0.92).
Figure 6 shows ROC plots representing the classification of masses with FD obtained by the 1D ruler method, Fcc, and the two features combined, by using the combined data set. Table 2 lists the Az values for several combinations of the features tested. The combination of FD and Fcc consistently yielded the highest accuracy across both data sets and the combined data set. The results indicate that FD can complement Fcc in the classification of atypical masses and tumors based upon their contours.
Fig 6.
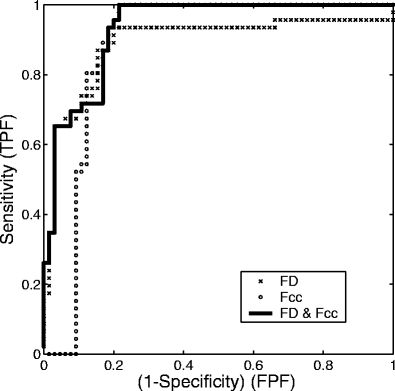
ROC curves representing the classification performance of FD obtained with the 1D ruler method (×), Fcc (○), and their combination (solid line) with the combined data set. The areas under the three curves are, in order, 0.89, 0.88, and 0.93.
Table 2.
Comparison of the area Az under the ROC curve for various combinations of shape factors and FD obtained using the 1D ruler method
| Features | Data Set 1 | Data Set 2 | Combined |
|---|---|---|---|
| FD, Fcc | 0.99 | 0.82 | 0.93 |
| FD, SI, Fcc | 0.99 | 0.80 | 0.92 |
| SI, Fcc | 0.99 | 0.77 | 0.92 |
| FD, SI | 0.97 | 0.82 | 0.91 |
| SI | 0.93 | 0.77 | 0.90 |
| FD | 0.91 | 0.80 | 0.89 |
| Fcc | 0.99 | 0.77 | 0.88 |
| C | 0.97 | 0.72 | 0.87 |
| FF | 0.98 | 0.65 | 0.77 |
ROC: receiver operating characteristics; FD: fractal dimension; Fcc: fractional concavity; SI: spiculation index; C: compactness; FF: Fourier factor.
To analyze the strengths and weaknesses of each shape feature, a sample classification experiment was carried out by using the combined data set. The prior probabilities of the benign and malignant classes estimated for the combined data set (with 111 contours, 65 of which are related to benign masses and 46 of which are related to malignant tumors) were used to obtain the threshold to classify the masses. All of the shape features, except for FF, were able to classify the typical CB masses and SM tumors accurately. However, most of the shape features were unable to correctly classify the atypical cases of SB masses and CM tumors. The best fraction of correctly classified CM tumors was achieved with FF, but FF was poor in classifying the CB masses and the SM tumors. Therefore, FF, when combined with other features, did not improve the classification accuracy. The next highest fraction of correctly classified CM tumors was achieved by Fcc. The best fraction of correctly classified SB masses was achieved by FD. Both Fcc and FD were reasonably accurate in classifying the CB masses and SM tumors. Fcc was weak in classifying the SB masses, but effective in classifying the CM tumors. On the other hand, FD was weak in classifying the CM tumors, but was the best feature in classifying the SB masses. This indicates that FD and Fcc can compensate for each other's weaknesses. The combination of Fcc and FD provided the highest Az of 0.93 with the combined data set.
A limitation of the present study is that the contours used were drawn by hand on mammograms (by an expert radiologist specialized in mammography). The methods need to be tested with contours automatically obtained by image processing methods for the detection and delineation of masses in mammograms.8,9 It is worth noting that, in a study by Sahiner et al,8 in which the classification performance of several shape factors and texture measures was compared with a data set of automatically extracted regions corresponding to 122 benign breast masses and 127 malignant tumors, FF was found to give the best individual performance with Az = 0.82. This result not only indicates the importance of shape in the analysis of breast masses, but also that shape factors computed from automatically extracted contours can yield good results in discriminating between benign masses and malignant tumors. It would also be desirable to test the methods with contours of masses drawn by several radiologists in order to assess the effects of interobserver variability; this, however, is beyond the scope of the present study.
Conclusion
We have presented the results of an investigation into the use of fractal analysis for the classification of breast masses. The experimental results show a significant difference in fractal dimension between malignant tumors and benign masses. With a data set comprising 111 contours of a combination of typical and atypical masses and tumors, FD showed an accuracy comparable to that of other shape features such as fractional concavity and spiculation index. Furthermore, FD was able to classify atypical SB masses more accurately than the other shape features; however, it was less accurate in the classification of CM tumors. When FD was combined with other shape features, the classification accuracy was improved. Our results indicate that FD can serve as a useful feature, by itself or in conjunction with other shape features, in the classification of breast masses and the diagnosis of breast cancer.
Fractal analysis may also be applied to other types of signatures of contours. Pohlman et al19 defined signatures of contours of breast masses as the radial distance to the contour from the centroid as a function of the angle of the radial line over the range [0°, 360°]. A comparative analysis of FD computed by using different types of signatures of the same set of contours would be desirable.
The concept of fractals can be used to characterize not only the complexity of the shapes of contours of breast masses and tumors, but also their complexity associated with gray-scale texture, heterogeneity, and edge sharpness. Combinations of shape factors and texture measures have been shown to be more effective in the classification of breast masses8,10 than either type of features on its own. Previous studies7 on statistical measures of texture as proposed by Haralick et al47 have shown that such measures are sensitive to differences in the nature of images across databases. However, FD is normalized across multiple scales for each image, and may be expected to be not sensitive to differences as described above. For this reason, we will conduct a comparative study on gray-level-based FD vs. statistical measures of the texture of breast masses and tumors. The methods should lead to improved analysis and classification of breast masses and tumors.
Acknowledgments
This work was supported by grants from the Natural Sciences and Engineering Research Council of Canada and the Alberta Heritage Foundation for Medical Research.
References
- 1.Alberta Cancer Board, Alberta, Canada, http://www.cancerboard.ab.ca/screentest. Screen Test: Alberta Program for the Early Detection of Breast Cancer—2001/03 Biennial Report, 2004
- 2.Peitgen HO, (ed.) Proceedings of the 6th International Workshop on Digital Mammography, Bremen, Germany, June 2002. Springer-Verlag
- 3.Homer MJ. Mammographic Interpretation: A Practical Approach. 2. Boston, MA: McGraw-Hill; 1997. [Google Scholar]
- 4.American College of Radiology, Reston, VA. Illustrated Breast Imaging Reporting and Data System (BI-RADS™), 3rd ed., 1998
- 5.Rangayyan RM, El-Faramawy NM, Desautels JEL, Alim OA. Measures of acutance and shape for classification of breast tumors. IEEE Trans Med Imag. 1997;16(6):799–810. doi: 10.1109/42.650876. [DOI] [PubMed] [Google Scholar]
- 6.Rangayyan RM, Mudigonda NR, Desautels JEL. Boundary modelling and shape analysis methods for classification of mammographic masses. Med Biol Eng Comput. 2000;38:487–496. doi: 10.1007/BF02345742. [DOI] [PubMed] [Google Scholar]
- 7.Mudigonda NR, Rangayyan RM, Desautels JEL. Gradient and texture analysis for the classification of mammographic masses. IEEE Trans Med Imag. 2000;19(10):1032–1043. doi: 10.1109/42.887618. [DOI] [PubMed] [Google Scholar]
- 8.Sahiner BS, Chan HP, Petrick N, Helvie MA, Hadjiiski LM. Improvement of mammographic mass characterization using spiculation measures and morphological features. Med Phys. 2001;28(7):1455–1465. doi: 10.1118/1.1381548. [DOI] [PubMed] [Google Scholar]
- 9.Mudigonda NR, Rangayyan RM, Desautels JEL. Detection of breast masses in mammograms by density slicing and texture flow-field analysis. IEEE Trans Med Imag. 2001;20(12):1215–1227. doi: 10.1109/42.974917. [DOI] [PubMed] [Google Scholar]
- 10.Alto H, Rangayyan RM, Desautels JEL.Content-based retrieval and analysis of mammographic masses J Electron Imaging 20051421–17. 10.1117/1.190299617235365 [DOI] [Google Scholar]
- 11.Mandelbrot BB. The Fractal Geometry of Nature. San Francisco, CA: WH Freeman; 1983. [Google Scholar]
- 12.Peitgen HO, Jurgens H, Saupe D. Chaos and Fractals: New Frontiers of Science. New York, NY: Springer; 2004. [Google Scholar]
- 13.Liu SH. Formation and anomalous properties of fractals. IEEE Eng Med Biol Mag. 1992;11(2):28–39. doi: 10.1109/51.139034. [DOI] [Google Scholar]
- 14.Deering W, West BJ. Fractal physiology. IEEE Eng Med Biol Mag. 1992;11(2):40–46. doi: 10.1109/51.139035. [DOI] [Google Scholar]
- 15.Schepers HE, Beek JHGM, Bassingthwaighte JB. Four methods to estimate the fractal dimension from self-affine signals. IEEE Eng Med Biol Mag. 1992;11(2):57–64. doi: 10.1109/51.139038. [DOI] [PMC free article] [PubMed] [Google Scholar]
- 16.Fortin C, Kumaresan R, Ohley W, Hoefer S. Fractal dimension in the analysis of medical images. IEEE Eng Med Biol Mag. 1992;11(2):65–71. doi: 10.1109/51.139039. [DOI] [Google Scholar]
- 17.Goldberger AL, Rigney DR, West BJ. Chaos and fractals in human physiology. Sci Am. 1990;262:42–49. doi: 10.1038/scientificamerican0290-42. [DOI] [PubMed] [Google Scholar]
- 18.Matsubara T, Fujita H, Kasai S, Goto M, Tani Y, Hara T, and Endo T. Development of new schemes for detection and analysis of mammographic masses. In Proceedings of the 1997 IASTED International Conference on Intelligent Information Systems (IIS'97), pp 63–66, Grand Bahama Island, Bahamas, December 1997
- 19.Pohlman S, Powell KA, Obuchowski NA, Chilcote WA, Grundfest-Broniatowski S. Quantitative classification of breast tumors in digitized mammograms. Med Phys. 1996;23(8):1337–1345. doi: 10.1118/1.597707. [DOI] [PubMed] [Google Scholar]
- 20.Dey P, Mohanty SK. Fractal dimensions of breast lesions on cytology smears. Diagn Cytopathol. 2003;29(2):85–86. doi: 10.1002/dc.10324. [DOI] [PubMed] [Google Scholar]
- 21.Zheng L, Chan AK. An artificial intelligent algorithm for tumor detection in screening mammogram. IEEE Trans Med Imag. 2001;20(7):559–567. doi: 10.1109/42.932741. [DOI] [PubMed] [Google Scholar]
- 22.Guo Q, Ruiz V, Shao J, Guo F: A novel approach to mass abnormality detection in mammographic images. In Proceedings of the IASTED International Conference on Biomedical Engineering, pp 180–185, Innsbruck, Austria, February 2005
- 23.Caldwell CB, Stapleton SJ, Holdsworth DW, Jong RA, Weiser WJ, Cooke G, Yaffe MJ. Characterization of mammographic parenchymal pattern by fractal dimension. Phys Med Biol. 1990;35(2):235–247. doi: 10.1088/0031-9155/35/2/004. [DOI] [PubMed] [Google Scholar]
- 24.Byng JW, Boyd NF, Fishell E, Jong RA, Yaffe MJ. Automated analysis of mammographic densities. Phys Med Biol. 1996;41:909–923. doi: 10.1088/0031-9155/41/5/007. [DOI] [PubMed] [Google Scholar]
- 25.Iftekharuddin KM, Jia W, Marsh R. Fractal analysis of tumor in brain MR images. Mach Vis Appl. 2003;13:352–362. doi: 10.1007/s00138-002-0087-9. [DOI] [Google Scholar]
- 26.Wu CM, Chen YC, Hsieh KS. Texture features for classification of ultrasonic liver images. IEEE Trans Med Imag. 1992;11(2):141–152. doi: 10.1109/42.141636. [DOI] [PubMed] [Google Scholar]
- 27.Esgiar AN, Naguib RNG, Sharif BS, Bennett MK, Murray A. Fractal analysis in the detection of colonic cancer images. IEEE Trans Inf Technol Biomed. 2002;6(1):54–58. doi: 10.1109/4233.992163. [DOI] [PubMed] [Google Scholar]
- 28.Lee TK, McLean DI, Atkins MS. Irregularity index: a new border irregularity measure for cutaneous melanocytic lesions. Med Image Anal. 2003;7:47–64. doi: 10.1016/S1361-8415(02)00090-7. [DOI] [PubMed] [Google Scholar]
- 29.Kikuchi K, Kozuma S, Sakamaki K, Saito M, Marumo G, Yasugi T, Taketani Y. Fractal tumor growth of ovarian cancer: sonographic evaluation. Gynecol Oncol. 2002;87:295–302. doi: 10.1006/gyno.2002.6842. [DOI] [PubMed] [Google Scholar]
- 30.Nam SH, Choi JY: A method of image enhancement and fractal dimension for detection of microcalcifications in mammogram. In Proceedings of the 20th Annual International Conference of the IEEE Engineering in Medicine and Biology Society, pp 1009–1011, Hong Kong, 1998
- 31.Nguyen TM, Rangayyan RM: Fractal analysis of contours of mammographic masses. In Third IASTED International Conference on Biomedical Engineering, pp 186–191, Innsbruck, Austria, February 2005
- 32.Rangayyan RM, Nguyen TM: Pattern classification of breast masses via fractal analysis of their contours. In Computer Assisted Radiology and Surgery, pp 1041–1046, Berlin, Germany, June 2005. International Congress Series, Elsevier
- 33.Nguyen TM, Rangayyan RM: Shape analysis of breast masses in mammograms via the fractal dimension. In Proceedings of the 27th Annual International Conference of the IEEE Engineering in Medicine and Biology Society (CD-ROM), p 4, paper number 1852, Shanghai, China, September 2005 [DOI] [PubMed]
- 34.Provine JA, Rangayyan RM. Lossless compression of Peanoscanned images. J Electron Imaging. 1994;3(2):176–181. doi: 10.1117/12.171928. [DOI] [Google Scholar]
- 35.Gazit Y, Baish JW, Safabakhsh N, Leunig M, Baxter LT, Jain LT. Fractal characteristics of tumor vascular architecture during tumor growth and regression. Microcirculation. 1997;4(4):395–402. doi: 10.3109/10739689709146803. [DOI] [PubMed] [Google Scholar]
- 36.Coelho RC, Cesar RM Jr, Costa LF. Assessing the fractal dimension and the normalized multiscale bending energy for applications in neuromorphometry. In Proceedings Simpósio Brasileiro de Computação Gráfica e Processamento de Imagens (SIBGRAPI-96), pp 353–554, Caxambu, Brazil, November 1996
- 37.Dubuc B, Roques-Carmes C, Tricot C, Zucker SW: The variation method: a technique to estimate the fractal dimension of surfaces. In Proceedings of SPIE, Volume 845: Visual Communication and Image Processing II, vol 845, pp 241–248, 1987
- 38.Weinstein RS, Majumdar S. Fractal geometry and vertebral compression fractures. J Bone Miner Res. 1994;9(11):1797–1802. doi: 10.1002/jbmr.5650091117. [DOI] [PubMed] [Google Scholar]
- 39.Sedivy R, Windischberger Ch, Svozil K, Moser E, Breitenecker G. Fractal analysis: an objective method for identifying atypical nuclei in dysplastic lesions of the cervix uteri. Gynecol Oncol. 1999;75:78–83. doi: 10.1006/gyno.1999.5516. [DOI] [PubMed] [Google Scholar]
- 40.Alto H, Rangayyan RM, Paranjape RB, Desautels JEL, Bryant H. An indexed atlas of digital mammograms for computer-aided diagnosis of breast cancer. Ann Telecommun. 2003;58:820–835. [Google Scholar]
- 41.The Mammographic Image Analysis Society digital mammogram database. http://www.wiau.man.ac.uk/services/MIAS/MIASweb.html, accessed June, 2004
- 42.Suckling J, Parker J, Dance DR, Astley S, Hutt I, Boggis CRM, Ricketts I, Stamatakis E, Cerneaz N, Kok SL, Taylor P, Betal D, Savage J: The Mammographic Image Analysis Society digital mammogram database. In Gale AG, Astley SM, Dance DR, and Cairns AY, (eds.), Proceedings of the 2nd International Workshop on Digital Mammography, vol 1069 of Excerpta Medica International Congress Series, pp 375–378, York, UK, July 1994
- 43.Department of Mathematics and Statistics at Boston University, http://math.bu.edu/DYSYS/chaos-game/node6.html/. Fractal Dimension, accessed October, 2004
- 44.Shen L, Rangayyan RM, Desautels JEL. Detection and classification of mammographic calcifications. Int J Pattern Recogn Artif Intell. 1993;7(6):1403–1416. doi: 10.1142/S0218001493000686. [DOI] [Google Scholar]
- 45.Shen L, Rangayyan RM, Desautels JEL. Application of shape analysis to mammographic calcifications. IEEE Trans Med Imag. 1994;13(2):263–274. doi: 10.1109/42.293919. [DOI] [PubMed] [Google Scholar]
- 46.Metz CE. Basic principles of ROC analysis. Semin Nucl Med. 1978;VIII(4):283–298. doi: 10.1016/S0001-2998(78)80014-2. [DOI] [PubMed] [Google Scholar]
- 47.Haralick RM, Shanmugam K, Dinstein I. Textural features for image classification. IEEE Trans Syst Man Cybern. 1973;SMC-3(6):610–622. [Google Scholar]


