Abstract
Medical images produced by x-ray detectors, computed tomography (CT) scanners, and other modalities typically contain between 12–16 bits/pixel, which corresponds to 4,096–65,536 shades of gray. On the other hand, we see that these images are visualized by means of medical displays that have much lower available number of gray shades. For a long time medical LCDs only supported 8 bits or 256 shades of gray per pixel. With the introduction of medical displays optimized for mammography, the available number of gray scales increased to 1,024. Recently, several manufacturers announced new display systems with higher bit depth. Because higher bit depth often directly results in higher display cost, it is a logical question to ask if this is required or even useful at all. This paper will give an answer by investigating several aspects such as limitations of the human visual system, digital imaging and communication in medicine grayscale standard display function calibration, and characteristics of medical LCDs.
Key words: Medical display, grayscale resolution, bit depth, shades of gray, GSDF, human visual system
Introduction
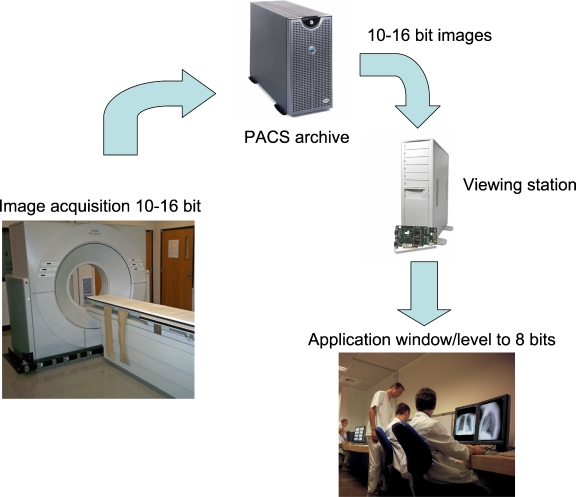
Medical images produced by x-ray detectors, computed tomography (CT) scanners, and other modalities typically contain between 12–16 bits/pixel, which corresponds to 4,096 to 65,536 shades of gray. On the other hand, we see that these images are being visualized by means of medical displays that have much lower available number of gray shades (typically 256 or 1,024) (Fig. 1). Visualization is also often limited to 8 bits because most viewing applications only support 8 bits or 256 shades of gray. Moreover, for high-resolution displays, the available bandwidth on the link between graphical board and the display also becomes a bottleneck and makes it difficult to transmit more than 8 bits/pixel over the link. To overcome this large difference in bit depth between source images and rendered images and to avoid that critical image information is lost, radiologists have the possibility to apply window leveling to the displayed images. In this way, all grayscales present in the input image can be visualized sequentially in time by mapping part of the input grayscales to the available gray levels of the display. Of course window leveling increases the time needed to analyze a medical image.
Fig 1.
Image chain from acquisition up to visualization.
For a long time medical LCDs only supported 8 bits or 256 shades of gray per pixel. With the introduction of medical displays optimized for mammography,1 the available number of gray scales increased to 1,024.
Recently, several manufacturers of medical displays announced new systems2,3 with even higher bit depth. Because the higher bit depth often directly results in higher display cost, it is a logical question to ask if this higher bit depth is required or even useful at all. This paper will answer this question by investigating several important aspects. As a first step, we will investigate how many shades of gray a human observer is able to discriminate. After all, it has no use to display more information than the observer (the radiologist) is able to see. Once we have determined this maximum perceivable number of gray shades, we will describe what is needed at the display side to achieve this optimal situation. Finally, a number of observations will be made related to critical characteristics of medical displays nowadays.
Material and Methods
Limits of the Human Visual System
We will first determine what the limits of the human visual system are related to grayscale resolution. In other words, how many grayscales can a human observer see in optimal conditions? There exist several models of the human visual system such as those proposed by Movshon and Kiorpes4 and Daly,5 which, in medical imaging, especially the Barten model,6,7 is frequently used and is generally accepted as valid. The Barten model is based on experimental data in which the eye is adapted to the luminance value of a uniform background, the state of so-called variable adaptation (see pp. 80–81 in Assessment of Display Performance for Medical Imaging Systems8). The model contains all aspects of the threshold detection of sine wave targets surrounded by a luminance equal to the target average luminance. Barten’s model of the human visual system considers neural noise, lateral inhibition, photon noise, external noise, limited integration capability, the optical modulation transfer function of the eye, and orientation and temporal filtering. Based on this model a unit called just noticeable difference (JND) was defined. A JND is the luminance difference of a given target under given viewing conditions that the average observer can just perceive. The JND is a statistical, rather than an exact quantity: From trial to trial, the difference that a given person notices will vary somewhat, and it was therefore necessary to conduct many trials in order to determine the exact threshold. The JND usually reported is the difference that a person notices on 50% of trials.
In the context of medical displays, a JND means the smallest difference in luminance (between two gray levels) that the average observer can just perceive on the display system. If the luminance difference between two gray levels is larger than 1 JND then the average observer will be able to discriminate between these two gray levels. On the other hand, if the luminance difference between two gray levels is less than 1 JND, then the average observer will perceive these two gray levels as being only one level.
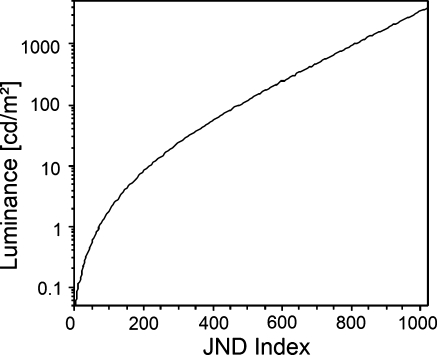
Figure 2 shows the luminance (in candelas per square meter) in function of the JND index as defined by Barten. It follows from this figure that in the luminance range of 0 to 4,000 cd/m2, there are approximately 1,000 JND. This means that a human observer is able to perceive around 1,000 different shades of gray over this entire luminance range and in optimal conditions. Figure 2 also indicates that the human eye is relatively less sensitive in dark compared to bright environment. Indeed, over the luminance range 0.1 to 10 cd/m2 (two orders of magnitude) there are around 200 JND while over the range 10 to 1000 cd/m2 (also two orders of magnitude) there are around 600 JND available. When luminance exceeds 10 cd/m2, the human eye follows an almost purely logarithmic behavior.
Fig 2.
Luminance in function of JND index as defined by Barten.
To facilitate calculations, a mathematical formula has been defined9 to describe luminance L as a function of the just noticeable difference index (JND index) and vice versa. This formula forms the basis of the digital imaging and communication in medicine (DICOM) grayscale standard display function (GSDF) (Fig. 3).
Fig 3.
Mathematical formulas for conversion between luminance and JND space.
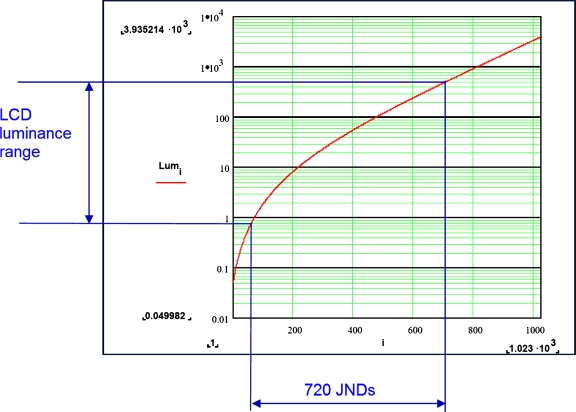
Nowadays, typical medical displays have luminance ranges between 0.8 and 600 cd/m2. As can be seen from Figure 4, it is possible for a human observer to perceive around 720 different shades of gray on such display. Prototype displays have been demonstrated with luminance range between 0.5 and 2,000 cd/m2. According to the above formulas, 0.5 cd/m2 corresponds to JND index 47 and 2,000 cd/m2 corresponds to JND index 917. Therefore, in optimal conditions it is possible for a human observer to perceive around 870 different shades of gray on such prototype display system. Because 9 bits correspond to 512 levels of gray and 10 bits to 1,024 levels of gray, it is clear that a display system capable of simultaneously showing 10 bits of gray already exceeds the capabilities of the human visual system.
Fig 4.
Human observers can perceive around 720 JND on a typical medical LCD.
There exist several limitations of the DICOM standard response (see pp. 80–81 in Assessment of Display Performance for Medical Imaging Systems8). It is known that the human visual system adapts to the average quantity of light falling on the retina when viewing the varied brightness of a medical image.10,11 This is referred to as fixed adaptation. However, the DICOM GSDF luminance response is based on contrast threshold data that is derived from experiments where the background luminance is changed to match the luminance of the target pattern where the observer fully adapts to the new background. Therefore, the contrast threshold associated with is based on variable adaptation.12
The contrast threshold of the human eye for variable adaptation differs significantly from that associated with fixed adaptation. This difference is shown in Figure 5, which is an extract from p. 81 of Assessment of Display Performance for Medical Imaging Systems.8 As can be seen from this figure, the visual contrast response under fixed adaptation conditions is worse in the bright and dark areas of an image. This means that for the brighter and darker image parts a JND corresponds to larger luminance differences than GSDF predicts and therefore subtle luminance differences will be more difficult to see. Moreover, GSDF describes the contrast threshold for specific spatial frequencies. A true medical image consists of features having a multitude of sizes, shapes, and spatial frequencies. This means that GSDF does not describe the optimal luminance response for visualizing specific medical images, as this is image content-dependent.
Fig 5.
Contrast threshold for variable and fixed visual adaptation.
Seeing these limitations of DICOM GSDF, it is clear that the number of gray shades that can be simultaneously perceived by a human observer will most likely be lower than GSDF predicts. In other words, the number of gray shades that can be simultaneously perceived by a human observer as described by GSDF should be considered as an upper limit.
Importance of Display Calibration
In the previous section, we have shown that the maximum number of gray levels that a human observer can perceive on a typical medical display is around 720 if one assumes variable adaptation. However, it is very important that the display fulfills specific requirements to achieve these optimal conditions. More specifically, the display should comply with the DICOM GSDF standard9 to make sure that all displayed gray levels are at equal distance when measured in just noticeable differences. This equal spacing in JND space is often called perceptual linearization.
Every display system has a specific native curve that describes the luminance behavior (cd/m2) of the display in function of the digital drive level or gray level. Typically, the native curve of a (medical) LCD display follows an S-shape-like curve that differs significantly from the ideal target DICOM GSDF curve as shown in Figure 2. Therefore, if one would just use this display then the perceptual distance between consecutive gray levels (as measured in just noticeable differences) would not be constant. In fact, some gray levels could have a distance smaller than 1 JND and therefore would not be perceived as being different anymore. Other gray levels could have too large distance resulting in banding artifacts.
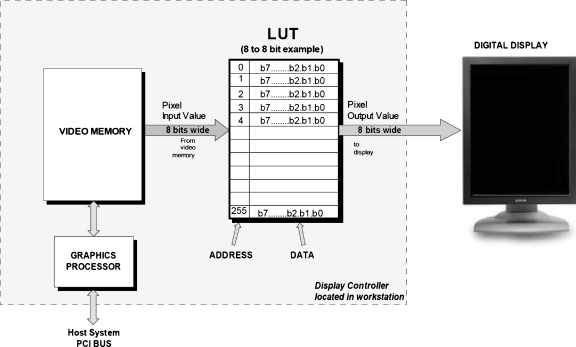
To overcome these problems, display systems are being calibrated to DICOM GSDF. With a luminance sensor the native curve of the display is measured (typically at the center of the display and for on-axis viewing). Based on the measured curve a lookup table (calibration lookup table) is calculated and configured. This lookup table changes the perceived luminance curve of the display to the required DICOM GSDF curve. This principle is illustrated in Figure 6: Incoming video data is sent through the calibration lookup table before being sent to the display. This lookup table is configured such that the resulting luminance curve as measured on the display will match the DICOM GSDF curve as good as possible.
Fig 6.
Concept of DICOM calibration by means of a calibration lookup table.
A display panel can only visualize a finite number of discrete gray levels. Therefore, the resulting curve after calibration will only be an approximation of the desired DICOM GSDF curve. Figure 7 shows that there is a so-called “quantization error” present. This quantization error follows from the fact that only a discrete number of panel gray levels are available (the inherent bit depth of the panel) and therefore the exact desired luminance value can often not be reached. It is clear that the size of the quantization errors will depend on the luminance difference between consecutive gray levels and therefore on the number of available panel gray levels. It is typical nowadays that medical LCDs have an inherent bit depth of between 10 and 12 bits (1,024 to 4,096 gray levels). Panel depths of more than 8 bits are usually achieved by means of spatial or temporal dithering.
Fig 7.
Quantization errors limit calibration accuracy.
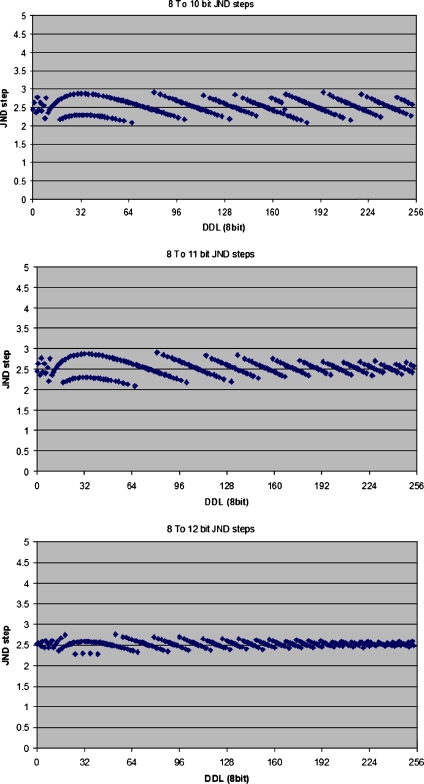
The next step is to determine what the inherent bit depth of the display panel should be so that there are sufficient gray levels available for accurate calibration. In other words, what is the maximal quantization error that can be tolerated? To answer this question simulations have been performed based on a medical LCD panel that renders 256 simultaneous shades of gray and has inherent panel depth of 10, 11, and 12 bits. For both configurations the panel has been calibrated to DICOM GSDF and the remaining deviation has been calculated. The results of these simulations are visible in Figure 8, where the difference in JNDs between each of the 256 gray levels (also called just noticeable differences per step) is shown. If the display were perfectly calibrated then this plot would show a constant value, meaning that the visible difference between each of the consecutive gray values is perfectly equal.
Fig. 8.
Just noticeable differences per step for inherent panel bit depth values of 10, 11 and 12 bits.
It can be seen from Figure 8 that there is certainly some improvement by increasing the inherent panel depth from 10 to 11 bits and this mainly in the higher luminance range. However, the difference between 11 and 12 bit is relatively small, certainly if one notices that the remaining deviations are in the range of 0.2 to 0.5 JND.
The next paragraphs will describe two important characteristics of medical LCDs that significantly influence DICOM compliance nowadays. It will be demonstrated that both effects are far more important than remaining quantization errors.
Effect of Display Viewing Angle
LCDs suffer from viewing angle dependency. When a user is looking to the display off-axis there will not only be a reduced luminance but the shape of the native transfer curve will also be different. These differences in transfer curve can be very substantial.13,14 Because medical displays are being calibrated for on-axis use it is clear that this will impact calibration accuracy for off-axis viewing. Several studies15,16,20 have shown that even small-viewing angles of 20 to 30° result into noncompliance with DICOM GSDF.
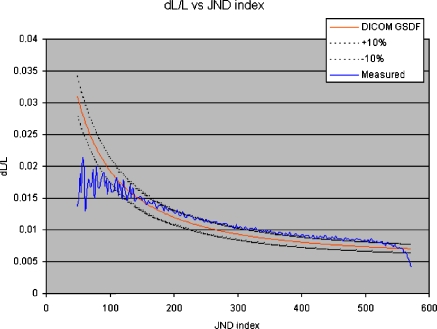
To give an idea of the effect of viewing angle dependency on DICOM, compliance measurements have been performed on a 5-Mpixel medical LCD. The LCD was calibrated to the DICOM standard by means of a sensor with small acceptance angle. The sensor was placed in the middle of the display and looking on-axis to the display. Then the sensor orientation was changed so that the viewing angle was 30° horizontally and DICOM GSDF compliance was tested. Figure 9 shows the typical dL/L metric (the slope of the luminance transfer curve of the display) as defined in NEMA.9 It is clear that the measured distortions are far beyond the tolerance of ±10%, as suggested by NEMA.9 These distortions are mainly present in the lower luminance range because there the transfer curve of our IPS LCD is more sensitive to changes in viewing angle. If we retest DICOM compliance of our display but for on-axis viewing and in the center of the display then the measured curve is (almost) exactly on top of the target curve, which means that calibration accuracy is (almost) perfect. In this second situation the calibration accuracy is mainly limited by quantization errors of the display. This also means that distortions because of viewing angle dependency are to a much larger degree impacting calibration accuracy compared to display quantization errors.
Fig 9.
dL/L for horizontal viewing angle 30°.
Effect of Display Spatial Noise
Medical LCD displays suffer from spatial noise. There are several causes of spatial noise: nonuniformity of the backlight is responsible for the typical luminance fall-off toward the borders of the display. Other causes are LCD cell artifacts causing higher frequency, pixel by pixel variations in the brightness of the display. Such artifacts are caused by tolerances on the storage capacitor of each LCD pixel, nonperfect rubbing of the LCD alignment layer, tolerances in the conductivity of the column and row conductors, and varying characteristics of the cell transistors or tolerances in the driver circuits. The superposition of all of these effects results in spatial noise, often also called mura, seen as a fixed, “cloudy” pattern on the LCD. It has been demonstrated17 that this spatial noise pattern is much larger (differences up to 10% in a 256×256 LCD pixel area are no exception) than the smallest difference in grayscale that can be shown on a modern LCD display. In other words, spatial noise is much more important than quantization noise. Therefore, it has no use to develop display panels with higher inherent bit depth (11 or 12 bits) unless spatial noise of the LCD panel is reduced accordingly.
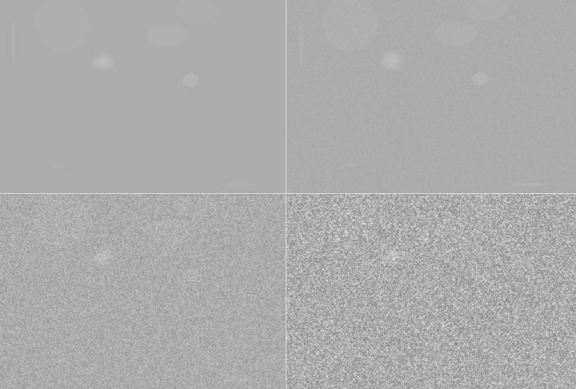
In a noisy environment it becomes more difficult to detect subtle signals in an image. This is the case for noise in the image data itself (because of detector noise, for example) but also for noise being added by the display system.18 This effect can easily be demonstrated by looking at Figure 10. This figure shows an original image (upper left) with several subtle signals such as ellipses, circles, and lines. In the other three images, an increasing amount of Gaussian noise has been added. It can be seen from these images that a higher amount of noise makes it much more difficult to detect these subtle signals. Barten’s model extended with external noise also confirms this (for more details we refer to Chap. 2 in Barten7). In the presence of noise the human observer will be able to see less shades of gray than in a noise-free environment. This stresses that the 900 simultaneously visible shades of gray that can theoretically be discriminated on a typical medical display should really be considered as an upper limit.
Fig 10.
Noise impacts visibility of subtle image features.
Discussion
We have demonstrated by using the Barten model that the human visual system has severe limitations concerning grayscale resolution. Even for high brightness and high contrast medical displays with luminance range between 0.5 and 2000 cd/m2, the human observer can perceive no more than around 900 shades of gray. Therefore, this is also a hard upper limit to the amount of grayscales in a medical viewing application and therefore also the medical display itself should present to a human observer. Based on this observation it is clear that display systems that are able to show 1,024 simultaneous shades of gray (10 bits) are sufficient for medical imaging. Display systems exceeding this specification will present to the human observer shades of gray that cannot be discriminated from each other anymore.
However, there is one major caveat. To be able to render these 900 visible gray levels, the display system needs to be calibrated to DICOM GSDF. Consider a display system capable of displaying 1,024 simultaneous shades of gray. In that case the calibration process will need to select 1,024 levels from a palette of available gray shades by means of a calibration lookup table so that all 1,024 shades of gray are at the same distance in JND space and therefore the display is perceptually linearized. Accurate calibration requires that the display panel has a higher inherent number of grayscales available to choose from. The simulation results of Figure 8 demonstrate that 11 bits (2,048 shades of gray) inherent display grayscale resolution is sufficient. Increasing the inherent panel bit depth to 12 bits only brings a limited incremental improvement.
Also, it has been shown that panel characteristics such as viewing angle behavior21 and spatial noise are far more important than the quantization noise (and therefore the inherent bit depth) of the panel. As a result, viewing angle and spatial noise will have much larger impact on the resulting calibration accuracy of the display compared to inherent bit depth. Increasing the inherent bit depth of the panel from 11 to 12 bits will hardly or not at all contribute to better display calibration accuracy if not at the same time the problem of viewing angle dependency and spatial noise is being resolved. In other words, it has no use to calibrate a medical display system with accuracy of around 0.5 JND if effects such as viewing angle dependency and spatial noise introduce distortions that are at least one order of magnitude larger. Recently, technology has been developed to overcome the problem of spatial noise. Bacher et al19 demonstrated that per pixel uniformity noise reduction on a 5-Mpixel LCD provides significantly better results for mammography reading compared to a standard 5-Mpixel LCD and CRT. These results were obtained with a contrast detail phantom.
Conclusions
Human observers are able to discriminate between 700 and 900 simultaneous shades of gray for the available luminance range of current medical displays and in optimal conditions. Therefore, it has no use to simultaneously display more than 10 bits of gray (1,024 gray shades) because this already exceeds the capabilities of the human visual system. To be able to perceive these 900 simultaneous shades of gray, calibration of medical display systems has shown to be extremely important. Accurate calibration requires approximately 11 bits of inherent display grayscale resolution.
In addition, we have demonstrated that effects such as viewing angle-dependence and spatial noise can significantly decrease the calibration accuracy. These effects are far more important than the difference between using a palette of 11 or 12 bits of gray.
References
- 1.Barco Coronis 5MP Mammo. Available at http://www.barco.com/barcoview/downloads/Coronis5MPMammo.pdf
- 2.Totoku Me351i. Available at http://www.totoku.com/display/products/medical/me351i/index.html
- 3.Eizo Radiforce G31. Available at http://www.radiforce.com/en/products/mono-g31.html
- 4.Movshon T, Kiorpes L. Analysis of the development of spatial sensitivity in monkey and human infants. J Opt Soc Am A. 1988;5(12):2166–2172. doi: 10.1364/JOSAA.5.002166. [DOI] [PubMed] [Google Scholar]
- 5.Daly S. The visible differences predictor: An algorithm for the assessment of image fidelity, Chap. 13. In: Wastson AB, editor. Digital Images and Human Vision. Cambridge, MA: MIT Press; 1993. [Google Scholar]
- 6.Barten PGJ. Physical model for contrast sensitivity of the human eye. Proc SPIE Int Soc Opt Eng. 1992;1666:57–72. [Google Scholar]
- 7.Barten PGJ. Contrast Sensitivity of the Human Eye and Its Effects on Image Quality. Bellingham, WA: SPIE Press; 1999. [Google Scholar]
- 8.Assessment of Display Performance for Medical Imaging Systems, American Association of Physicists in Medicine (AAPM), Task Group 18. Available at http://deckard.mc.duke.edu/~samei/tg18_files/tg18.pdf
- 9.NEMA: Digital Imaging and Communications in Medicine (DICOM), Supplement 28: Grayscale Standard Display Function
- 10.Samei E. Digital mammography displays. In: Karellas A, Giger A, editors. Advances in Breast Imaging: Physics, Technology, and Clinical Applications. RSNA Categorical Course Syllabus. Oak Brook, IL: Radiological Society of North America (RSNA); 2004. pp. 135–143. [Google Scholar]
- 11.Samei E. Technological and psychophysical considerations for digital mammographic displays, AAPM/RSNA physics tutorial for residents. Radiographics. 2005;25:491–501. doi: 10.1148/rg.252045185. [DOI] [PubMed] [Google Scholar]
- 12.Flynn MJ, Kanicki J, Badano A, Eyler WR. High-fidelity electronic displays of digital radiographs. Radiographics. 1999;19:1653–1669. doi: 10.1148/radiographics.19.6.g99no081653. [DOI] [PubMed] [Google Scholar]
- 13.Badano A: Viewing Angle Comparison of IPS and VA Medical AMLCDs, SID 2005
- 14.Samei E, Wright SL. Effect of viewing angle response on DICOM compliance of liquid crystal displays. Proc SPIE Med Imaging. 2004;5371:170–177. [Google Scholar]
- 15.Samei E, Wright SL. Viewing angle performance of medical liquid crystal displays. Med Phys. 2006;33(3):645–654. doi: 10.1118/1.2168430. [DOI] [PubMed] [Google Scholar]
- 16.Badano A, Flynn MJ, Martin S, Kanicki J. Angular dependence of the luminance and contrast in medical monochrome liquid crystal displays. Med Phys. 2003;30(10):2602–2613. doi: 10.1118/1.1606449. [DOI] [PubMed] [Google Scholar]
- 17.Kimpe T, Xthona A, Matthijs P, De Paepe L. Solution for nonuniformities and spatial noise in medical LCD displays by using pixel-based correction. J Digit Imaging. 2005;18(3):209–218. doi: 10.1007/s10278-005-2939-0. [DOI] [PMC free article] [PubMed] [Google Scholar]
- 18.Muka E, Mertelmeier T, Slone RM, Senol E. Impact of phosphor luminance noise on the specification of high-resolution CRT displays for medical imaging. Proc SPIE Int Soc Opt Eng. 1997;2431:210–221. [Google Scholar]
- 19.Bacher K, et al. Image quality performance of liquid crystal display systems: influence of display resolution, magnification and window settings on contrast-detail detection. Eur J Radiol. 2006;58(3):471–479. doi: 10.1016/j.ejrad.2005.12.016. [DOI] [PubMed] [Google Scholar]
- 20.Badano A, Fifadara DH. Goniometric and conoscopic measurements of angular display contrast for one-, three-, five-, and nine-million-pixel medical liquid crystal displays. Med Phys. 2004;31(12):3452–3460. doi: 10.1118/1.1824198. [DOI] [PubMed] [Google Scholar]
- 21.Fifadara DH, Averbukh A, Channin DS, Badano A. Effect of viewing angle on luminance and contrast for a five-million-pixel monochrome display and a nine-million-pixel color liquid crystal display. J Digit Imaging. 2004;17(4):264–270. doi: 10.1007/s10278-004-1021-7. [DOI] [PMC free article] [PubMed] [Google Scholar]


