Abstract
Radiology workflows have become more distributed and complicated, and fewer tangible cues are available to the radiologist to help optimize task prioritization and selection. Additionally, faster scanners, more detailed exams, and increased demand for imaging services have precipitated a potential image overload for today's radiologists who are pressured to provide efficient, quality service in less time. Radiologists are faced with the task of operating within complex systems but are lacking tools to efficiently and effectively monitor these systems in real time. Dashboard technology can help address this deficiency in radiology and facilitate informed, optimized decisions about workflow. Possible areas of application include workflow consolidation, workload distribution, and urgency evaluation. Dashboards should be optimized, context-sensitive, customizable, and workflow-integrated. Further research is needed to identify the most important dashboard metrics, determine their optimal display, and validate their utility.
Key words: Dashboard, workflow, radiology informatics, user–computer interface
Background
Digital workflows are inevitable, and in the last decade, the adoption of picture archiving and communication systems (PACS) has clearly moved from “early adopter” to “early majority.” As a result, digital workflow models and the informatics infrastructures that support them are becoming increasingly complex. This increased complexity combined with exploding volumes and narrowing time constraints is creating an environment in which it is difficult for radiologists to know the real-time state of their systems and to make informed workflow decisions. This affects not only productivity, but also efficiency, accuracy, and quality. In the aeronautics industry, when the complexity of the flying systems exceeds human control, it is called “beyond the limits.”1 To safely operate under these conditions, new ways of efficiently summarizing and simplifying the vast amounts of data are required. Radiologists today are sitting at the controls of increasingly unmanageable digital workstations but lack the tools to effectively manage and control them. Radiologists end up “flying blind” while mounting problems are obscured by the complexity of the system. To the degree that this negatively impacts workflow, the relevance of the radiologist is threatened and patient care is compromised.
Complex Digital Workflows
Digital workflows present a number of challenges to the radiologist. For example, combining multiple computerized systems adds a great deal of complexity to the workflow. In addition to PACS, there are radiology information systems (RIS), dictation/speech recognition systems, preliminary report systems, digital teaching file systems, as well as hospital information systems and electronic health records. With the addition of each new application, we approach a combinatorial explosion for the radiologist who is faced with learning to operate multiple systems, each with different user environments.
In addition, digital radiology systems are, by nature, less tangible than their film and paper counterparts and afford fewer cues to understanding their state. In a film-based model, the physical location of the reading room usually defined the work responsibilities. Paper requisitions helped distribute and prioritize the workload, and it was easy to look around a reading room and find a tall stack of films to be interpreted. Moreover, the workflows of the technologist and radiologist were tightly linked—helping to insure that studies were properly prioritized and were not overlooked. In a digital world, worklists are electronic, workflows are decoupled, and locations are distributed. While this allows for greater workflow efficiency and workforce utilization, it also makes it more difficult for the radiologist to “see” the state of the overall system. Looming problems can remain obscured until a crisis precipitates.
Predictable Human Limitations
The challenges of working in complex environments are well known, and predictable human failures result from system deficiencies.2 A common failure is relying on personnel to remember to initiate necessary actions, at appropriate times, within a complex environment.3 Another failure occurs when an important event fails to produce a signal (imagine a phone without a ringer). Other failures are apparent when the state of the overall system is obscured by the noise from the individual components (i.e., “can't see the forest for the trees”) or when the relative importance of tasks is not evident.
As in other areas of medicine, a systems-based approach is needed to compensate for these known human limitations. Software tools are needed that optimize the radiologists' ability to initiate informed, appropriate, timely actions. Although the efficacy of monitors and reminders in clinical settings is well documented,4–8 there have been few efforts in radiology to use them,9,10 and none have had a systematic, PACS-integrated approach.
The Digital Dashboard
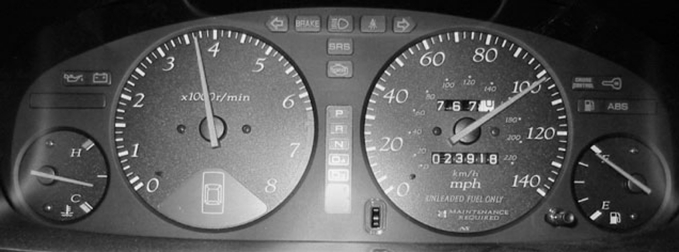
Many industries have used dashboards to address the challenges of “seeing” the state of complex systems (Fig 1). A dashboard is a concise, context-specific display of key metrics for quick evaluation of multiple subsystems. In computing, digital dashboards can integrate information from multiple components into a unified, interactive display—presenting it as though it all came from one source. This type of “meta” system allows users to quickly view the overall state of multiple subsystems and facilitates informed, optimized decision making. Despite being common in administrative settings,11–15 digital dashboards in clinical settings are rare.
Fig 1.
The familiar automobile dashboard where real-time, context-specific driving indicators are located (image by Aaron Logan, used with permission).
Potential Applications within Radiology
The following sections provide examples of dash-board components that may be helpful for monitoring numerous radiology system metrics and displaying them for quick evaluation by a radiologist. A prototype of this system is currently being developed and implemented at our institution.
Workflow Consolidation
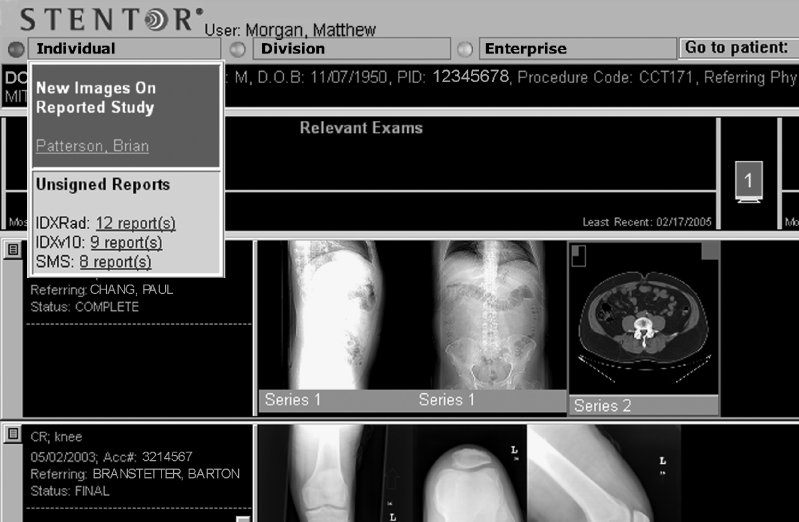
Quality radiology service includes timely report finalization. In departments that use transcription services, there is often a variable delay in finalizing reports after transcription. Most workflow models require the radiologist to remember to periodically break from the usual workflow to check his or her personal queue for unsigned reports. This process can add unnecessary delay to report turnaround when radiologists either forget to check their queues or allow them to accumulate high numbers of studies before signing them. A PACS-integrated dashboard component could address this problem by monitoring the radiologist's personal unsigned report queue, producing alerts at personalized, predefined, context-specific thresholds, and providing seamless, integrated entry to the report editing system (Fig 2).
Fig 2.
The image viewing mode of the PACS where a radiologist spends the majority of time. The dashboard (located at the upper right of the screen) has three categories, Individual, Division, and Enterprise, each showing a status indicator based on the traffic light metaphor. A “dropdown” menu, which displays context-specific information and hyperlinks, appears when the mouse is moved over the status “light.” The status indicator for “Individual” is red, denoting a high priority event. A “dropdown” menu appears when the mouse is moved over the category “Individual” and alerts the radiologist that new images were received on one of his or her reported studies. Also, a count of the radiologist's unsigned reports is displayed with hyperlinks to a separate report editing system.
Workload Distribution
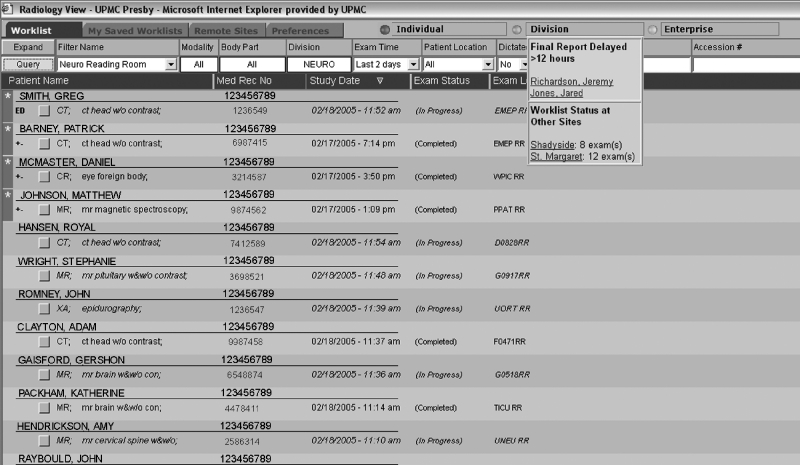
A central PACS shared by multiple institutions across the enterprise allows radiologists to share workload, but worklist filters are most frequently restricted to a single institution. When circumstances create a temporary staffing shortage (i.e., unexpected interventional procedures, meetings, vacations, etc.), workflow may become unbalanced, and unclaimed studies will begin to accumulate at one institution. Although there may be a capacity to share this developing workload among radiologists at other institutions, current workflow models require users to perform multiple distinct queries on different servers to assess each institution's status. Because most of the time there is no problem, there is little incentive for a radiologist to perform the necessary steps. A PACS-integrated dashboard component could address this problem by monitoring the number of unclaimed studies at other facilities and alerting users when the numbers surpass predefined, context-specific thresholds (Fig 3).
Fig 3.
A radiology departmental PACS worklist showing priority studies automatically sorted to the top and marked with red for quick identification. This example shows a yellow status for “Division” because of two patients for whom a final report has been delayed over 12 h and provides links to them. It also shows the status (green) of workflow at other sites with links to their worklists.
Urgency Evaluation
Imaging requests have differing priorities. For example, studies from the emergency department, ICU, and hospital wards are generally more time-sensitive than studies performed on outpatients. Because most PACS worklists can be filtered and sorted in idiosyncratic configurations, priority may easily be overlooked in the complexity of a multi-institutional PACS. When the urgency of a study is not appropriately managed, patient care decisions may be unnecessarily delayed, with possible adverse outcomes. Furthermore, some studies may be missed completely and go undictated for prolonged amounts of time. A PACS-integrated dashboard component could monitor predefined, context-specific time limits for particular types of studies and produce alerts for users when these limits are exceeded (Fig 3).
Design Considerations
Success or failure of dashboard technology for radiologists depends on several key design and implementation factors: interface optimization, context sensitivity, user customization, and workflow integration.
Interface Optimization
By definition, dashboards convey maximal information with minimal distraction. A dashboard with too many elements and inappropriate alerts is at best ignored and, at worst, a distracting annoyance. Optimized dashboard interface design will focus on the number and presentation state of display elements, the organizational schema for drilling down to more information, and the timing and style of alerts.
Context Specificity
Details such as radiologist subspecialty, institution, modality, imaged body part, patient location, and referring physician are strong determinants of workflow. For example, a head CT from the Emergency Department may be considered delayed if it exceeds a few minutes, whereas the same study completed as an outpatient may not require interpretation for several hours. Similarly, a chest radiologist may have hundreds of reports to sign in a day, whereas an angiographer may have less than 10. Because of these varied workflow determinants, dashboard monitors will need to incorporate context-sensitive parameters to effectively handle radiology's diverse workflows.
User Customization
Although common processes should be standardized and streamlined for efficiency, allowances must be made for the idiosyncratic practice patterns of individual radiologists. Just as most software contains a “user preferences” or “options” section, radiology dashboards should have customization tools to suit the particular preferences of the radiologist user. For example, users could define the thresholds at which they are notified of unsigned reports.
Workflow Integration
Although a system may be well designed and useful, it will likely be underutilized or ignored if it is “out of band,” i.e., if it requires the radiologist to deviate from usual workflow patterns. To be maximally effective, radiology dashboards should be integrated directly into the PACS workstation user interface, providing a portal for integration with other information systems. In this way, as radiologists are going about their regular duties, the dashboard can have maximal visibility and utility.
Technical Considerations
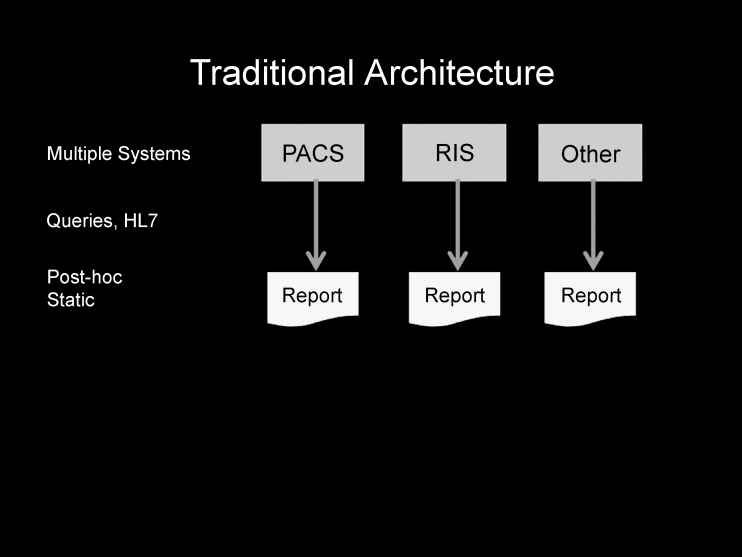
It is important to note that both the information and the methods for obtaining it already exist in most systems. Most departments already accumulate data and run reports for administrative and quality assurance purposes from their PACS, RIS, and/or other systems using standard methods and protocols such as Health Level Seven (HL7), Digital Imaging and Communications in Medicine, and/or database queries. The difference is that this information is static, post hoc, and cannot be “consumed” by other systems—severely limiting its utility (Fig 4).
Fig 4.
Traditional model of collecting data and running separate reports on multiple existing data sources. The reports are generally post hoc, are “static,” and lack integration and interactivity.
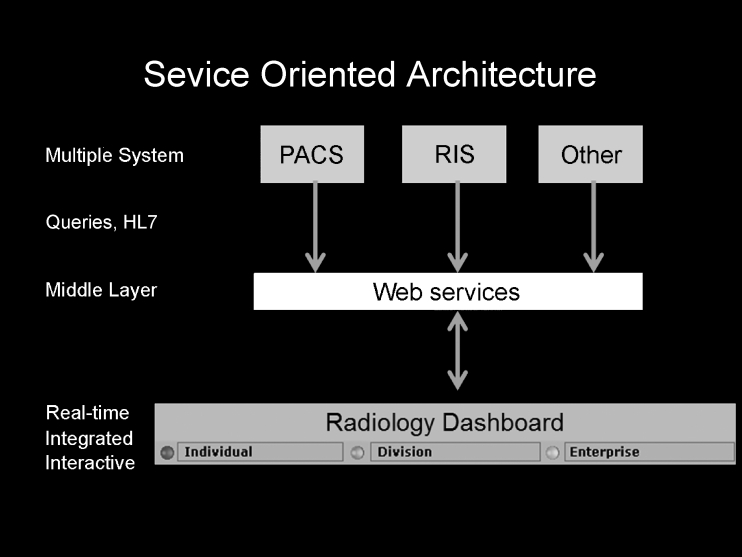
Because a dashboard requires real-time, integrated, and interactive information, the data must be made available in a more generalized, robust, on-demand way. Service-oriented architecture (SOA) is a method of encapsulating the data from any number of systems into a “middleware” layer and making it consumable by other systems—such as the dashboard (Fig 5). This middleware is built using standard programming methods and can be seamlessly integrated with any PACS that employs SOA. For departments whose PACS vendors have not yet embraced SOA, seamless integration of the dashboard into the user interface may not be possible. However, an interim solution may be to develop a dashboard that runs on the same Windows “desk-top” as the PACS, and while it may not be completely integrated into the user interface, it can employ the same principles of summarizing, monitoring, and alerting. It is hoped that more vendors will see the importance of this functionality and develop better ways to integrate with their systems.
Fig 5.
Using a “middleware” layer (service-oriented architecture), the data from multiple systems can be encapsulated in a centralized location for use by other systems. This enables integrated, real-time, interactive reporting, alerts, and reminders for applications such as the radiology dashboard.
Conclusion
Digital image management tools represent an important tactical component of a digital workflow strategy for meeting today's radiology challenges. However, increased complexity of digital systems and their supporting infrastructures have created an environment wherein it is difficult to “see” the state of the system. This results in predictable human failures and negatively impacts quality of service. Radiologists are faced with the task of operating within complex systems but lack the tools to efficiently and effectively monitor these systems in real time. A PACS-integrated digital dashboard can help address this system deficiency and facilitate informed, optimized workflow decisions. Possible applications include workflow consolidation, workload distribution, and urgency evaluation. A dashboard should be optimized, context-specific, customizable, and workflow-integrated. Most departments already gather the necessary data to create a dashboard and, by using middleware (Web services and SOA), can make it available to dashboard-type applications. With these approaches, radiologists can “see” the state of their system and avoid the risk of “flying blind.”
References
- 1.Andriole K: Addressing the Coming Radiology Crisis: The Society for Computer Applications in Radiology Transforming the Radiological Interpretation Process (TRIP) Initiative. Date accessed: August 30, 2004, http://www.scarnet.org/html/WhatisTRIP.html, 2003 [DOI] [PMC free article] [PubMed]
- 2. To Err is Human: Building a Safer Health System. Washington, DC: National Academy Press; 2000. [PubMed] [Google Scholar]
- 3.Leape LL. Error in medicine. JAMA. 1994;272:1851–1857. doi: 10.1001/jama.272.23.1851. [DOI] [PubMed] [Google Scholar]
- 4.Dexter PR, Perkins S, Overhage JM, Maharry K, Kohler RB, McDonald RB. A computerized reminder system to increase the use of preventive care for hospitalized patients. N Engl J Med. 2001;345:965–970. doi: 10.1056/NEJMsa010181. [DOI] [PubMed] [Google Scholar]
- 5.Hunt DL, Haynes RB, Hanna SE, Smith K. Effects of computer-based clinical decision support systems on physician performance and patient outcomes: a systematic review. JAMA. 1998;280:1339–1346. doi: 10.1001/jama.280.15.1339. [DOI] [PubMed] [Google Scholar]
- 6.Overhage JM, Tierney WM, McDonald CJ. Computer reminders to implement preventive care guidelines for hospitalized patients. Arch Intern Med. 1996;156:1551–1556. doi: 10.1001/archinte.156.14.1551. [DOI] [PubMed] [Google Scholar]
- 7.McDonald CJ, Hui SL, Smith DM, Tierney WM, Cohen SJ, Weinberger M, McCabe GP. Reminders to physicians from an introspective computer medical record. A two-year randomized trial. Ann Intern Med. 1984;100:130–138. doi: 10.7326/0003-4819-100-1-130. [DOI] [PubMed] [Google Scholar]
- 8.McDonald CJ. Protocol-based computer reminders, the quality of care and the non-perfectibility of man. N Engl J Med. 1976;295:1351–1355. doi: 10.1056/NEJM197612092952405. [DOI] [PubMed] [Google Scholar]
- 9.Andriole KP, Avrin DE, Weber E, Luth DM, Bazzill TM. Automated examination notification of emergency department images in a picture archiving and communication system. J Digit Imaging. 2001;14:143–144. doi: 10.1007/BF03190319. [DOI] [PMC free article] [PubMed] [Google Scholar]
- 10.Oguz KK, Yousem DM, Deluca T, Herskovits EH, Beauchamp NJ., Jr Impact of pager notification on report verification times. Acad Radiol. 2002;9:954–959. doi: 10.1016/s1076-6332(03)80466-x. [DOI] [PubMed] [Google Scholar]
- 11.Cleverley WO. Financial dashboard reporting for the hospital industry. J Health Care Finance. 2001;27:30–40. [PubMed] [Google Scholar]
- 12.Bernstein SL, Verghese V, Leung W, Lunney AT, Perez I. Development and validation of a new index to measure emergency department crowding. Acad Emerg Med. 2003;10:938–942. doi: 10.1197/S1069-6563(03)00311-7. [DOI] [PubMed] [Google Scholar]
- 13.Bader BS. CQI progress reports: the dashboard approach provides a better way to keep board informed about quality. Healthc Exec. 1993;8:8–11. [PubMed] [Google Scholar]
- 14.Seltzer SE, Kelly P, Deibel GM, Ros P. Radiology quality and performance metrics on the Web: a management information and communications tool. Acad Radiol. 2000;7:981–985. doi: 10.1016/s1076-6332(00)80182-8. [DOI] [PubMed] [Google Scholar]
- 15.Reports say diversion on the rise: use technology to overhaul patient flow. ED Manage 14:25–27, 2002 [PubMed]


